Wall Street’s Biggest Bear: We Are On Track For An Extremely Challenging March & April
As we noted yesterday, in his “Sunday Start” note Morgan Stanley’s Michael Wilson – better known here as Wall Street’s biggest bear (although BofA’s Michael Hartnett is certainly trying to steal that title) explained that while the market is obsessing over the ever-escalating situation in Ukraine, where nobody has any edge and where traders are at the whim of the Johari window’s “unknown unknowns“…
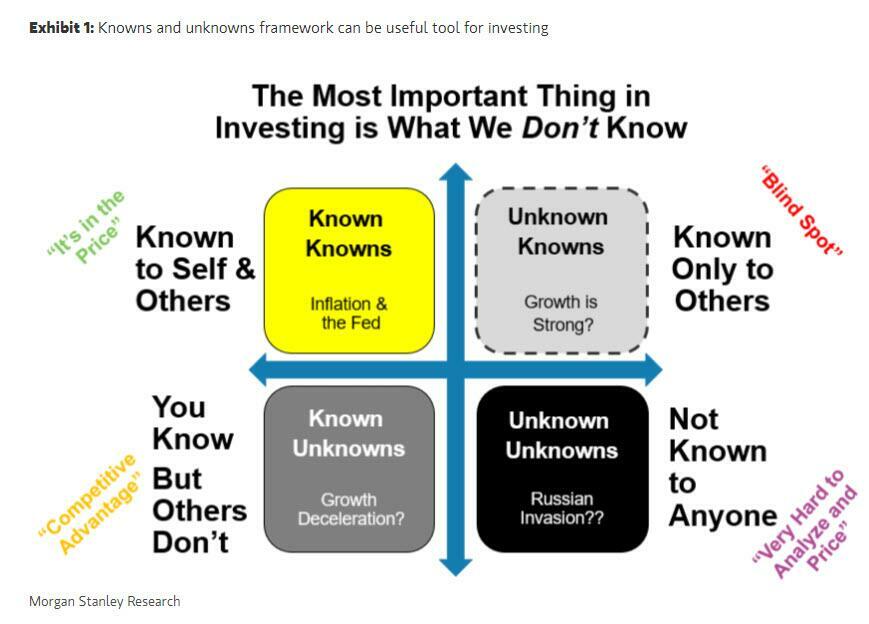
… what investors should be focusing on instead, is the arrival of what Wilson calls “ice” (i.e., a sharp slowdown in the economy coupled with a plunge in earnings), now that the market has finally accepted the other part of his ying-yang narrative, i.e., “fire” which means higher inflation = Fed tightening.
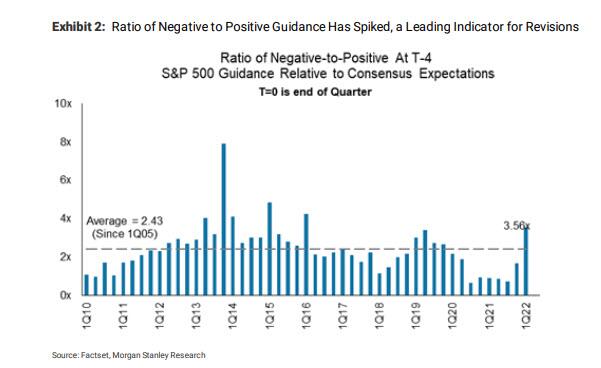
Admitting that he was premature to introduce for the “ice” anchor to his bearish last October, Wilson says that he pushed the timing of ice out to 1Q, in other words now, and sure enough, he cautions that “evidence is now building that earnings forecasts are increasingly at risk.” First, he points to the negative-to-positive guidance ratio during 4Q earnings has spiked to 3.6x – the highest since 1Q16, when we were mired in a global manufacturing recession: “At no time during the Covid recession did we see a ratio this high.”
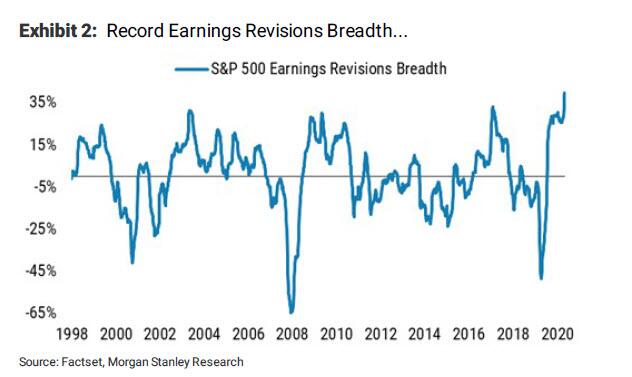
Wilson then went on to note that earnings revision breadth is also falling fast and approaching negative territory, which leads next-12-months EPS forecasts.
Tying it all together with the Ukraine war, Wilson urged clients to ignore the day-to-day gyrations there – “while there are many people who know quite a bit about such matters, geopolitics are very difficult to analyze and therefore very difficult to price” – and instead to continue selling into any rally (if not shorting) as the invasion simply “adds another risk to the mix that’s unlikely to disappear quickly. In a world where valuations remain elevated and earnings risk is rising, last week’s tactical rally in equities will likely run out of momentum in March as the Fed begins to tighten in earnest and the earnings picture deteriorates.”
On Monday, in his latest Weekly Warm-up note (available to pro subscribers in the usual place), Wilson frames how he sees this coming selloff, first reminding readers that he presented a price-analog comparing the S&P 500 today to what happened in 2018 as a guide for trading the near-term set-up. As we detailed in “Why Wall Street’s Biggest Bear Sees Stocks Tumbling To 3,800 By Late March“, Wilson suggested that the Russia/Ukraine conflict might provide a perfect reason for the S&P 500 to re-test its January lows “a re-test that investors should buy or at least cover up shorts.”
And indeed, Russia’s invasion on Wednesday night led to a very sharp sell-off on Thursday and led to the “textbook” re-test Wilson was looking for. The positive divergence on lower volume provided the opportunity to cover shorts and even get long some of the most beaten up areas of the market for those nimble enough to do it (Exhibit3).
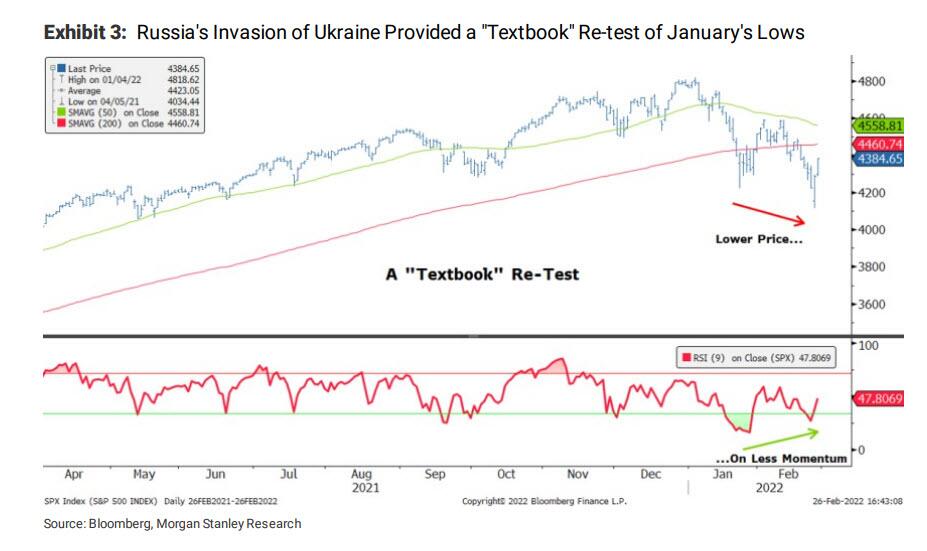
But while this technical set-up was (and maybe still is) bullish in the very near term, Wilson warns that “it does not look good for the intermediate term with all of the major averages below their respective 200-day moving averages and the 50-day moving average negatively sloped.” Furthermore, Wilson warns that the S&P 500 looks the strongest but it’s severely damaged and it will take time to repair before it can make a real swing at new highs. This weak technical picture in the primary index now mirrors the technical damage that’s been building for months under the surface; it also reflects the challenging fundamental backdrop of tightening financial conditions colliding with slowing growth — the core message in Morgan Stanley’s outlook for2022 in mid November.
Going back to the “2018 price analog” discussed last week, Wilson updated the chart to show that we’re still very much on track for what looks like an extremely challenging March/April after this short-term rally exhausts itself in the next few weeks.
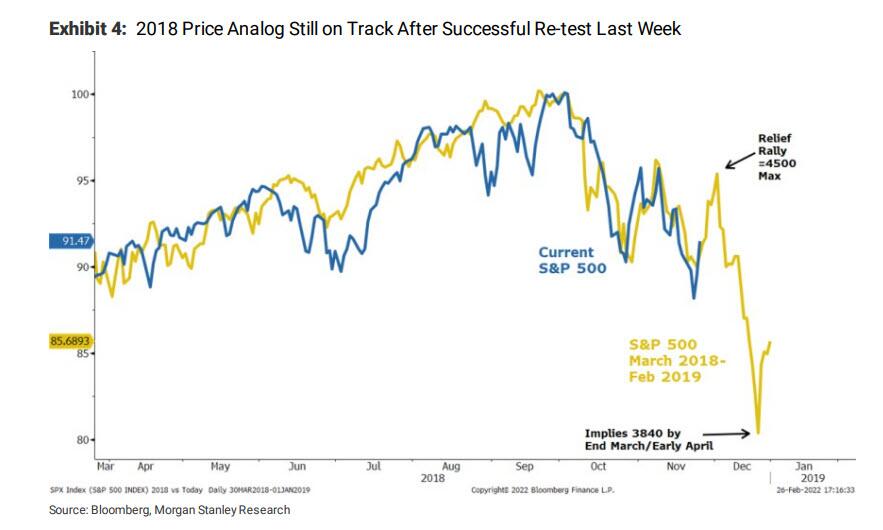
Looking at the chart above, the MS strategist says that equity markets could rally/hold up for another week or two “but we would be very careful if the S&P 500 approaches 4500 again.”
The bottom line, according to Wilson, is to “let the market work off its still oversold condition but use further strength to reduce risk in profitless growth stocks, low-quality cyclicals and stocks that are likely to be vulnerable to payback in demand from last year’s binge and escalating costs that can no longer be passed along so easily.”
To be sure, it’s important to point out that these price analog charts always break down at some point – as Wilson himself concedes – so we can’t use them for longer-range price forecasting. Furthermore, as he notes, one major difference with 2018 is the fact that the Fed is just starting a new tightening campaign today, while in December2018 they were at the end of that tightening cycle, which started several years prior with the tapering of QE (then again there is nothing preventing the Fed from going NIRP and or doubling down on QE).
In other words, Wilson would not be at all surprised if this price analog breaks down after the next decline which will take place in “late March/April. This is because the Fed won’t be able to pivot so dovishly like they did in early January 2019.”
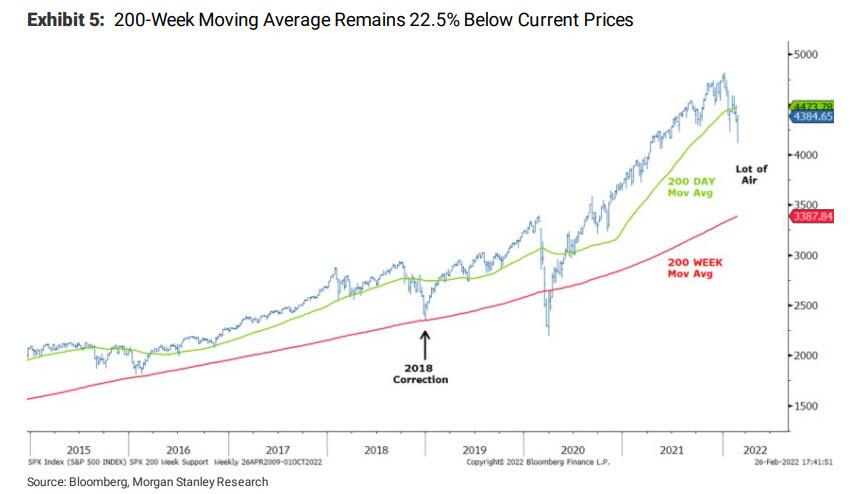
Here Wilson takes a step back and zooms out in the chart, reminding readers just how far stocks have rallied during this pandemic due to extraordinary policy “that drove both valuations and earnings to unsustainable levels.” True, we are now trading below the 200-day moving average for all the major averages, but stocks remain “extremely extended relative to the 200-week moving average which is the true long-term support to consider if things get rough when this tactical rally ends as we expect.”
Why does this matter? Because interestingly, it was the 200-week moving average that provided the support in 2018 to stop the decline. As such, Wilson strongly suggests taking this into account when thinking about risk-reward and committing new capital.
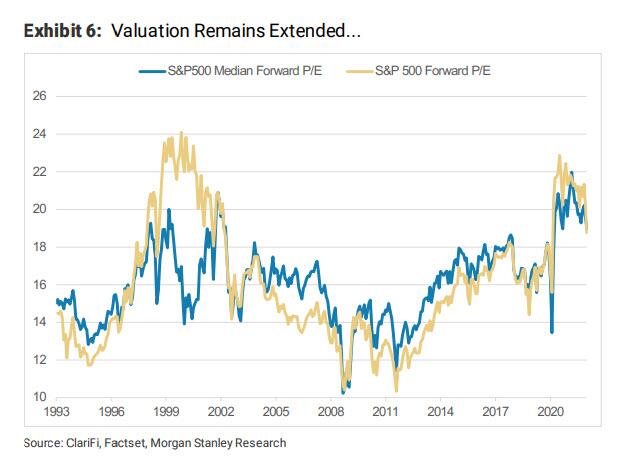
Lastly, Wilson flags that even after the recent turmoil, valuations still remain extended:
- at the S&P 500 index level,
- at the median stock level within the S&P 500…
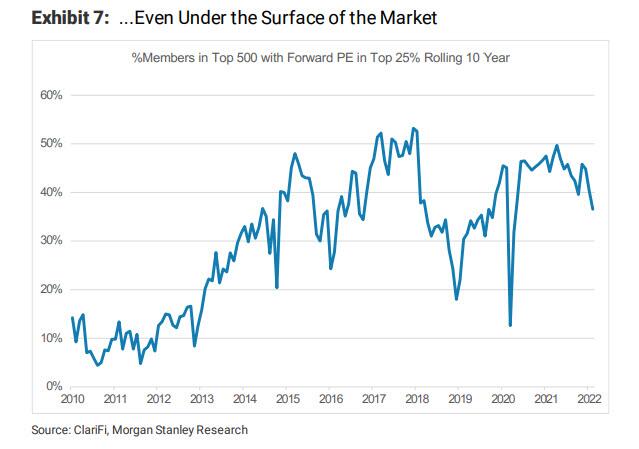
- … and under the surface of the market.
The median stock forward P/E for the S&P is still 19x (94th percentile of historical levels back 40 years). This, according to Wilson, supports the idea that multiples across the index have room to compress due to his Ice thesis, even after discounting the geopolitical developments of the last couple of weeks as well as a hawkish Fed.
As a reminder, the full note is available to professional subs.
Tyler Durden
Mon, 02/28/2022 – 15:28
via ZeroHedge News https://ift.tt/Q78UMYH Tyler Durden