Goldman Trader: Central Banks Appear Willing To Break Some Things
By Tony Pasquariello, head of hedge fund sales at Goldman Sachs
Ahead of this week’s FOMC meeting — and, alongside a blistering CPI print — global central banks stole the show. 50bps hikes from both the RBA and the RBI were mere calisthenics for the ECB, which put a knife in European assets following the reveal of a more protracted hiking cycle.
In turn, our European economics team now expects the following profile of hikes: 25 in July, 50 in both September and October, then 25 in December, February, March and June … taking you to a 1.75% terminal rate a year from now (link).
If you step away from the noise and the nuance, the moral of that story is global central banks face an increasingly intractable growth-vs-inflation tradeoff, and they appear willing to break some things – for now, anyway – in their journey to get inflation under control.
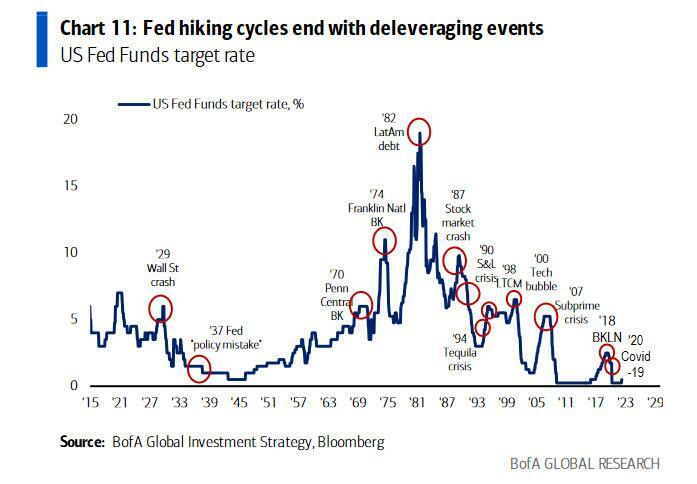
Again, this is not tightening for the sake of tightening, it’s a concession to the reality of a significant problem: from the start of 2009 through the end of 2019, headline US CPI has averaged 1.6%, but over the past year, it has averaged 6.9%.
What I’m trying to get at here: 2020 and 2021 were anomalistic in deeply fundamental ways; now we’re still working through the regime change that inevitably follows, and therefore the big dynamics in the risk management game have changed.
As for markets, while the local tone varies from week-to-week, the broad patterns remains intact and I’m not inclined to fight them: higher commodities prices (led by energy), higher interest rates (led by the belly) and a very choppy S&P tape where convexity still clearly favors the downside.
A short-form take a bunch of other items:
- 1. Following Friday’s CPI report – and, speaking of 50bps hikes –Goldman’s US economists are calling for that clip size at the FOMC meetings in June, July and now September (link).
- 2. In the context of how hugely extraordinary the policy environment has been, consider this simple side-by-side: the QE response to the GFC was $3.7tr; the (additional) fiscal response was $1.8tr. the QE response to COVID was $4.8tr; the (additional) fiscal response was $5tr.
- 3. Related: Bill Gates once remarked that “we always overestimate the change that will occur in the next two years, and underestimate the change that will occur in the next ten.” part of me wonders whether we’re still underestimating the change that will play out over the next two years, to say nothing of the next ten. And, no, I don’t think all that change is necessarily bad, as the arc of US history would generally suggest the opposite.
- 4. The flow-of-funds is set to get worse, not better. Demand from the systematic community and US corporates has been in the market over recent weeks. As June rolls on, I wouldn’t count on that sponsorship. Next week brings a major quarterly expiry — as ever, beware the black magic — and then sights will turn to quarter-end. I still believe the medium-term arbiter of equity prices is US households — who, perhaps miraculously, remain on the bid for mutual funds and ETF’s (+$35bn of inflows over the past 3 weeks, link).

- 5. There has been a lot of micro vs macro push-pulls in the recent data set. On one hand, the negative news from TGT and WMT received a ton of air time; on the other hand, broad measures of US consumption still look healthy. On one hand, some very high profile US tech companies have tapped the brakes on their hiring intentions; on the other hand, the US has created 1.2mm jobs over the past three months. Equipped with my major in English literature, one interpretation: (1) the low end consumer is under huge pressure, but comprises a small share of total US consumption; (2) tech companies comprise a huge share of equity market capitalization — and, therefore, the market’s attention — but, a comparatively smaller share of the US labor force; (3) the underlying rotation from goods-to-services makes the interpretation of the data set very challenging right now.
- 6. Presented without bias: despite the complexity of everything I just typed, S&P still trades at a forward P/E of 17, which places it in the 77th percentile of a data set that goes back 46 years.
- 7. The AUM in commodities is lower today than it was before the invasion of Ukraine (with the exception of oil, there’s been de-risking in most every other commodity market). That’s just another example to underscore that not enough risk capital has been committed to the single hottest asset class on planet Earth.
- 8. Speaking of commodities, the catchiest thing I read this week came from sales & trading colleague Mike Sullivan: XOM marked a fresh all-time high this week. think about that for a second, and then think about this: in October of 2020, ZM had a larger mkt cap than XOM. Today’s marks: XOM = $433bn; ZM = $32bn.
- 9. A related comment I saw on TWTR: “recession in tech-land as past excesses take their toll. the rest of the economy keeps going or even improves as capital and labor gets redirected” (@MarkGutman9).
- 10. More good news for the coffee drinkers: link.
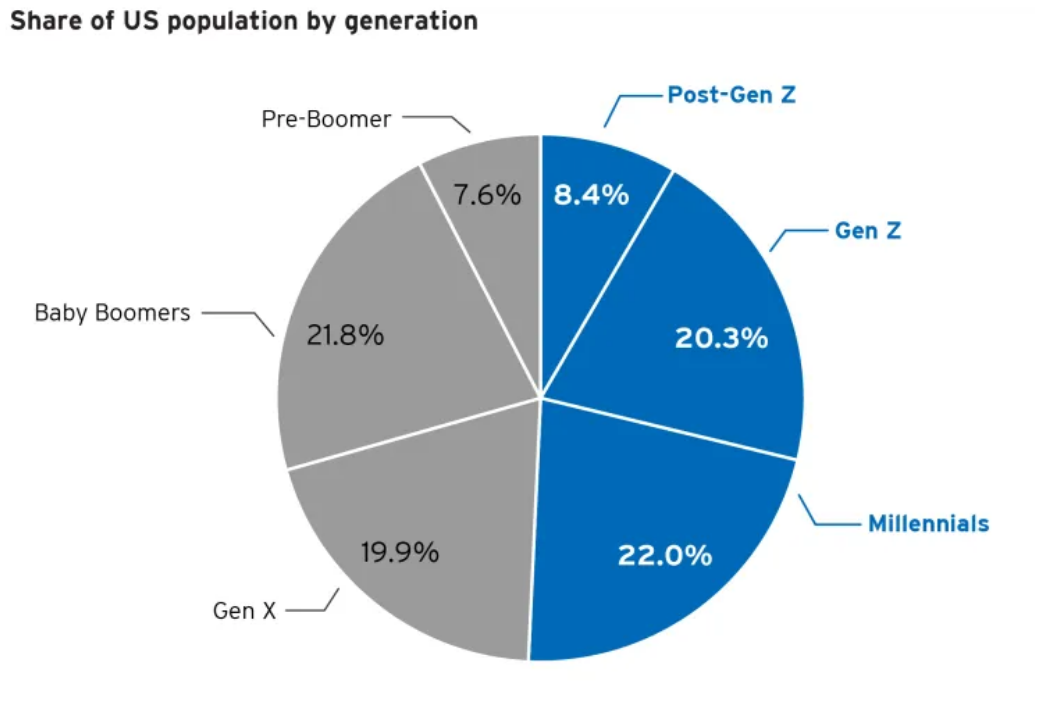
- 11. A random data point, but one that evidences how distinct today’s generation divides are: the share of 16-year olds getting their driver’s licenses in the US today is around half of what it was in the 1980’s (credit Lindsey Pollak / Federal Highway Administration).
- 12. Speaking of generational divides … Gen X, we need to stick together (link):
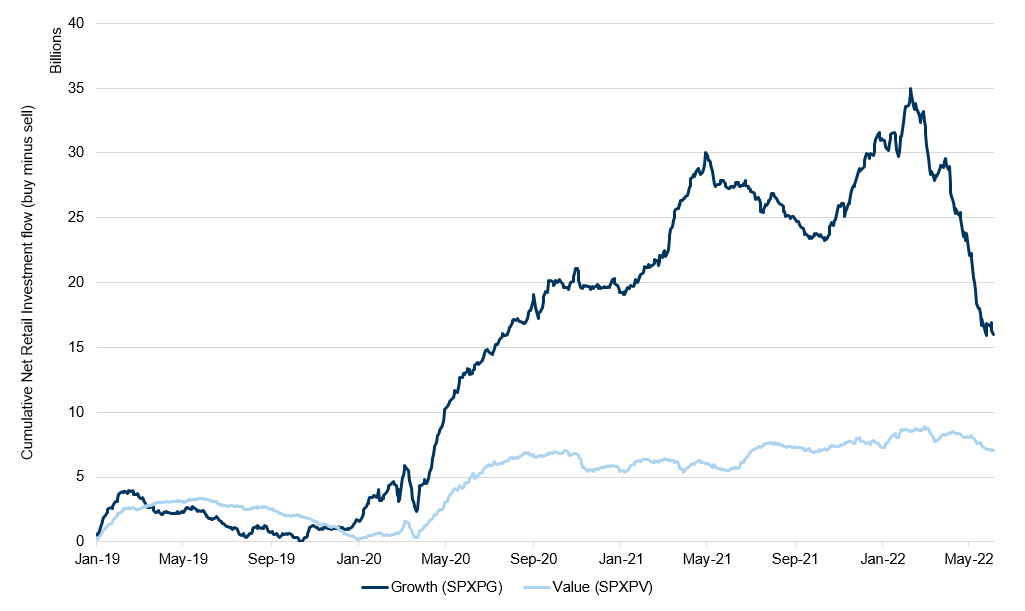
- 13. This is a striking chart of the flow-of-funds in value vs growth. To be clear on the methodology: “underlying data is from GSET calculations, based on public trade data. we look through every trade and decide whether it is retail based on specific flags, then our team aggregates the data by ticker, sector, index and style to understand the broader trends.” One more point from me: this is specific to single stocks, but it does not include ETFs or mutual funds (I tend to think a lot of single stock length has come out of the market, while fund length has not).
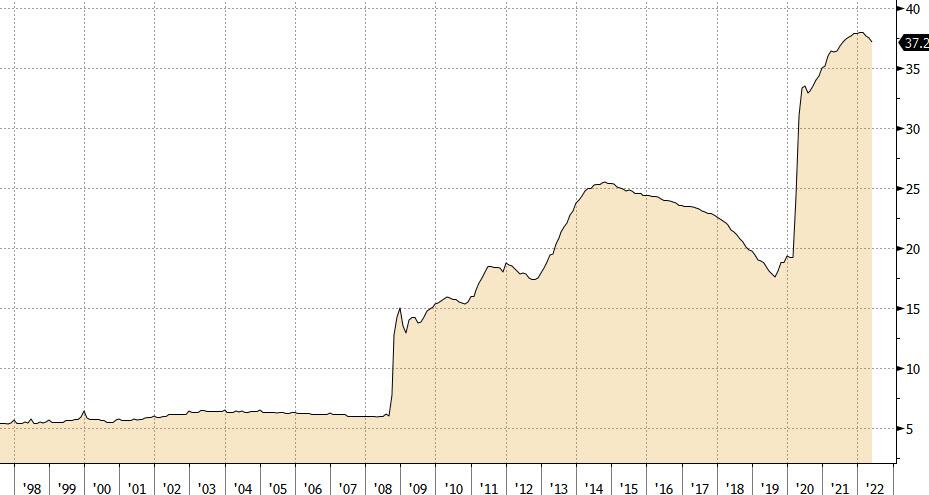
- 14. Back to the big ball: in the second quarter of 2008, for every one dollar of GDP, there was 6 cents on the Fed’s balance sheet … right before COVID hit, that number was 22 cents … it recently peaked at 37 cents and today stands at 36 cents. Looking forward, Goldman’s balance sheet runoff forecast implies that it will stand at 23 cents at the end of 2024 and 22 cents at the end of 2025 [ZH: you may want to revise that forecast].
- 15. US 5-year notes are the first point of the curve to get back to pre-LEH levels. Consider the big picture – as noted by GMD technician MacNeil Curry, 5’s are also the first point on the curve to end the pattern of lower highs and lows in place since … 1981:

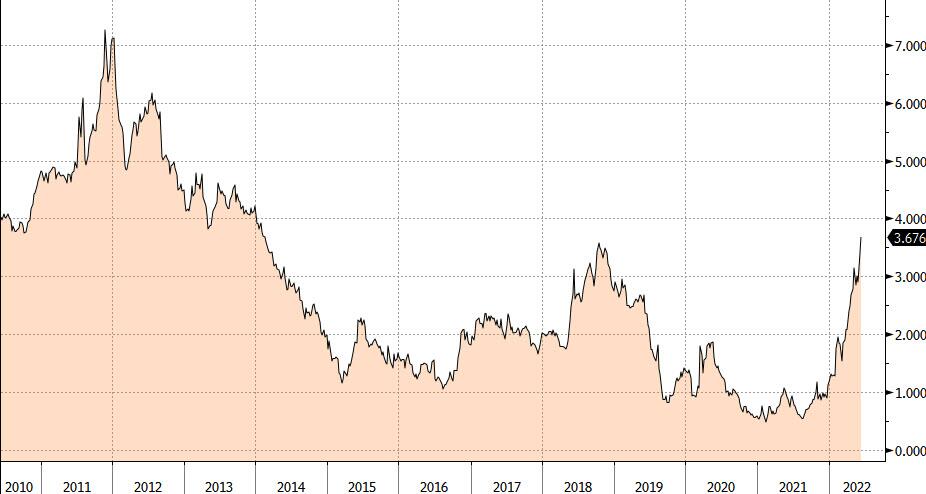
- 16. speaking of interest rate technicals, a simple plot of Italian BTP’s:
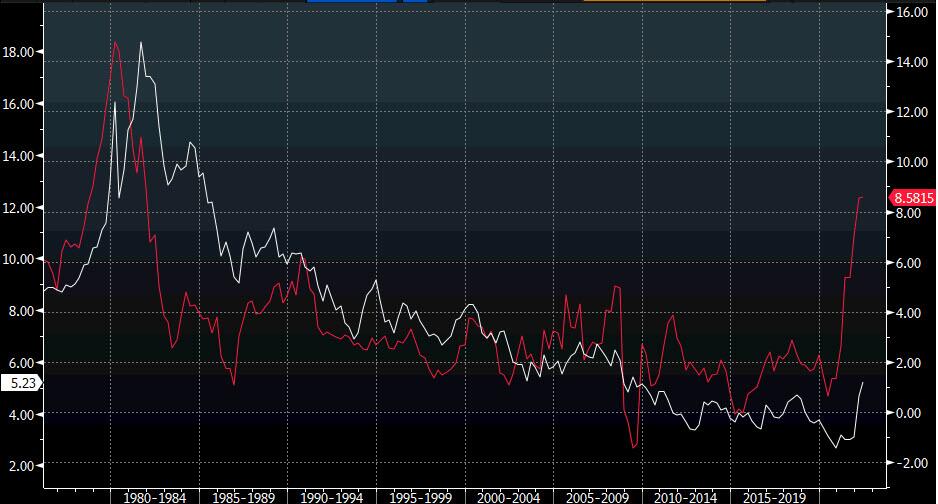
- 17. I shot this around earlier in the year and continue to wonder when and where it converges. the red line is headline CPI, the white line is 30-year mortgage rates:
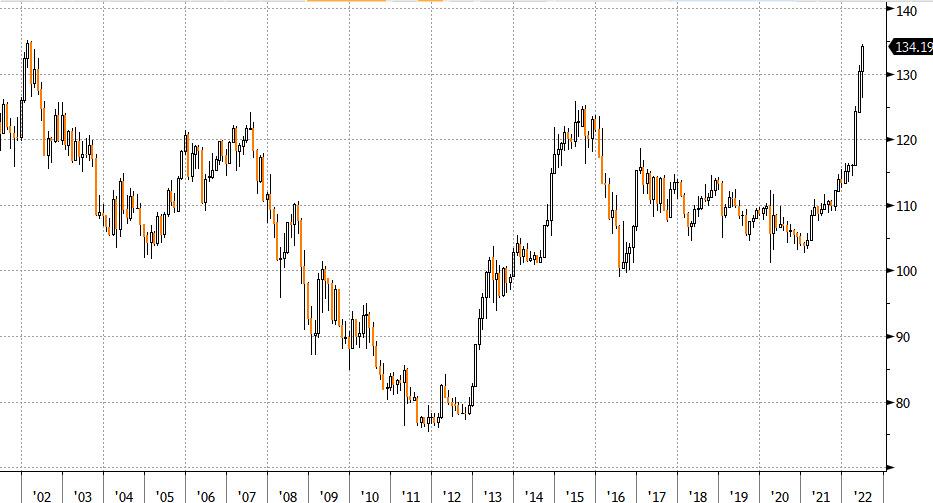
- 18. another simple chart of USD/JPY, another marker of how good the opportunity set has been in trend-following macro:
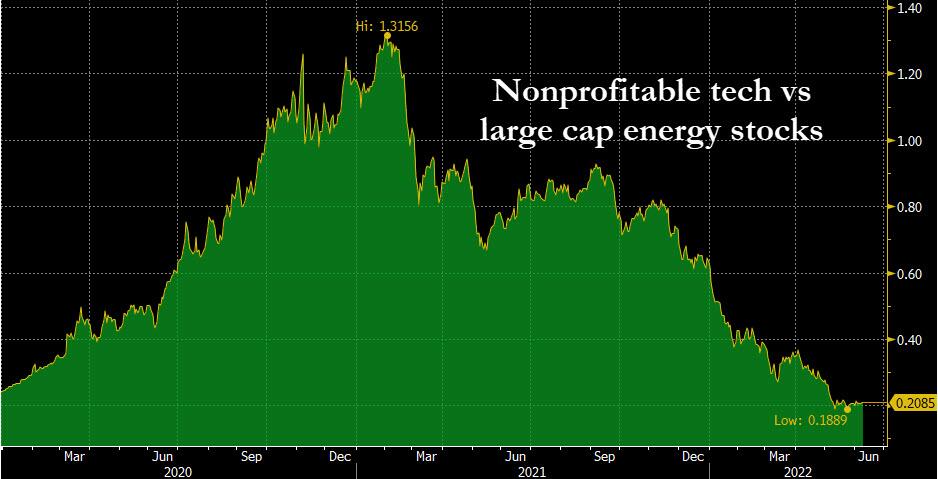
- 19. finally, with credit to Pete Callahan in GMD … a basket of non-profitable tech stocks vs large cap energy stocks … note the round trip:
Tyler Durden
Sun, 06/12/2022 – 13:44
via ZeroHedge News https://ift.tt/eOWjmfN Tyler Durden