These Are The Richest Billionaires In Each US State

These Are The Richest Billionaires In Each US State

The number of billionaires in the U.S. increased 5% compared to last year, going from 720 super wealthy individuals to 775.

As Visual Capitalist’s Avery Koop details below, the richest of the rich are concentrated in states like Texas, California, and New York, but there is almost one billionaire in every single state.

This map uses data from Forbes to showcase the wealthiest billionaire in each state.

The State-by-State Breakdown

According to Forbes, just four states are home to 61% of the country’s billionaires: California (179), New York (130), Florida (92), and Texas (73).

Here’s a closer look at the data on who takes the title of the richest in each state:

Name State Residence Net Worth (Est.) Source of Wealth
Jimmy Rane Alabama Abbeville $1.2 B Lumber
Arturo Moreno Arizona Phoenix $4.8 B Billboards, Los Angeles Angels
Jim Walton Arkansas Bentonville $64.4 B Walmart
Larry Page California Palo Alto $105.0 B Google
Philip Anschutz Colorado Denver $10.8 B Energy, sports, entertainment
Ray Dalio Connecticut Greenwich $19.1 B Hedge funds
Ken Griffin Florida Miami $32.7 B Hedge funds
Dan Cathy, Bubba Cathy, and Trudy Cathy White Georgia Atlanta $11.0 B Chick-fil-A
Larry Ellison Hawaii Lanai $146.0 B Oracle
Frank VanderSloot Idaho Idaho Falls $3.2 B Nutrition, wellness products
Lukas Walton Illinois Chicago $22.9 B Walmart
Carl Cook Indiana Bloomington $10.3 B Medical devices
Harry Stine Iowa Adel $6.9 B Agriculture
Charles Koch Kansas Wichitia $56.9 B Koch Industries
Tamara Gustavson Kentucky Lexington $7.3 B Self storage
Gayle Benson Louisiana New Orleans $4.7 B New Orleans Saints
Susan Alfond Maine Scarborough $2.7 B Shoes
Annette Lerner & family Maryland Chevy Chase $6.3 B Real Estate
Abigail Johnson Massachusetts Milton $21.0 B Fidelity
Daniel Gilbert Michigan Franklin $19.5 B Quicken Loans
Glen Taylor Minnesota Mankato $2.6 B Printing
Thomas Duff & James Duff Mississippi Hattiesburg $2.3 B Tires, diversified
John Morris Missouri Springfield $8.3 B Sporting goods retail
Dennis Washington Montana Missoula $6.4 B Construction, mining
Warren Buffet Nebraska Omaha $117.0 B Berkshire Hathaway
Mirian Adelson & family Nevada Las Vegas $36.2 B Casinos
Rick Cohen & family New Hampshire Keene $18.8 B Warehouse automation
Rocco Commisso New Jersey Saddle River $8.0 B Telecom
Ron Corio New Mexico Albuquerque $1.7 B Solar
Michael Bloomberg New York New York City $94.5 B Bloomberg LP
James Goodnight North Carolina Cary $9.3 B Software
Gary Tharaldson North Dakota Fargo $1.2 B Hotels
Lex Wexner & family Ohio New Albany $6.0 B Retail
Harold Hamm & family Oklahoma Oklahoma City $18.5 B Oil & gas
Phil Knight & family Oregon Hillsboro $41.8 B Nike
Jeff Yass Pennsylvania Haverford $28.5 B Trading, investments
Jonathan Nelson Rhode Island Providence $3.1 B Private equity
Robert Faith South Carolina Charleston $5.2 B Real estate management
T. Denny Sanford South Dakota Sioux Falls $2.0 B Banking, credit cards
Thomas Frist Jr. & family Tennessee Nashville $22.3 B Hospitals
Elon Musk Texas Austin $230.0 B Tesla, SpaceX
Gail Miller Utah Salt Lake City $4.2 B Car dealerships
John Abele Vermont Shelburne $1.9 B Healthcare
Jacqueline Mars Virginia The Plains $39.4 B Candy, pet food
Jeff Bezos Washington Medina $149.0 B Amazon
John Menard Jr. Wisconsin Eau Claire $18.1 B Home improvement stores
John Mars Wyoming Jackson $39.4 B Candy, pet food

Many billionaires in the U.S. are extremely well-known, such as California’s Larry Page, New York’s Michael Bloomberg, or Washington state’s Jeff Bezos.

Interestingly, Bill Gates doesn’t take the top spot as the richest billionaire in Washington because Bezos has a higher net worth—$149 billion vs. Gates’ $104 billion—although they do live in the exact same town of Medina, WA.

Nearly every state is home to at least one billionaire, some far wealthier than others, like Nebraska’s Warren Buffett ($117 billion), compared to Alabama’s Jimmy Rane ($1.2 billion). Some new states, which gained billionaires this year include Alabama, New Hampshire, and Vermont.

Billionaire Wealth

The number of billionaires globally is following a different trend than the one in the U.S., declining year-over-year, and seeing billionaire wealth overall decrease by $500 billion.

The U.S. is home to almost 30% of all the world’s billionaires and while a few like Sam Bankman-Fried and Kanye West lost their billionaire status this year, many continue to get richer. In addition to Ron Corio, New Mexico’s first ever billionaire, eight other individuals on the U.S. list gained billionaire status in the last four years.

Finance and investments, food and beverage, fashion and retail, and technology are the top sources of wealth for U.S. billionaires, with almost 50% of them gaining their fortunes from these specific industries.

Tyler Durden
Sat, 09/02/2023 – 23:00

via ZeroHedge News https://ift.tt/LPAfXrb Tyler Durden

Pentagon Extends Troop Deployment At US-Mexico Border Through September

Pentagon Extends Troop Deployment At US-Mexico Border Through September

Authored by Aldgra Fredly via The Epoch Times,

The U.S. Defense Department said Thursday that it will extend the deployment of up to 400 active-duty American troops at the U.S. southern border with Mexico until at least the end of September.

The Pentagon had pulled 1,100 troops from the border last month but extended the deployment of the remaining 400 soldiers.

“On Aug. 24, 2023, the secretary of defense approved an extension of up to 400 personnel providing support to Customs and Border Protection on the southwest border through Sept. 30, 2023,” Pentagon spokesman Lt. Col. Devin Robinson told NBC News on Sept. 1.

Secretary of Defense Lloyd Austin approved in May the deployment of 1,500 active-duty troops to the southern border for 90 days to assist border officials with a possible influx of illegal immigration at the border.

The Pentagon said the troops will “fill critical capability gaps, such as ground-based detection and monitoring, data entry, and warehouse support” but will not directly participate in law enforcement activities.

The troops were intended to help back up border officials dealing with the end of Title 42, which allowed U.S. authorities to quickly expel tens of thousands of migrants from the country in the name of protecting Americans from COVID-19.

Spike in Illegal Border Crossings

Data released by Customs and Border Protection (CBP) on Aug. 18 showed that the U.S. Border Patrol recorded 132,652 encounters between ports of entry along the southwest border in July, up from 99,545 in June.

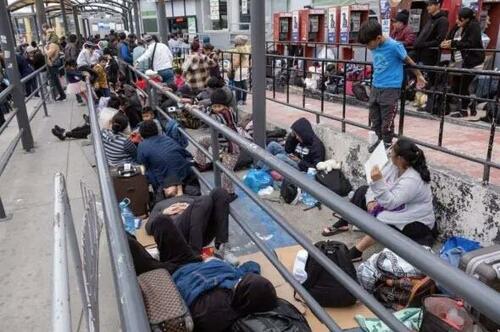
Migrants seeking asylum wait for U.S. Customs and Border Protection agents to allow them enter the United States at the San Ysidro crossing port on the US-Mexico border, as seen from Tijuana, Baja California state, Mexico on May 31, 2023. (Guillermo Arias/AFP via Getty Images)

According to CBP data, the U.S. Border Patrol encountered an average of 2,016 single adults per day in July alone, marking a 66 percent decrease from the 6,164 they encountered per day in the first 11 days of May.

“CBP’s message for anyone who is thinking of entering the United States without authorization or illegally along the southwest border is simple: don’t do it. When noncitizens cross the border unlawfully, they put their lives in peril,” it stated.

CBP One App

The latest numbers also reflect a sharp increase in use of the CBP One mobile app through which up to 1,450 migrants can get appointments at land crossings with Mexico to seek asylum. CBP processed more than 44,700 individuals with CBP One appointments at ports of entry in July.

CBP One is for people of any nationality in central and northern Mexico entering the United States by land and seeking asylum or humanitarian parole.

Migrants must book an appointment through the app and show up to the appointment at U.S. ports of entry. If they don’t have an appointment, they would be turned away.

Rep. Tom McClintock (R-Calif.) said on July 26 at the House Judiciary Committee hearing that the influx of people at the border has not decreased, noting that the CBP One app “allows migrants to bypass the southern border and enter directly in the United States’ ports of entry.”

“Instead of bringing them to the southern border, you’re bringing them directly to ports of entry,” Mr. McClintock said.

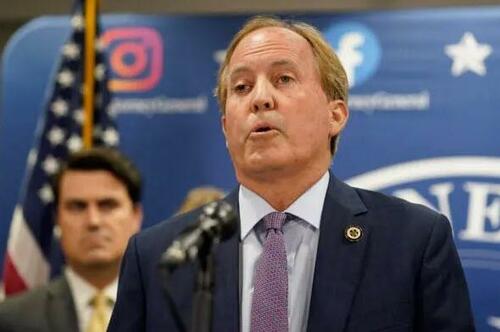
Texas Attorney General Ken Paxton makes a statement at his office in Austin, Texas, on May 26, 2023. (Eric Gay/AP Photo)

Texas Attorney General Ken Paxton filed a lawsuit against the Biden Administration on May 23 to challenge a rule that encourages illegal immigrants to use CBP One app to seek entry into the United States.

Mr. Paxton said the app encourages illegal immigration to the United States because it “cannot verify that an illegal immigrant would qualify for an exception, which would prevent them from being deported.”

“The Biden Administration deliberately conceived of this phone app with the goal of illegally pre-approving more foreign aliens to enter the country and go where they please once they arrive,” he said in a press release.

Tyler Durden
Sat, 09/02/2023 – 22:30

via ZeroHedge News https://ift.tt/KY2PbdJ Tyler Durden

Where Smoking Breaks The Bank (& Where It Doesn’t)

Where Smoking Breaks The Bank (& Where It Doesn’t)

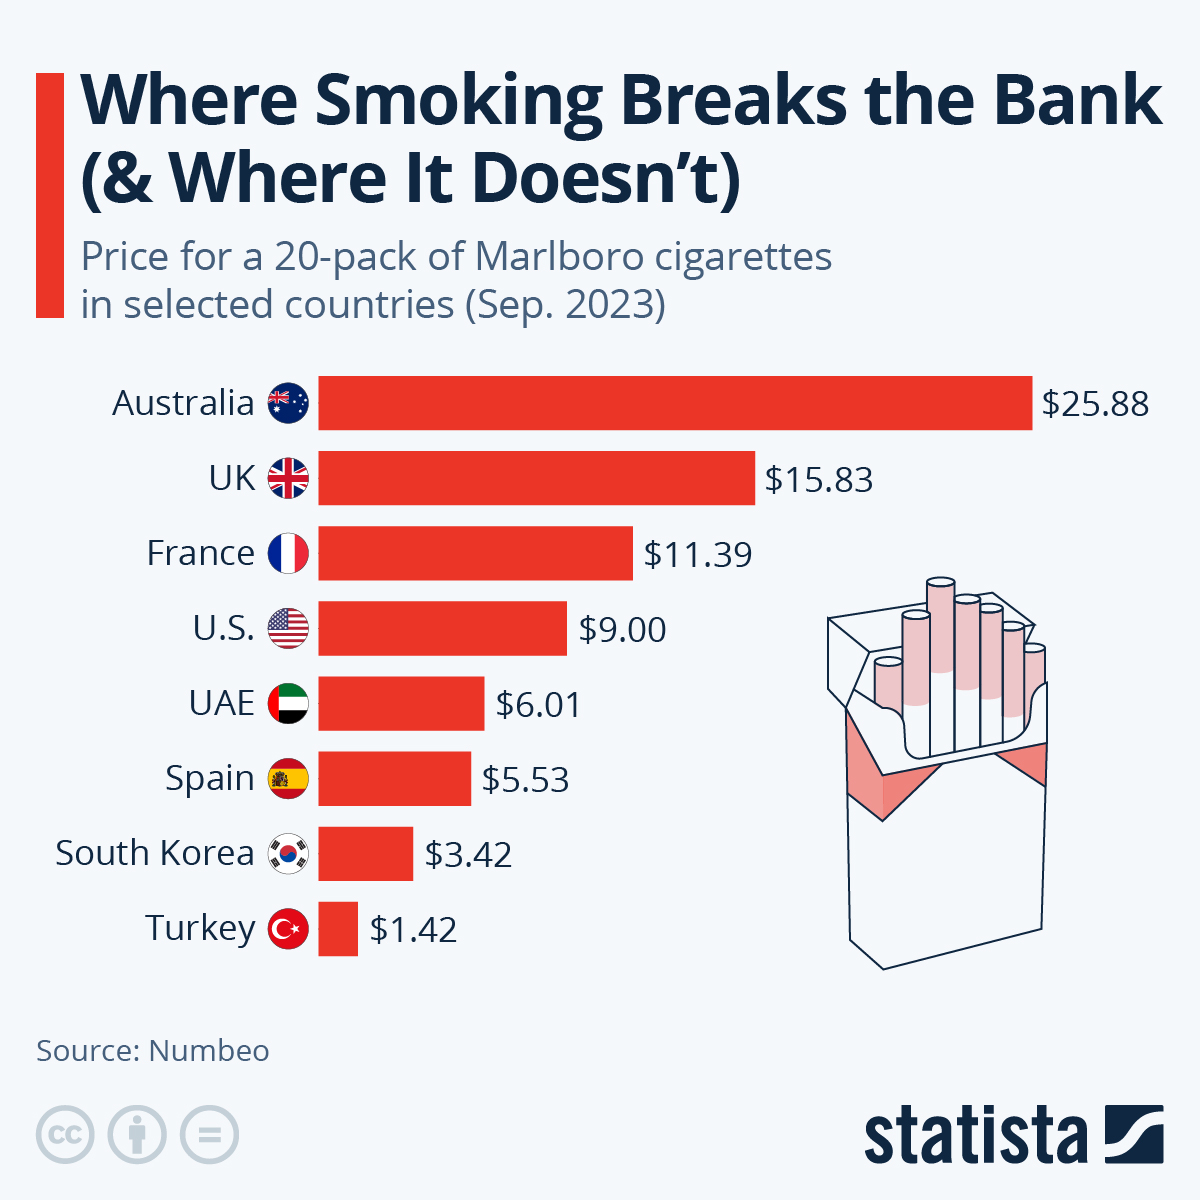
Australia is the world’s most expensive country in which to be a smoker, with one pack alone tearing a hole of almost US$26 in an Australian smoker’s wallet. Australia’s neighbor New Zealand is almost as pricey with a 20 pack of Marlboros costing upwards of US$22. The third most expensive country in the ranking was Ireland, where the identical pack costs the equivalent of more than US$16, according to Numbeo.

As Katharina Buchholz reports, the most expensive countries for smokers stayed the same since 2019, with the Norway and the UK rounding off the top 5.

Infographic: Where Smoking Breaks the Bank (& Where It Doesn't) | Statista

You will find more infographics at Statista

France – known to be a nation not opposed to smoking – has also upped its prices from $8.88 in 2019 to $11.70 in 2021 and is now contemplating raising prices again.

Cigarette prices in the U.S. have been rising more slowly – from $7.43 a pack in 2019 to $8.00 a pack in 2021 and $9.00 in 2023.

Australia’s, as well as New Zealand’s smokers, are probably jealously eyeing Turkish people’s smoking expenses.

There, they could get almost an entire pack of cancer sticks for the price of one, meaning that Australians pay about as much for a single smoke as people in Turkey do for a whole pack.

Tyler Durden
Sat, 09/02/2023 – 22:00

via ZeroHedge News https://ift.tt/muRvroU Tyler Durden

San Francisco Records More Than A Dozen Suspected Overdose Deaths In One Day

San Francisco Records More Than A Dozen Suspected Overdose Deaths In One Day

Authored by Travis Gillmore via The Epoch Times,

Videos from San Francisco posted on social media Aug. 30 show morgue vans loading bodies amid scenes of widespread addiction, with people folded up and contorted in unnatural positions in what many describe as dystopian settings on the streets of downtown.

Posts on X, formerly known as Twitter, repeatedly shared by locals indicated that as many as 18 overdose deaths took place in San Francisco throughout the day, but a spokesperson for the chief medical examiner’s office told The Epoch Times by email Aug. 31 that 13 deaths occurred and are currently under investigation.

“Today, the Office of the Chief Medical Examiner initiated examinations on 13 cases received within the past twenty-four hours,” the spokesperson wrote.

“The case and manner of death for these decedents remain under review.”

No toxicology results are yet available, and the examiner’s office had no further comment.

Approximately 2,500 people have died from overdose in San Francisco since 2020, according to medical examiner statistics (pdf) including the first seven months of 2023.

More than 81 percent of such cases revealed fentanyl during toxicology testing.

While deaths dipped slightly last year, numbers are now on the rise and on pace to set a record, as more than 500 have occurred in the city so far, with 71 accidental overdose deaths in July alone, according to the medical examiner’s data.

Overdose locations are spread throughout the city and concentrated in certain areas, based on medical examiner records.

Known for high crime and open-air drug markets, the Tenderloin accounts for approximately 18 percent of deaths, with the SOMA area, which is short for South of Market located blocks from Union Square, and Polk/Russian Hill—known for curvy, picturesque Lombard Street—each accounting for 20 percent.

Homeless people gather near drug dealers in the Tenderloin District of San Francisco on Feb. 22, 2023. (John Fredricks/The Epoch Times)

Fentanyl is responsible for the majority of deaths this year, according to testing results released by the medical examiner.

Odorless, tasteless, and highly toxic, the insidious nature by which fentanyl poisonings occur in unsuspecting victims is leading to rising numbers of overdose deaths, according to experts.

New synthetic analogs—drugs that are similar chemically but not identical to fentanyl— and other tranquilizers including Xylazine and Isotonitazine further complicate matters, as they are resistant to opioid reversal medications like naloxone, better known as Narcan. Xylazine is responsible for at least 16 deaths in San Francisco in 2023, according to the report, and isotonitazine is reportedly 20 times stronger than fentanyl, according to the Drug Enforcement Agency.

Victim advocates and family members of those lost to addiction wrote thousands of names in chalk on the sidewalk outside City Hall that night, as the deaths occurred one day before San Francisco Supervisor Dean Preston held a gathering to bring attention to International Overdose Awareness Day on Aug. 31.

“Overdoses are at crisis levels,” Mr. Preston wrote on X the same day.

“Today & every day, I’ll continue to work to ensure our city is using every evidence-based tool at our disposal—including overdose prevention, treatment on demand, recovery resources—to reduce overdoses [and] save lives.”

Supervisors have faced scrutiny on social media, as concerned residents express disappointment in the public safety issues plaguing the city, and many questioned Mr. Preston’s post with comments about perceived policy failures.

A drug user displays fentanyl in the Tenderloin District of San Francisco on Feb. 23, 2023. (John Fredricks/The Epoch Times)

At the drug awareness gathering, one advocate for harm reduction—which focuses on education and overdose prevention as opposed to prosecution—was pictured at the event waving a sign declaring “Downtown is for drug users,” and another wore a “police are terrorists” shirt.

Responsible for nearly 6,000 deaths a year in California, as of the latest statistics from the Department of Public Health covering 2021, fentanyl is drawing attention from lawmakers on both sides of the aisle.

Bipartisan bills seeking to increase penalties for fentanyl distribution were met with resistance in the Legislature, with members of public safety committees in both houses voicing preference for rehabilitation and overdose prevention.

Some lawmakers voiced reluctance to advance any proposals that include punitive measures, including incarceration, arguing that doing so would be extending the “failed War on Drugs.” Subsequently, eight of nine such bills were killed earlier this year.

California Gov. Gavin Newsom announced in May a joint operation between California Highway Patrol and the National Guard to disrupt fentanyl distribution in San Francisco.

Since then, hundreds of arrests have been made and enough fentanyl seized in two neighborhoods—56 kilograms—to kill nearly the state’s entire population, according to San Francisco Mayor London Breed’s office released Sept. 1.

Tyler Durden
Sat, 09/02/2023 – 21:30

via ZeroHedge News https://ift.tt/4Hg2m9a Tyler Durden

These Are The Highest-Earning Creators Of The Internet Content Machine

These Are The Highest-Earning Creators Of The Internet Content Machine

At the 2023 Streamy Awards which aired Sunday night on YouTube, content creator MrBeast aka Jimmy Donaldson won the main category Creator of the Year as well as the award for Best Collaboration (with Dwayne “The Rock” Johnson). The 25-year-old who grew up in North Carolina was the only winner taking home multiple awards, showing the resounding success he has had with his YouTube channel focused on over-the-top challenges (and the occasional grand gesture).

As Statista’s Katharina Buchholz reports, the latest release of Forbes’ list of the most successful internet creators lists Donaldson as the highest-earning of them all – at a yearly gross of $54 million. The MrBeast channel was also the second-most followed on YouTube as of August 2023 – up from rank 4 at the beginning of the year. In this time span, Donaldson has attracted attention for paying for operations making 1,000 blind people see and 1,000 deaf people hear.

Infographic: The Highest-Earning Creators of the Internet Content Machine | Statista

You will find more infographics at Statista

YouTubers generally ranked high among the best-paid content creators. One aspect of this is sponsored posts as well as ads earning more if they are in a video format. According to Forbes, Donaldson is in fact capitalizing on this aspect. However, many creators who have earned millions as social media personalities have done so by outside business deals. Third-ranked Jake Paul who started out as a comedy and music creator on Vine and later YouTube has pivoted to boxing and merchandise sales. Rhett McLaughlin and Link Neal of channel Rhett & Link have branched out from YouTube sketch comedy and other entertainment content to live appearances and merch sales. Mark Edward Fischbach, known as Markiplier on YouTube, initially uploaded gaming videos, but now also earns most of his cash with, again, merch sales as well as podcast and TV deals.

Elliot Tebele might have come the longest way from posting memes on Tumblr to running a media company that includes notable Instagram accounts like FuckJerry, TV productions, consulting and even board games. Jerry Media has worked or is working with notables like Michael Bloomberg (during his 2020 presidential run), Seth Phillips (“Dude With Sign”) and the Instagram egg. Tebele’s brand Jaja Tequila is also bringing in money.

The highest-earning female content creator (at least in 2021) was Danielle Bregoli aka Bhad Bhabie, making her millions on OnlyFans – a platform with a straightforward monetizing strategy. The 20-year-old actually started out as a meme herself, after a video clip and pictures of her 2016 appearance on TV show Dr. Phil went viral and made her the Cash-me-outside girl at just 13 years old. Bregoli built a sizable music career in the years that followed and has been cashing out on OnlyFans since turning 18 in March 2021. Alexandra Cooper of the Call Her Daddy podcast and TikTok’s biggest name Charli D’Amelio also make the top 10.

Tyler Durden
Sat, 09/02/2023 – 21:00

via ZeroHedge News https://ift.tt/4DbHwMm Tyler Durden

Iowa Governor Kim Reynolds Tries To Scrub Her Lockdown Record

Iowa Governor Kim Reynolds Tries To Scrub Her Lockdown Record

Authored by Kathleen Sheridan via The Brownstone Institute,

It seems that everyone is running from the lockdowns they once supported, and that includes former presidents and governors, and probably mayors too. Apologies would be better so we can at least have an honest accounting rather than an attempt to rewrite the history that everyone knows. 

Jack Phillips of Epoch Times alerts readers in his article of August 31, 2023, of Iowa Governor Kim Reynolds’ recent statement on the subject of lockdowns. The Iowa State Government’s website says the following:

“Since news broke of COVID-19 restrictions being reinstated at some colleges and businesses across the U.S., concerned Iowans have been calling my office asking whether the same could happen here. My answer—not on my watch. In Iowa, government respects the people it serves and fights to protect their rights. I rejected the mandates and lockdowns of 2020, and my position has not changed.” 

Governor Reynolds “rejected” the mandates and lockdowns of 2020?

She did?

Her position has remained the same? It has?

Could it be the Governor has forgotten her “orders?” On March 17, 2020, Governor Reynolds issued her first “Public Health Disaster Emergency.” Following her long list of “whereas’s,” she ordered the following:

  • Restaurants and bars: Closed to the “general public”

  • Fitness centers/health clubs, spas, aquatic centers: Closed

  • Theaters/performance centers: Closed

  • Casinos/gaming facilities: Closed

  • Churches: Closed

  • Social, community, spiritual, religious, recreational, leisure, and sporting gatherings and events of more than 10 people, including but not limited to parades, festivals, conventions, and fundraisers: Prohibited. 

  • Senior citizen and adult daycare centers: Closed

  • Salons/barber shops: Closed

A few weeks later on April 6, 2020, she doubled down. In this second proclamation, the Governor extended the timeline and expanded what she now says she “rejected.” To add insult, she also formally called on law enforcement to “assist in the enforcement of these ‘mitigation efforts’.”

To wit: 

“To encourage further social distancing and mitigation efforts, the proclamation orders additional closures effective at 8:00 a.m. on Tuesday, April 7th until Thursday, April 30th”: (Highlight and underline added)

  • Malls 

  • Tobacco or vaping stores

  • Toy, gaming, music, instrument, movie, or adult entertainment stores

  • Social and fraternal clubs, including those at golf courses

  • Bingo halls, bowling alleys, pool halls, arcades, and amusement parks

  • Museums, libraries, aquariums, and zoos

  • Race tracks and speedway.

  • Roller or ice skating rinks and skate parks

  • Outdoor or indoor playgrounds or children’s play centers

  • Campgrounds

Should we afford the Governor the benefit of the doubt? That she “rejected” “mandates and lockdowns” all the way through Mar 16, 2020? Then changed her mind? Hence, rejecting them before implementing them? 

Should we resist the impulse to accrue to the Governor a little bit of gaslighting in her August 30, 2023 statement? Will she insist that businesses she ordered closed and the behaviors she prohibited* – to be enforced by law enforcement – weren’t “mandated” “lockdowns?” That they were instead “mitigation efforts” as spelled out in her “orders?” That all this merely carried the weight of suggestion? This…so that she can now say that she “rejected” mandates and lockdowns? 

At best – at best – this PR stunt strains credulity. Especially when simple searches can recall those pesky things called facts. On the record.

At worst? At worst, why, some might suggest it describes a woman whose actual status rhymes with “fire.” 

Maybe the Governor needs a chance to explain herself, including her definition of “rejected.” I can just hear her now: “I did reject the lockdowns before I didn’t.” I daresay that would make for some really great reading. 

In the meantime, some of us who rejected all the unlawful nonsense, who were never fooled by any of these fools, who never cooperated and gave up all – remain unfooled – even when the likes of a Kim Reynolds attempts to rewrite history. 

I have attached both of Governor Reynolds’ “mitigation effort” orders.

Tyler Durden
Sat, 09/02/2023 – 20:30

via ZeroHedge News https://ift.tt/z583U0L Tyler Durden

Burger King Must Defend Misleading Whopper Lawsuit, Judge Rules

Burger King Must Defend Misleading Whopper Lawsuit, Judge Rules

Fast food chain Burger King finds itself in a flame-broiled fiasco.

A U.S. judge ruled this week that a lawsuit alleging the company cheated its customers by misrepresenting the size of its Whopper sandwiches, would not be dismissed, per the chain’s request. 

The ruling came from U.S. District Judge Roy Altman in Miami, Reuters reported this week. The lawsuit alleges that Whopper sandwiches on menu boards in stores mislead customers, creating a breach of contract. The suit is also pursuing negligence-based and unjust enrichment claims, Reuters reports. 

The class action lawsuit alleges that the burgers appear 35% larger on menu boards, with ingredients that “overflow over the bun”. The suit also alleges that the burgers on the menu boards have “more than double” the meat that the chain actually serves. 

In its response the fast food chain argued that it didn’t need to serve up food that looked “exactly like the picture”. Altman, however, ultimately decided that it would be up to a jury to “tell us what reasonable people think.”

In a statement, Burger King said: “The plaintiffs’ claims are false. The flame-grilled beef patties portrayed in our advertising are the same patties used in the millions of Whopper sandwiches we serve to guests nationwide.”

For those looking to follow along with the action at home, the docket is “Coleman et al v Burger King Corp, U.S. District Court, Southern District of Florida, No. 22-20925”.

In Brooklyn, New York federal court, both McDonald’s and Wendy’s face similar suits, Reuters noted. 

Tyler Durden
Sat, 09/02/2023 – 20:00

via ZeroHedge News https://ift.tt/NHGOJQS Tyler Durden

There Is No Fed Magic Trick To Achieve A Soft Landing

There Is No Fed Magic Trick To Achieve A Soft Landing

Authored by Mihai Macovei via The Mises Institute,

Economic growth in the United States accelerated to a 2.4 percent annualized rate in the second quarter of 2023, picking up from 2.0 percent in the first quarter, and climbing well above the 1.8 percent rate predicted by economists. Many analysts are surprised that the US economy has continued to expand at a robust pace despite the Federal Reserve’s (Fed) aggressive tightening on monetary policy.

The Fed raised interest rates by more than 500 basis points (bps) since March 2022. And yet, the labor market remains tight with a very low unemployment rate at 3.6 percent while the Standard and Poor 500 stock index is up almost 20.0 percent since the beginning of the year. Economists are optimistic that the Fed could deliver a soft landing by reducing inflation close to the 2.0 percent target while avoiding a recession. But will the Fed’s magic really work?

Insufficient Monetary Tightening

Since the financial crisis of 2008, the Fed had followed an “easy money” policy, but during the pandemic, the Fed leaned even further into this stance. As Consumer Price Index (CPI) inflation accelerated toward 5.0 percent, Fed Chair Jerome Powell belatedly admitted that inflation wasn’t transitory and shifted course. In March 2022, the Fed started raising interest rates but could not prevent inflation from surging to a peak of 9.1 percent in June 2022.

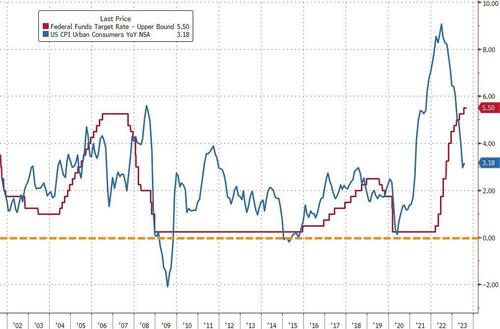
In 2022, it became apparent that the Fed’s tightening on monetary policy was not hawkish enough and that it was more concerned with avoiding a recession and instability of the financial sector. The interest rate hikes were piecemeal, and largely insufficient, as the real interest rate (the difference between the federal funds rate and the inflation rate) remained negative until April 2023 (figure 1).

The current positive real interest rate of about 2.0 percent is still rather low by historical standards and likely continues to artificially stimulate growth. Headline CPI inflation, helped by declining energy prices, may have decelerated to 3.1 percent in June but remains above the Fed’s 2.0 percent target. Moreover, core inflation—which excludes volatile food and energy prices—was at a sticky 4.8 percent in June as wage increases sustained strong consumer spending and second-round inflationary effects.

Figure 1: Federal funds rate and CPI

Source: Data from the Board of Governors of the Federal Reserve System and the Bureau of Labor Statistics.

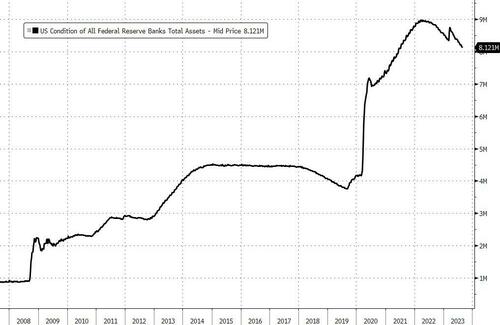
Most important, the Fed cannot rely only on interest rate hikes to tighten monetary policy. It needs to also shrink its balance sheet via quantitative tightening (QT) to reverse its previous quantitative easing, a policy of massive purchases of Treasury and mortgage-backed securities to boost commercial banks’ reserves and liquidity while lowering longer-term interest rates. Quantitative easing made the Fed’s balance sheet explode to a whopping $9 trillion, as of May 2022 (figure 2), and analysts agree that by reducing bank reserves, QT should exert upward pressure on interest rates while curtailing lending.

Figure 2: Total Fed assets (millions)

Source: Data from the Board of Governors of the Federal Reserve System.

In June 2022, the Fed started implementing its QT policy by shedding its holdings of US Treasuries and mortgaged-backed securities at a rate of $95 billion per month. But this process was undermined by the need to provide liquidity to the banking sector after banks, such as the Silicon Valley Bank, experienced hefty deposit runs. As a result, the Fed’s balance sheet declined by around $600 billion (or about 8.0 percent) from its peak to about $8.3 trillion by the end of July 2023, although the volume of held securities outright dropped by about $900 billion over the same period.

Still Abundant Bank Reserves

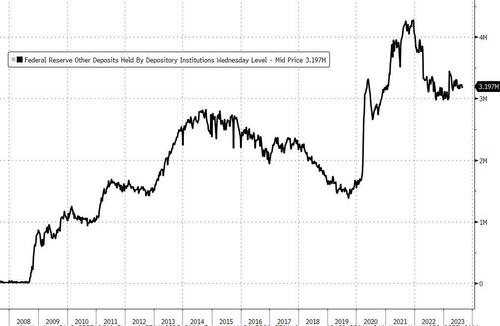
Some analysts claim that the Fed can use QT while also providing additional liquidity to select banks in distress (i.e., have its cake and eat it too). This is obviously not true. The main purpose of QT is to withdraw bank reserves via asset sales to reduce the banks’ lending capacity. But what we see is that bank reserves remained at historically high levels (figure 3) despite the Fed’s attempts at monetary tightening. Since the Fed’s Board of Governors reduced reserve requirement ratios on net transaction accounts to 0.0 percent as of March 2020, these reserves are de facto excess reserves on top of which banks can multiply credit. This means that banks still have ample room to lend even if the Fed has hiked the federal funds rate, which may also explain the uneven rise of loan interest rates and resilience of credit activity.

Figure 3: Total bank reserves

Source: Data from the Board of Governors of the Federal Reserve System.

Impact on Interest Rates and Credit

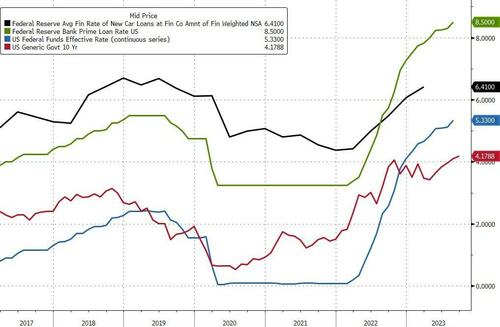
Market interest rates went up since the Fed started its monetary tightening (but not proportionally), reflecting lending maturities and other credit market specificities. The Fed hiked the federal funds rate by 525 bps between March 2022 and July 2023. The bank prime loan rate, which is one of several base rates used by banks to price short-term business loans, mirrored the increase in the Fed’s key rate almost one to one (figure 4).

On the other hand, although longer-term ten-year US Treasury yields rose above 4.0 percent, they went up by less than 200 bps over the same period. The same goes for other bank loan interest rates such as five-year car loans (which went up on average by 330 bps until May 2023), two-year personal loans (which increased by 210 bps), and fifteen- and thirty-year fixed mortgage rates (which rose by close to 300 bps).

Figure 4: Market interest rates

Source: Data on the bank prime loan rate, the federal funds rate, the ten-year Treasury yield, and the finance rate on new auto loans from the Board of Governors of the Federal Reserve System.

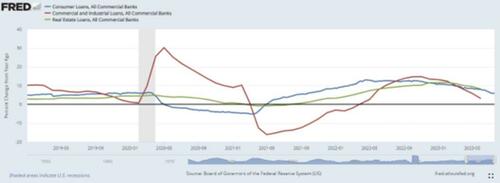
This shows that a majority of large and well-capitalized US banks increased loan interest rates much less than the Fed while also paying close to zero interest rates on bank deposits. They can afford it because they have plenty of reserves and liquidity, which the Fed did not mop up, and they continue to lend to the economy. Although the annual growth in total bank credit decelerated from close to 7.0 percent in 2022 to −0.9 percent in the second quarter of 2023, it was primarily driven by the decline in credit to the government, or investment in Treasury securities. At the same time, consumer and real estate loans grew annually by more than 6.0 percent and 5.0 percent respectively in the second quarter of 2023, while commercial and industrial loans recorded a small dip and remained flat in the first half of 2023 (figure 5). As lending to the private sector remained positive, it is unsurprising that economic output also continued to expand.

Figure 5: Private sector credit

Source: Data on consumer loansreal estate loans, and commercial and industrial loans from the Board of Governors of the Federal Reserve System.

Conclusion

The Fed’s magic trick to achieve a soft landing while aggressively tackling inflation is only smoke and mirrors. The Fed’s piecemeal interest rate hikes were not only insufficient to slow the economy down, but they also received very little support from quantitative tightening (i.e., the withdrawal of the liquidity that was previously injected into the system). Left with plenty of reserves, banks helped the economy to grow by continuing to lend while also refraining from increasing lending rates as much as the Fed. As a result, taming inflation is not yet a done deal, as core inflation remains sticky and well above the Fed’s target.

The money supply shrinkage signals economic trouble ahead when the monetary overhang is likely to be worked out in earnest. The Fed’s dovishness has just pushed forward a day of reckoning. Moreover, a steady deterioration of fiscal deficits alongside Gargantuan public projects to boost domestic demand and spur high-tech green infrastructure investment magnify recession risks as the Fed may be forced to further tighten to reduce inflation pressures. Fitch’s recent downgrade of the US’s long-term credit rating over rising public debt and deterioration of governance is just another confirmation that macroeconomic policies have been unsound for too long.

Tyler Durden
Sat, 09/02/2023 – 19:30

via ZeroHedge News https://ift.tt/gGiKZ5B Tyler Durden

Civil Unrest Fears Grow As Youth Unemployment Accelerates

Civil Unrest Fears Grow As Youth Unemployment Accelerates

In nearly every country in the world, youth unemployment is much higher than general unemployment.

Unfortunately, the pandemic only exacerbated matters. During a crucial stretch of their early careers, young adults were locked out of entry-level jobs, destroying their ability to pick up work experience and potentially impacting their long-term earnings.

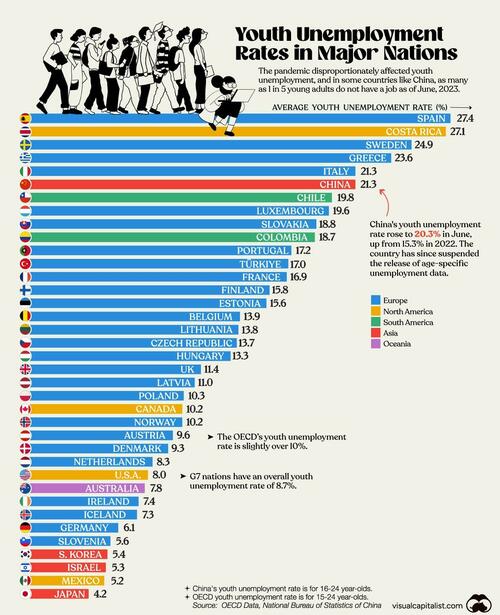
Now, nearly three years after COVID-19 first hit, young adults from some countries, like China, are struggling to find jobs. Using data from the OECD and the National Bureau of Statistics of China, Visual Capitalist’s Pallavi Rao and Niccolo Conte chart out the youth unemployment rate for 37 countries.

Ranked: Countries With the Highest Youth Unemployment

At the top of the list, Spain has the highest youth unemployment in the OECD, with nearly one in three young adults unable to find a job.

ℹ️ Unemployed people are those who report that they are without work, are available for work, and have taken active steps to find work in the last four weeks. The youth unemployment rate is calculated as a percentage of the youth labor force.

A mismatch between educational qualifications and the labor market has been cited as a significant reason for Spain’s lack of employed adults between the ages of 15–24.

Meanwhile, the country’s reliance on temporary contracts and dependence on seasonal sectors—like tourism—to generate jobs are some of the many reasons for its persistently high reported unemployment across demographic groups.

Listed below is the youth unemployment rate for all the OECD countries, and China, as of the second quarter of 2023.

Rank Country Average Youth
Unemployment Rate
1 🇪🇸 Spain 27.4%
2 🇨🇷 Costa Rica 27.1%
3 🇸🇪 Sweden 24.9%
4 🇬🇷 Greece 23.6%
5 🇨🇳 China 21.3%
6 🇮🇹 Italy 21.3%
7 🇨🇱 Chile 19.8%
8 🇱🇺 Luxembourg 19.6%
9 🇸🇰 Slovakia 18.8%
10 🇨🇴 Colombia 18.7%
11 🇵🇹 Portugal 17.2%
12 🇹🇷 Türkiye 17.0%
13 🇫🇷 France 16.9%
14 🇫🇮 Finland 15.8%
15 🇪🇪 Estonia 15.6%
16 🇧🇪 Belgium 13.9%
17 🇱🇹 Lithuania 13.8%
18 🇨🇿 Czech Republic 13.7%
19 🇭🇺 Hungary 13.3%
20 🇬🇧 United Kingdom 11.4%
21 🇱🇻 Latvia 11.0%
22 🇵🇱 Poland 10.3%
23 🇳🇴 Norway 10.2%
24 🇨🇦 Canada 10.2%
25 🇦🇹 Austria 9.6%
26 🇩🇰 Denmark 9.3%
27 🇳🇱 Netherlands 8.3%
28 🇺🇸 United States 8.0%
29 🇦🇺 Australia 7.8%
30 🇮🇪 Ireland 7.4%
31 🇮🇸 Iceland 7.3%
32 🇩🇪 Germany 6.1%
33 🇸🇮 Slovenia 5.6%
34 🇰🇷 Korea 5.4%
35 🇮🇱 Israel 5.3%
36 🇲🇽 Mexico 5.2%
37 🇯🇵 Japan 4.2%

Announced in June, China’s youth unemployment rate has climbed to 21.3%, a meteoric rise since May 2018, when it was below 10%. The Chinese economy is in the midst of a slowdown and its steadily climbing youth unemployment prompted the government to suspend age-specific unemployment data for the near future.

On the other side of the spectrum, in Japan, only 4.2% of young adults are without a job. A key reason for this is Japan’s shrinking and aging population that’s made for a tight labor market.

Youth Unemployment: Men vs Women

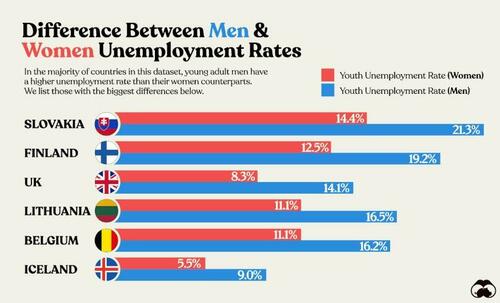
In most OECD countries, it’s common to see young men experiencing a higher unemployment rate compared to young women.

This contrasts with the trend across all age groups in the OECD, where the unemployment rate is 6.3% for women and 6% for men.

We visualize the countries in the dataset with the biggest gaps in youth unemployment below.

There is no singular reason that explains this common gap.

Across the OECD, more young women opt for tertiary education than young men, which may lead to better employment prospects. At the same time women are overrepresented in the health and social welfare sectors—both growing rapidly thanks to an aging population—that may make it easier for them to find jobs.

Why Does Tracking Youth Unemployment Matter?

Aside from being an indicator of general opportunities within a country, youth unemployment is a key metric to track, because it can be a bellwether for future economic prospects.

High rates of youth unemployment also correlate to brain drain within a country, as young adults move elsewhere to find better jobs.

Finally, large increases in unemployed youth have historically led to the potential of civil unrest, which makes it a politically-charged metric to identify and monitor for governments.

Tyler Durden
Sat, 09/02/2023 – 19:00

via ZeroHedge News https://ift.tt/xVFlRTu Tyler Durden

A World Running On Empty: The Decline Of Fossil Fuel Supply

A World Running On Empty: The Decline Of Fossil Fuel Supply

Authored by Gail Tverberg via Our Finite World blog,

  • Analysis of 2023 Statistical Review of World Energy data shows constrained global supplies of fossil fuels like oil, coal, and natural gas, particularly in inter-regional trading.

  • Constraints in supply are affecting energy prices, making them highly variable and less affordable for consumers, thereby affecting the global economy, including industries like manufacturing.

  • The cost-intensive infrastructure needed for long-distance natural gas exports is becoming increasingly unsustainable, posing risks to both investors and consumers.

For many years, there has been a theory that imports of oil would become a problem before there was an overall shortage of fossil fuels. In fact, when I look at the data, it seems to be clear that oil imports are already constrained.
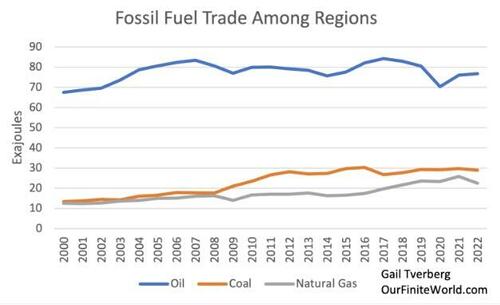
Figure 1. Interregional trade of fossil fuels based on data of the 2023 Statistical Review of World Energy by the Energy Institute.

As I look at the data, it appears to me that coal and natural gas imports are becoming constrained, as well. There was evidence of this constrained supply in the spiking prices for these fuels in Europe in late 2021 and early 2022, starting well before the Ukraine conflict began.

Oil, coal, and natural gas are different enough from each other that we should expect somewhat different patterns. Oil is inexpensive to transport. It is especially important for the production of food and for transportation. Prices tend to be worldwide prices.

Coal and natural gas are both more expensive to transport than oil. They tend to be used in industry, in the heating and cooling of buildings, and in electricity production. Their prices tend to be local prices, rather than the worldwide price we expect for oil. Prices for importers of these fuels can jump very high if there are shortages.

In this post, I first look at the trends in the overall supply of these fuels, since a big part of the import problem is fossil fuel supply not growing quickly enough to keep pace with world population growth. I also give more background how the three fossil fuels differ.

After this introductory material, I provide charts and some analysis of fossil fuel imports and exports by region, based on data from the 2023 Statistical Review of World Energy. Theoretically, the total of regional imports should be very close to the total of regional exports. This analysis gives a little more insight into what is going wrong and where.

[1] On a worldwide basis, total supplies of both oil and coal seem to be constrained.
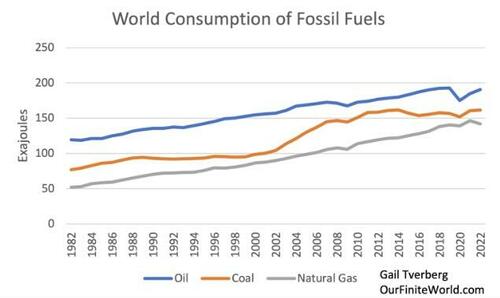
Figure 2. World consumption of oil, coal, and natural gas based on data of the 2023 Statistical Review of World Energy by the Energy Institute.

Figure 2 shows that world supplies of all three fossil fuels follow the same general pattern: They tend to rise in close to parallel lines, with oil supply on top, coal next, and natural gas providing the least supply.

The total supply of fossil fuels needs to be shared by the world’s population. It therefore makes sense to look at supply on a per capita basis.
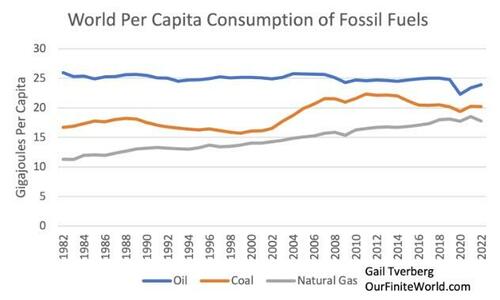
Figure 3. World per capita consumption of oil, coal, and natural gas, based on data of the 2023 Statistical Review of World Energy by the Energy Institute.

On Figure 3, the top line, oil supply per capita, is almost perfectly level, suggesting that having a greater supply of oil enables having a larger world population. This relationship makes sense because oil is used to a significant extent in growing today’s food, and shipping it to market. Oil products also make herbicides, insecticides, and drugs for animals that enable the growing supply of food needed to feed today’s population. Oil products are also helpful in road making, and in providing lubrication for machinery of all kinds.

We might conclude that oil supply is essential to the growth of human population. It is only by way of a huge change in the economy, such as the one that took place in 2020, that there is a big dip in oil usage. Even now, some of the changes are “sticking.” Some people are continuing to work from home. Business travel is still low. People are still not buying fancy clothing as much as before 2020. All these things help reduce fossil fuel usage, particularly oil usage.

Figure 3 also shows that on a per capita basis, coal supply has fallen by 9% since its peak in 2011. This fact, plus the fact that coal prices have been spiking around the world in recent years, leads me to believe that coal supply is already constrained, even apart from the export issue.

[2] The share of oil traded interregionally is more than double the share of coal or natural gas traded interregionally.

The reason why oil is disproportionately high in Figure 1 compared to Figure 2 is because a little over 40% of oil is shipped between regions. In comparison, only about 18% of coal production is traded with other regions, and about 17% of natural gas production is shipped interregionally. Oil is much easier (and cheaper) to transport between regions than either coal or natural gas. Shipping costs tend to escalate rapidly, the farther either natural gas or coal is shipped.

Natural gas has a second problem over and above the high cost of shipping: It requires storage (which may be high cost) if it is not used immediately. Storage is needed for both natural gas and coal because both fuels are often used for heat in winter, either by direct burning or by creating electricity that can be used to heat buildings. Storage for coal is close to free because it can be stored in piles outside.

Besides heat in winter, coal is also used to provide electricity for air conditioning in summer, so its demand curve has peaks in both summer and winter. Natural gas is much more of a winter-heat fuel in the US, so it has a large peak corresponding to winter usage (Figure 4).
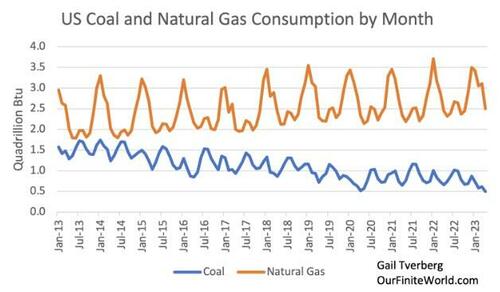
Figure 4. Coal and natural gas consumption by month based on data of the US Energy Information Administration.

Storage for natural gas needs to be available in every area where users expect to use it for winter heat. The cost of this storage will be low if there are depleted natural gas caverns that can be used for storage. It is likely to be high if above ground storage is required. Natural gas importing areas often do not have suitable caverns for storage. The easy approach is to try to get by with a bare minimum of storage, and hope that imports can somehow make up the difference.

The big question for any fuel is, “Can consumers afford to pay a high enough price to cover all the costs involved in getting the fuel from endpoint to endpoint, at the time it is needed?

Citizens become very unhappy if the cost of winter heat becomes extremely expensive. They demand subsidies and rebates from the government, in order to keep costs down. This is a sign that prices are too high for the consumer.

Both coal and natural gas are also heavily used in manufacturing. Their prices vary greatly from location to location and from time to time. If coal or natural gas prices rise in a particular location, the cost of manufactured goods from that location will also tend to rise. These higher prices will particularly hurt a manufacturing country, such as Germany, because its manufactured goods will become less competitive in the world marketplace. GDP growth will be reduced, and the profitably of manufacturers will tend to fall.

Because of these issues, long-distance trade in both coal and natural gas tend to hit barriers that may be difficult to see simply by looking at the trend in world production.

[3] Natural gas exports may already be becoming constrained, even though the total amount extracted still seems to be rising.

A huge amount of investment is needed to make long-distance sale of natural gas possible. Such investment includes:

  • The cost of developing a natural gas field for export use, usually over many years.

  • Pipelines covering every inch traveled by the natural gas, other than any portion of the trip for which transfer as liquefied natural gas (LNG) is planned.

  • Special ships to transport the LNG.

  • Facilities to chill natural gas, so it can be shipped overseas as LNG.

  • Regasification plants, to make the natural gas ready to ship by pipeline after it has been transferred as LNG.

  • Storage facilities, so that sufficient natural gas is available for winter.

Not all of these investments are made by the same organizations. They all need to provide an adequate return. Even if “only” very long-distance pipelines are used, the cost can be high.

Pipelines work best when there is no conflict among countries. They can be blown up by another country that seeks to raise natural gas prices, or that wants to retaliate for some perceived misdeed. For this reason, most growth in natural gas exports/imports in recent years has been as LNG.

Organizations investing in high-cost infrastructure for extracting and shipping natural gas would like long-term contracts at high prices in order to cover their costs. Without a stable long-term supply contract, natural gas purchase prices can be extremely variable. Japan has tended to buy LNG under such long-term contracts, but many other countries have taken a wait-and-see attitude toward prices, hoping that “spot” prices will be lower. They don’t want to lock themselves into a long-term high-priced contract.

There are two different things that tend to go wrong:

  • Spot prices bounce up above even what the long-term contract price would have been, creating a huge high-price problem for consumers.

  • Spot prices, on average, turn out to be too low for natural gas exporters. As a result, they cut back on investment, so that the amount of future exports can be expected to fall.

I believe that there is a significant chance that natural gas exports are now reaching a situation where prices cannot please all users simultaneously. Not all investors can get an adequate return on the huge investments that they have made in advance. Some investments that should have been made will be omitted. For example, there might be enough natural gas storage for a warm winter, but not for a very cold winter in Europe.

A prime characteristic of a fossil fuel (or any resource) that is not economic to extract is that the industry has difficulty paying its workers an adequate wage. Recently, there has been news about a union strike against Chevron at an Australian natural gas extraction site used to provide gas for liquefied natural gas (LNG) export. This suggests that natural gas may already be hitting long-distance export limits. Prices can’t stay high enough for producers to pay their workers an adequate wage.

[4] Oil imports by area suggest that the rapidly growing manufacturing parts of the world are squeezing out the imports desired by high-wage, service-oriented countries.

Because oil is so important in international trade, I looked at the amounts two ways. The first is based on trade flows, as reported by the Energy Institute:
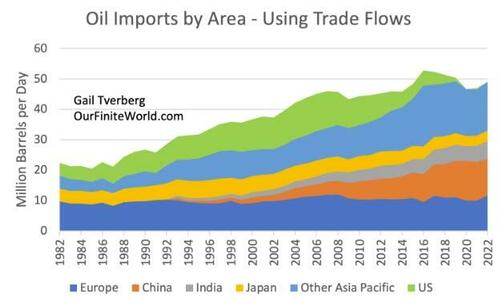
Figure 5. Oil imports by area based on the 2023 Statistical Review of World Energy by the Energy Institute.

The second is based upon a comparison of reported production and consumption for the same year, using the assumption that if consumption is higher than production, the difference must be attributable to imported oil. The problem with this later approach is that it can easily be distorted by changes in inventory levels. There may also be difficulties with my approach of netting out flows in two different directions, especially if the flows are partly of crude oil and partly of “oil products” of various types.
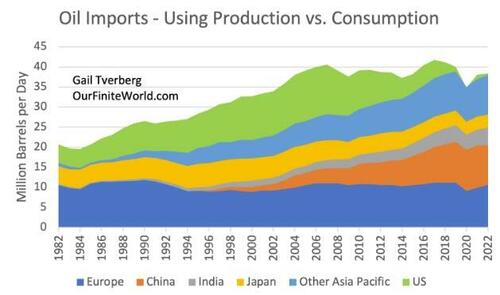
Figure 6. Oil imports based on production and consumption data of the 2023 Statistical Review of World Energy by the Energy Institute. Amounts adjusted to include “Refinery Gain,” as reported by the US Energy Information Administration.

In both charts, imports for China, India, and Other Asia Pacific are clearly much higher in recent years, while imports for the US, Japan, and Europe are down. The peak year for imports (in total) was about 2016 or 2017. Imports were about 3.5 million barrels a day lower in 2022, compared to peak, with both approaches.

[5] Oil imports by area indicate that nearly all oil exporters around the globe are having difficulty maintaining export levels.

Here, again I show two indications, using the same methods as for oil imports. Since trade is two sided, I would expect total import indications to more or less equal the total of all amounts exported.
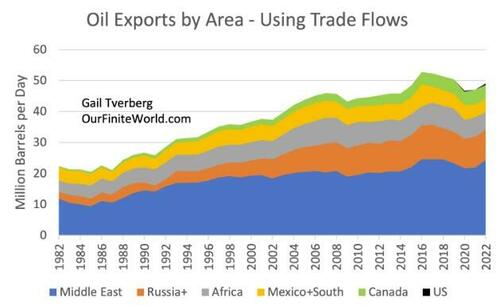
Figure 7. Oil exports by area using trade flows based on data of the 2023 Statistical Review of World Energy by the Energy Institute.

On Figure 7, peak oil exports (in total) occur in 2016, with the runner up year being 2017. US oil exports are shown to be nearly zero, even in recent years, because US imports and US oil exports more or less cancel out.
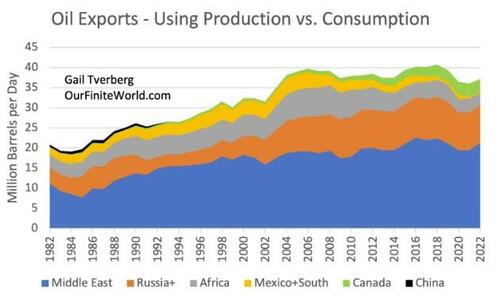
Figure 8. Oil exports based on production and consumption data of the 2023 Statistical Review of World Energy by the Energy Institute. Amounts adjusted to include “Refinery Gain,” as reported by the US Energy Information Administration.

The indications of Figure 8 show that apart from Canada, the amount of oil exported for all the other export groupings shown is lower in recent years than it was a few years ago. This is also evident in Figure 7, but not as clearly.

To some extent, the lower production in recent years is related to the cutbacks announced by OPEC+ (including what I call Russia+). While these cutbacks are “voluntary,” they reflect the fact that based on current oil prices, and based on investments made in recent years, these countries have made the decision to cut back production. No oil exporter would dare mention that it is running short of oil that can be extracted without considerably more investment.

On Figures 7 and 8, “Mexico+South” refers to all the oil being produced from Mexico southward. Besides Mexico, this includes Brazil, Venezuela, Argentina, Columbia, Ecuador, and a number of other small producers. Most of them are experiencing falling production. Brazil is doing a bit better, but it does not seem to be experiencing much growth in exports.

Africa’s peak year for oil exports seems to have been in 2007 (both approaches), with recent exports at a much lower level.

With respect to Russia+, its exports seem to be down from their peak in 2017 or 2018, but not any more than for oil producers from the Middle East. The European Union oil embargo doesn’t seem to have had much of an impact.

The star performer seems to be Canada, with its rising production and exports from the Canadian Oil Sands.

In this analysis, I have “netted out” imports and exports. On this basis, the US hasn’t moved into significant oil exporter status yet. I am sure that there are some people hoping that the oil production of the US will continue to increase, but whether this will happen is unclear. The growth of US oil production in recent years has helped offset (and thus hide from view) the falling exports of many countries around the world.

[6] Coal exports appear to have peaked about 2016. Europe has reduced its imports of coal, leaving more for other importers.
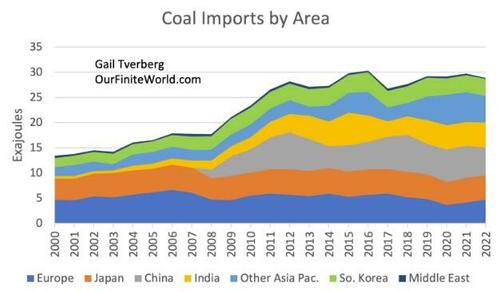
Figure 9. Coal imports by area using trade flows based on data of the 2023 Statistical Review of World Energy by the Energy Institute.

The peak in coal imports seems to have occurred about 2016. In particular, Europe’s imports of coal have fallen significantly since 2006. At the same time, coal imports have risen for many Asian countries, including China, India, South Korea, and Other Asia Pacific. Even Japan seems to have been able to obtain a fairly consistent level of coal imports for the 22-year period shown on Figure 9.
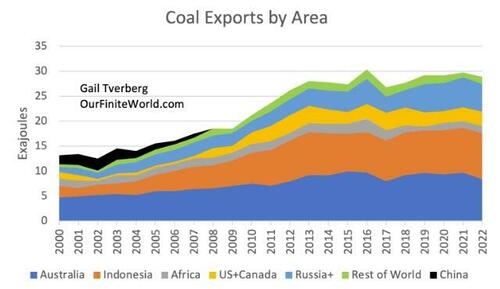
Figure 10. Coal exports by area based on trade flow data from the 2023 Statistical Review of World Energy by the Energy Institute.

One thing that is striking about coal exports is that they are disproportionately from countries in the Far East. Even the coal exports of the US and Canada are from North America’s West Coast, across the Pacific. Russia’s coal exports tend to be from Siberia.

The coal exports of South Africa have declined significantly since 2018, and other African countries are eager for their imports. Today’s largest source of coal exports is Indonesia. Coal exports from Russia+, at least until 2021, have been been a source of coal export growth.

A major share of the delivered price of coal is transportation cost, which tends to be fueled by oil, particularly diesel. Overland transit is particularly expensive. The real reason for Europe’s decline in coal imports since 2006 (shown in Figure 9) may be that there are practically no affordable coal exports available to it because it is too geographically remote from major exporters. Of course, this is not a story politicians care to tell voters. They prefer to spin the story as Europe’s choice, to prevent climate change.

[7] Natural gas imports and exports have only recently started to become constrained.
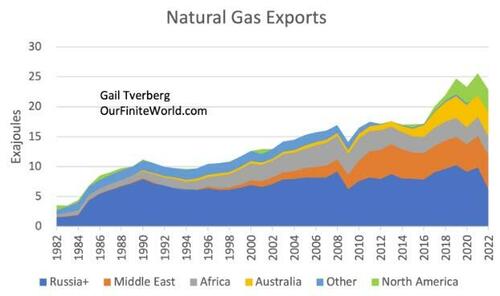
Figure 11. Natural gas exports by area based primarily upon production and consumption data from the 2023 Statistical Review of World Energy by the Energy Institute.

Figure 11 shows that natural gas exports from Russia+ (really Russia, with a little extra production from other countries in the Commonwealth of Independent States) have stayed fairly level, except for a big drop-off in 2009 (probably recession related) and in 2022.

The overall level of natural gas exports has been rising because of contributions from several parts of the world. Africa was an early producer of natural gas exports, but its exports have been dropping off somewhat recently as local gas consumption rises.

More importantly, exports have increased in recent years from the Middle East, Australia, and North America. With this growing supply of exports, it has been possible for importers to increase their imports.
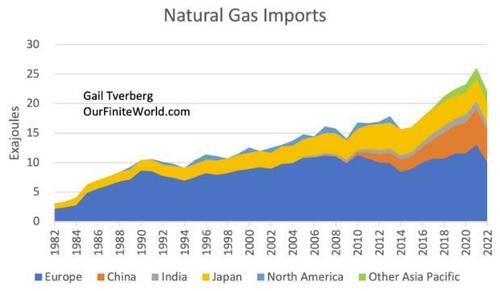
Figure 12. Natural gas imports by area based upon production and consumption data from the 2023 Statistical Review of World Energy by the Energy Institute.

Europe was able to maintain a fairly stable level of natural gas imports between 1990 and 2018, and even to increase them by 2021. China was able to ramp up its natural gas imports. Even Japan was able to ramp up its natural gas imports until about 2014. It has tapered them back since then. India and Other Asia Pacific both have been able to add a small layer of imports, too.

[8] What lies ahead?

The countries that have the greatest advantage in using fossil fuel imports are the countries that don’t heat or cool their homes, and that don’t have large numbers of private citizens with private passenger automobiles. Because of their sparing use of fossil fuel imports, their economies can afford to pay higher prices to import these fossil fuel imports than other countries. Thus, they are likely to be winners in the competition for fossil fuel imports.

Europe stands out to be an early loser of imports. It is already losing oil and coal imports, and it also seems to be an early loser of natural gas imports. However, for all its talk about preventing climate change, the reduction in European imports of fossil fuels hasn’t made much of a dent in global carbon dioxide emissions (Figure 13).
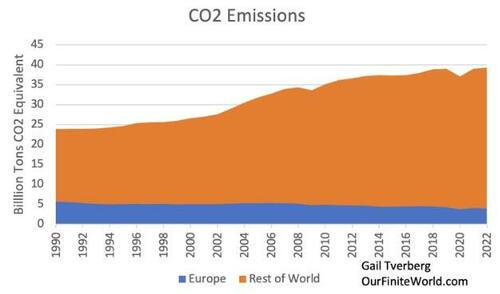
Figure 13. CO2 emissions for Europe and the Rest of the World, based on data of the 2023 Statistical Review of World Energy by the Energy Institute.

I am afraid that no country will really come out ahead. In some sense, the United States is better off than many countries because it is producing slightly more fossil fuels than it consumes. But it still depends on China and other countries for many imported goods, including computers. Given this situation, the United States likely cannot continue business as usual for very long, either.

Tyler Durden
Sat, 09/02/2023 – 18:30

via ZeroHedge News https://ift.tt/BYNpahk Tyler Durden