Bank of America Reports Solid Earnings But CRE Losses Unexpectedly Surge
With JPM, Citi and Wells already in the books, moments ago the last “big 4” money-center bank, Bank of America reported Q1 earnings which for the most part, were stronger than expected, however there were several troubling footnotes, including a sizable, $700MM FDIC special assessment and an unexpected surge in Commercial Real Estate net charge offs driven by the bank’s long overdue recognition of Office losses.
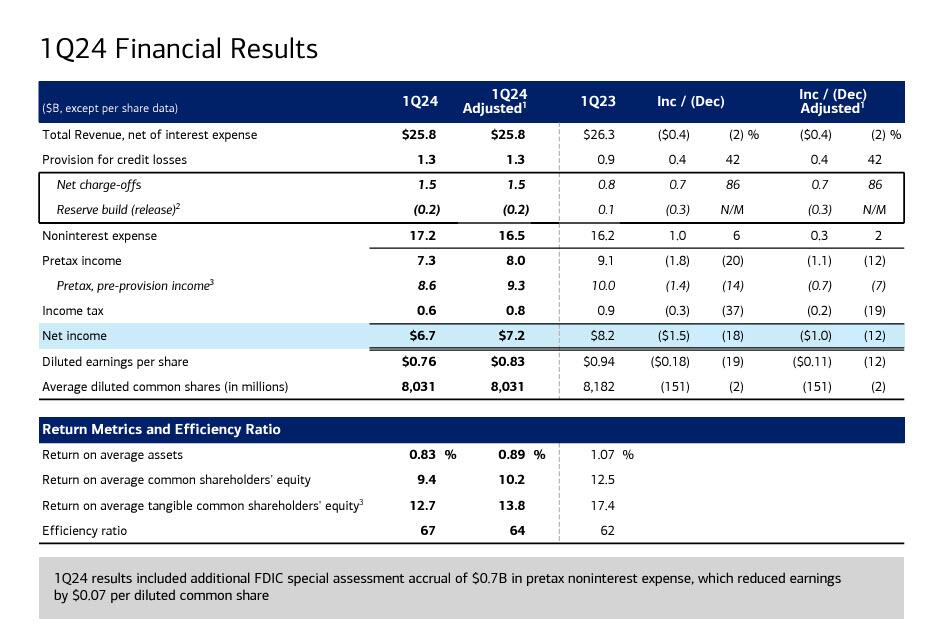
Starting at the top, here is what Bank of America reported for the first quarter:
- Total Revenue, net of interest expense, $25.82BN, down 2% from the $26.3BN reported a year ago, but also beating the $25.43BN estimate
- Trading revenue excluding DVA $5.18 billion, beating the estimate $5.02 billion
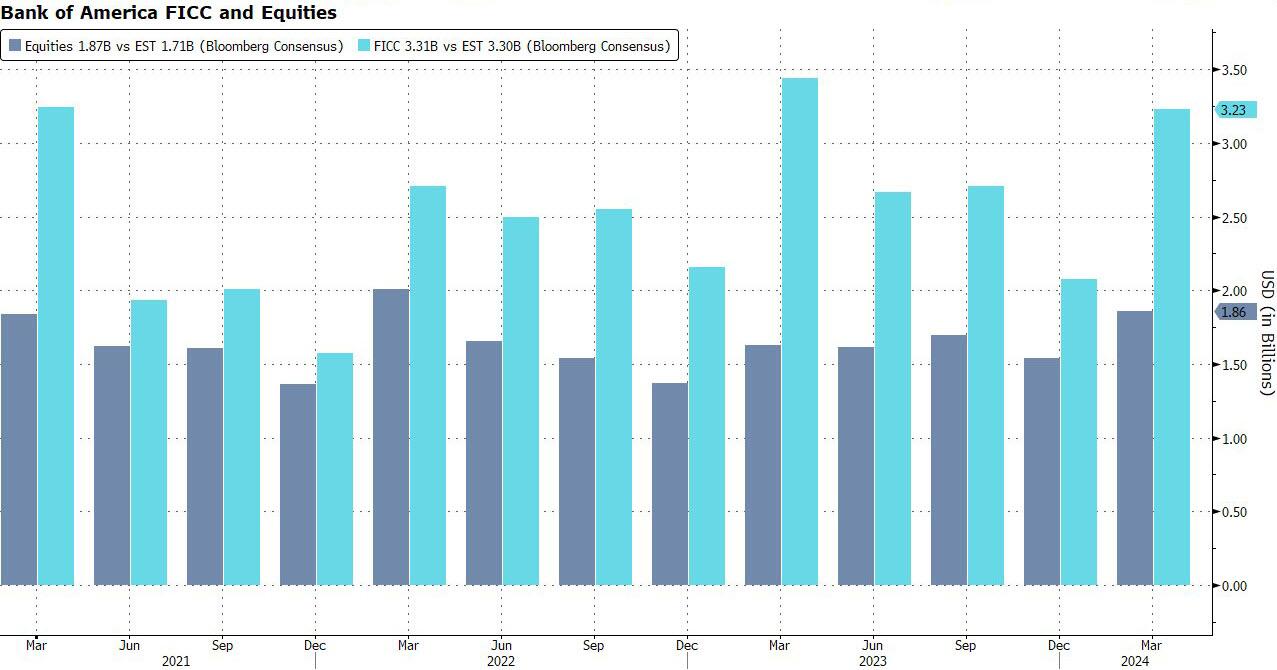
- FICC trading revenue excluding DVA $3.31 billion, beating the estimate $3.3 billion
- Equities trading revenue excluding DVA $1.87 billion, beating the estimate $1.71 billion
- Wealth & investment management total revenue $5.59 billion, beating the estimate $5.34 billion
- Trading revenue excluding DVA $5.18 billion, beating the estimate $5.02 billion
- Net income was $6.7 billion, down 12% from the $8.2 billion reported a year ago
- This translates to Adjusted EPS of 83c, a 12% drop from the 94c a year ago, but beating the 77c estimate;
- Worth noting here that BofA’s effective tax rate hit about 8%, which is ridiculously low, and was thanks to tax credits, “primarily related to investments in renewable energy and affordable housing.” Without those, the ETR would have been about 26%. (The FDIC special assessment “and other discrete tax items” brought the tax rate down by another 1%, the bank adds).
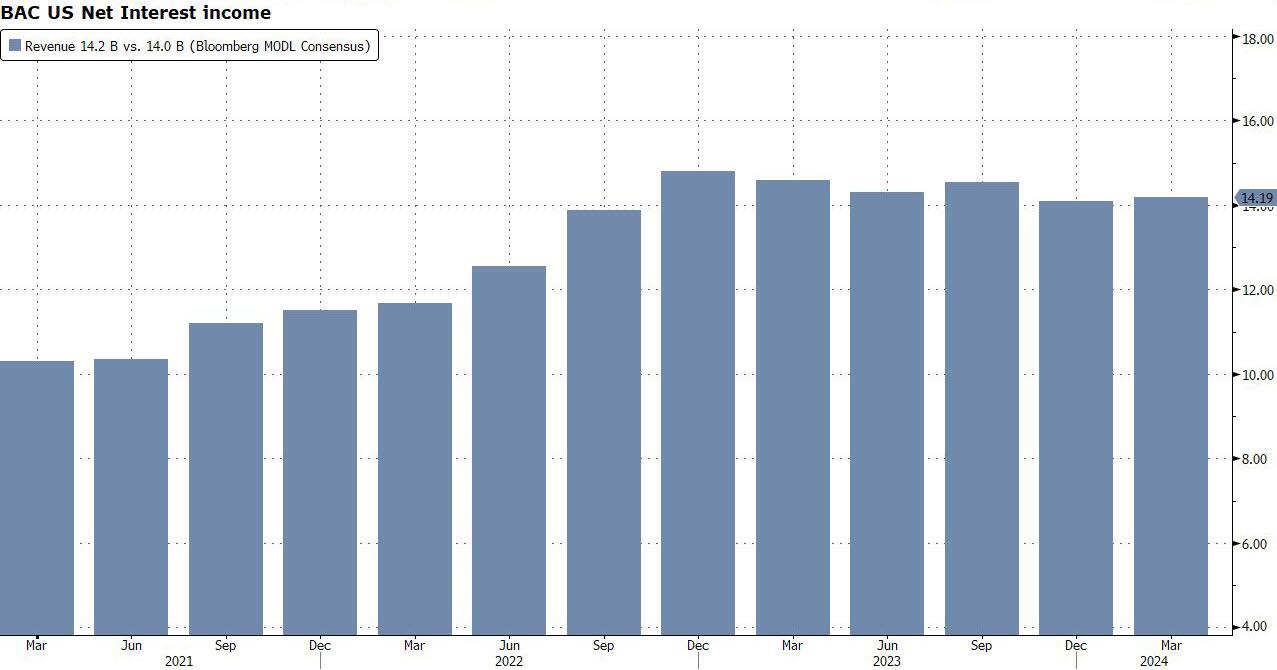
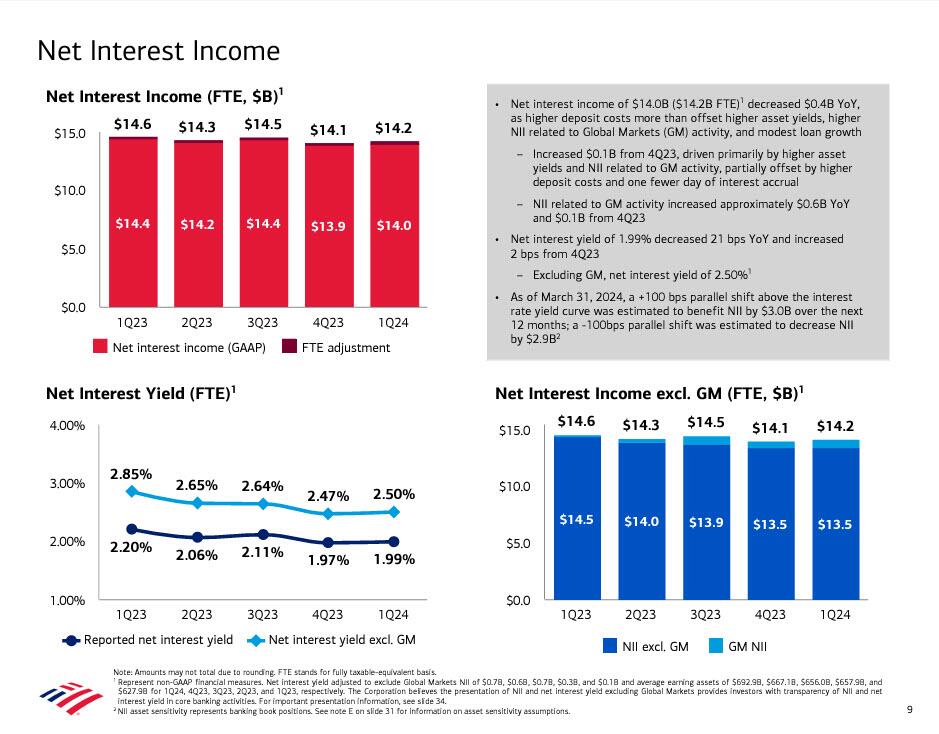
- Net interest income FTE rose to $14.19 billion, beating estimates $13.95 billion.
Also the bank said that results included a $700 million pretax “FDIC Special assessment” which reduced earnings by $0.07 per common share.
Digging a little deeper into the asset quality we find the first rotten apple: a spike in charge offs to $1.5 billion as a result of the usual suspects: credit card losses and commercial real estate office weakness. Meanwhile, nonperforming loans increased $398 million to $5.9 billion from the fourth quarter, driven also primarily by the office segment of commercial real estate. More details below:
- Provision for credit losses $1.32 billion, below the estimate $1.4 billion
- Net charge-offs (NCOs) of $1.5BN increased compared to 1Q23 and 4Q23, driven primarily by credit card and commercial real estate office
- Credit card loss rate of 3.62% in 1Q24 vs. 3.07% in 4Q23
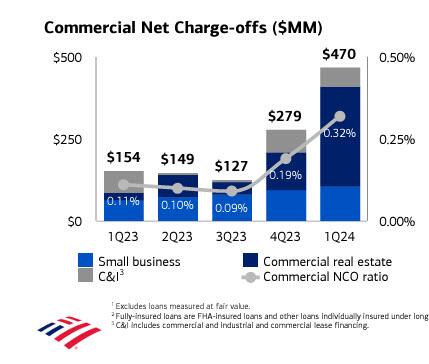
- Commercial net charge-offs of $470MM increased $191MM, driven by commercial real estate office
- Net charge-off ratio of 58 bps vs. 32 bps in 1Q23 and 45 bps in 4Q234
- Why were credit losses below the amount of charge-offs? Because like JPM, BofA reported a reserve release of $0.2B vs. net reserve build of $0.1B in 1Q23 and net reserve release of $0.1B in 4Q23
- Nonperforming loans (NPLs) of $5.9B increased $0.4B from 4Q23, driven primarily by commercial real estate office. The bank also said that 61% of Consumer NPLs are contractually current… which means that 39% of Consumer NPLs are not current.
- Commercial reservable criticized utilized exposure of $24.5B increased $1.2B from 4Q23
- Net charge-offs (NCOs) of $1.5BN increased compared to 1Q23 and 4Q23, driven primarily by credit card and commercial real estate office
Here it is visually:
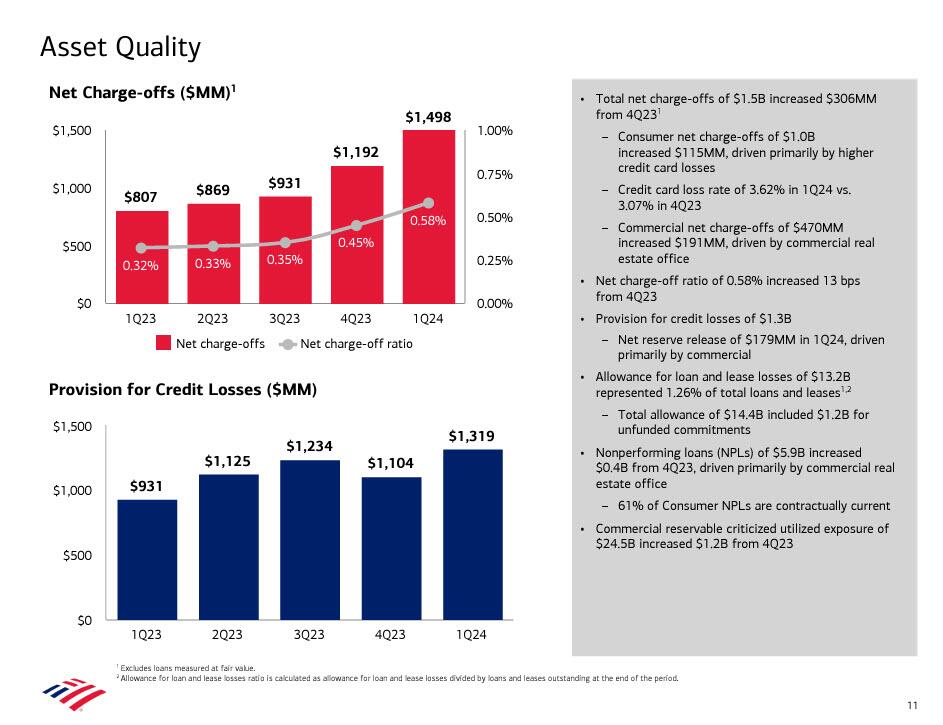
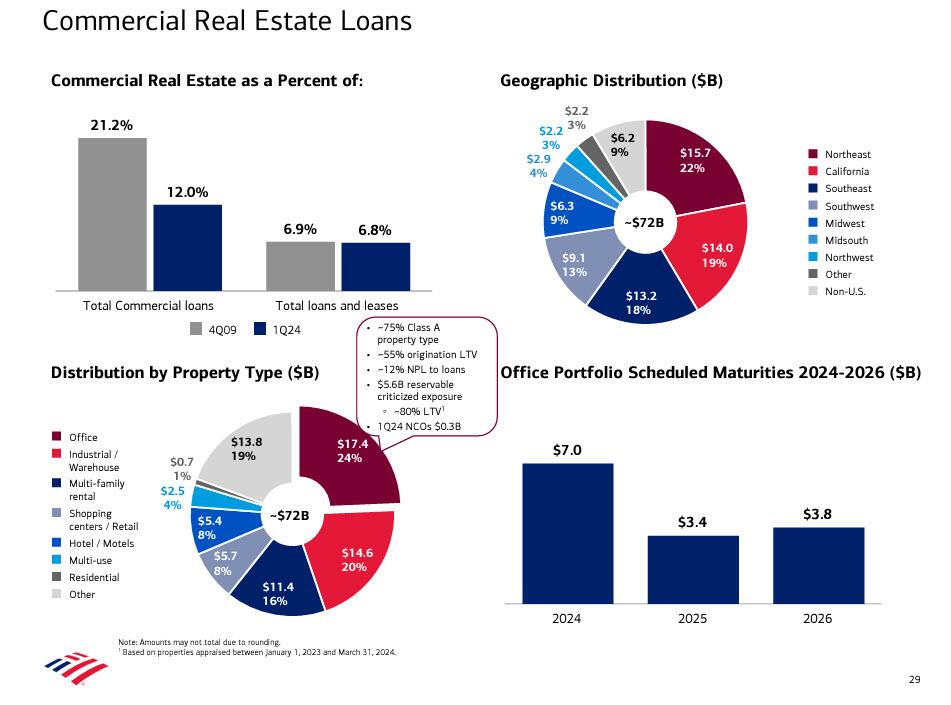
One can see the dramatic surge in commercial real estate charge offs in the next chart: it appears that banks are finally starting admit the CRE reality.
The bank was also kind enough to break down its Office exposure.
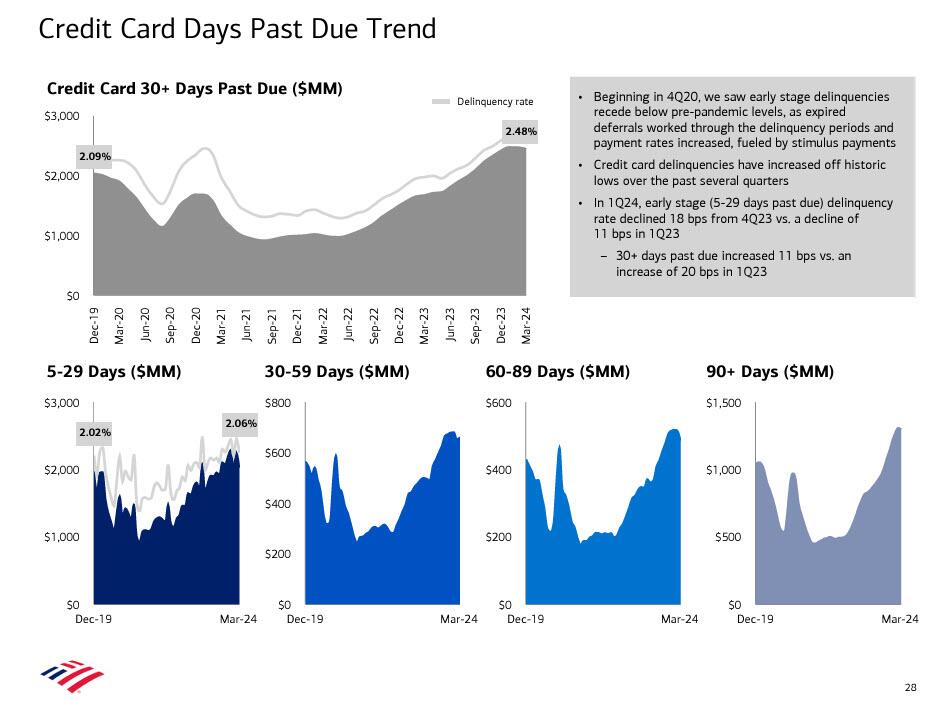
As for the weakness in consumer, the surge in credit card 30+ days past due is hardly inspiring confidence.
Before we dig deeper, here is a snapshot report of some other headline metrics:
- Return on average equity 9.35%, beating the estimate 9.31%
- Return on average assets 0.83%, matching the estimate 0.83%
- Return on average tangible common equity 12.7%, below the estimate 13.1%
- Basel III common equity Tier 1 ratio fully phased-in, advanced approach 13.4%, below the estimate 13.5%
- Standardized CET1 ratio 11.8%, matching the estimate 11.8%
- Non-interest expenses $17.24 billion, estimate $16.66 billion
- Compensation expenses $10.20 billion, above the estimate $9.99 billion
- Net charge-offs $1.50 billion, higher than the estimate $1.26 billion
Commenting on the quarter, CEO Brian Moynihan said in the earnings release that “we reported a strong quarter as our businesses performed well, adding clients and deepening relationships. We reached 36.9 million consumer checking accounts, with 21 consecutive quarters of net checking account growth. Our Wealth Management team generated record revenue, with record client balances, and investment banking rebounded. Bank of America’s sales and trading businesses continued their strong 2023 momentum this quarter, reporting the best first quarter in over a decade.”
Taking a closer look at the income statement, BofA reported net interest yield of 1.99%, up from a cycle low of 1.97% in Q4 and also beating the estimate 1.97%. That said, the NII yield was down 21bps YoY, and the actual NII print of $14.0, decreased notably $0.4B YoY, as higher deposit costs more than offset higher asset yields, higher NII related to Global Markets (GM) activity, and modest loan growth. Additionally, BofA noted that as of March 31, 2024, a +100 bps parallel shift above the interest rate yield curve was estimated to benefit NII by $3.0B over the next 12 months; a -100bps parallel shift was estimated to decrease NII by $2.9BN.
Turning to non-interest income, the bank’s trading unit was particularly strong in Q1 with Global Markets bringing in revenue of $5.88 billion — higher than the previous quarter and Q1 of last year. There was a similar pattern in BofA’s wealth management arm. The other two units — banking and its huge consumer arm — both brought in lower revenues than this time last year.
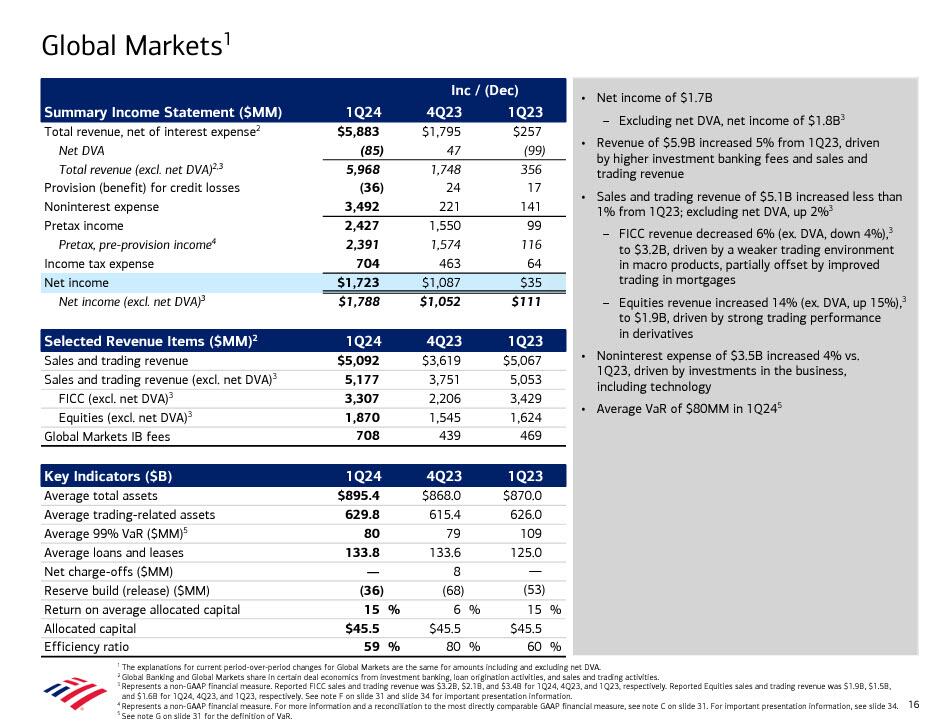
Looking at Global Markets, we find the following:
- Revenue of $5.9B increased 5% from 1Q23, driven by higher investment banking fees and sales and trading revenue
- Sales and trading revenue of $5.1B increased less than 1% from 1Q23; excluding net DVA, up 2%3
- FICC revenue decreased 6% (ex. DVA, down 4%),3 to $3.2B, driven by a weaker trading environment in macro products, partially offset by improved trading in mortgages
- Equities revenue increased 14% (ex. DVA, up 15%),3 to $1.9B, driven by strong trading performance in derivatives
- Noninterest expense of $3.5B increased 4% vs. 1Q23, driven by investments in the business, including technology
Of note here is that equities traders at Bank of America just posted one of their best quarters on record, with a $1.87 billion revenue which was ” driven by strong trading performance in derivatives”. That’s a solid up-arrow for them from $1.62 billion this time last year.
Markets in summary:
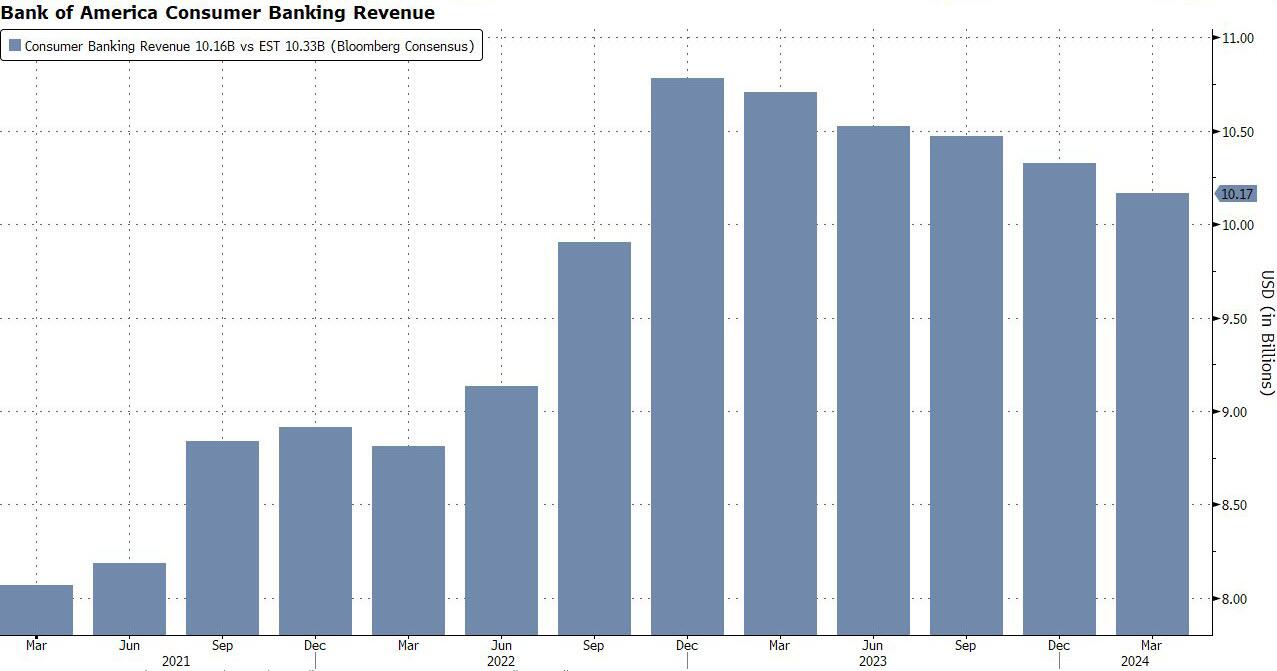
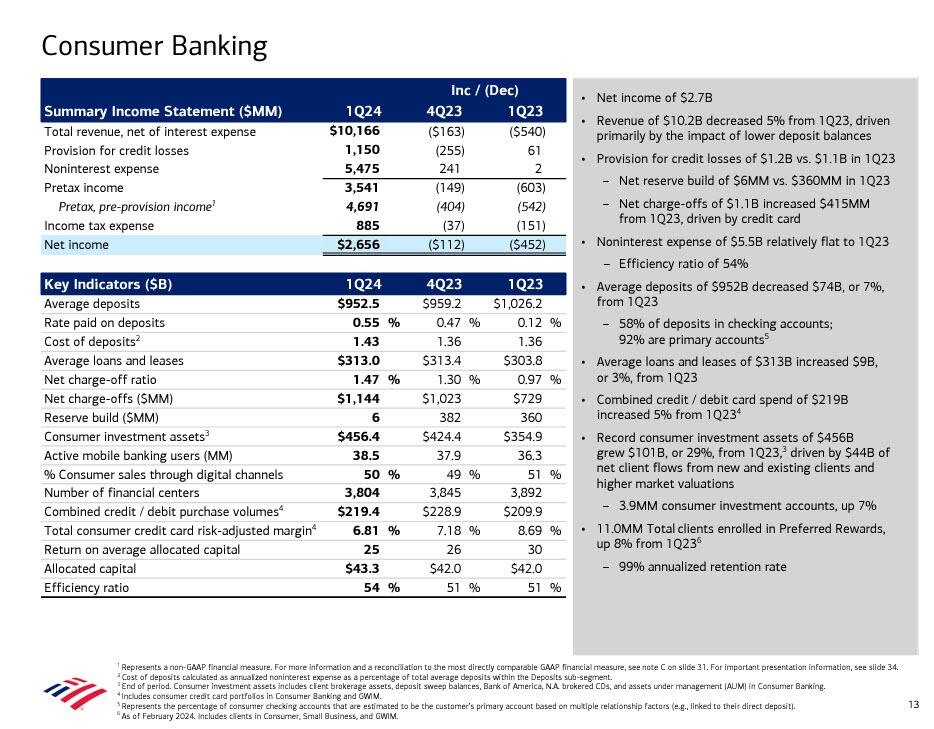
Next up is Bank of America’s mighty US consumer banking arm, which as BBG notes, vies for the top spot with JPMorgan Chase, accounts for about 40% of the company’s revenue. It’s a massive operation and really the bank’s bread and butter. Here, total revenue of $10.2 billion was a decrease on this time last year, and deposits are down again.
However, the bank highlights a rise in combined credit and debit card spending of 5%. That’s similar to what we’ve heard from other banks like Citigroup, where the card-bolstered personal banking unit helped propel it to a beat on Friday.
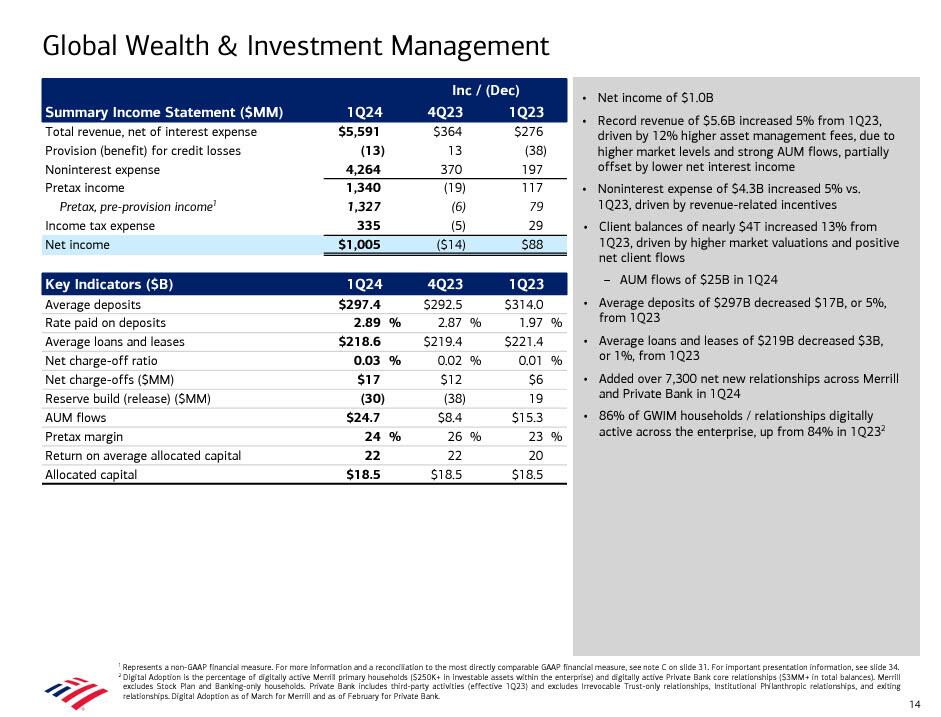
As for BofA’s Global Wealth and Investment management, it made $1 billion of net income from $5.6 billion of revenue; the bank cited another first for the unit: “Record client balances” hit almost $4 trillion, up 13% thanks to “higher market valuations and positive net client flows.” (AUM flows for the quarter hit $25 billion).
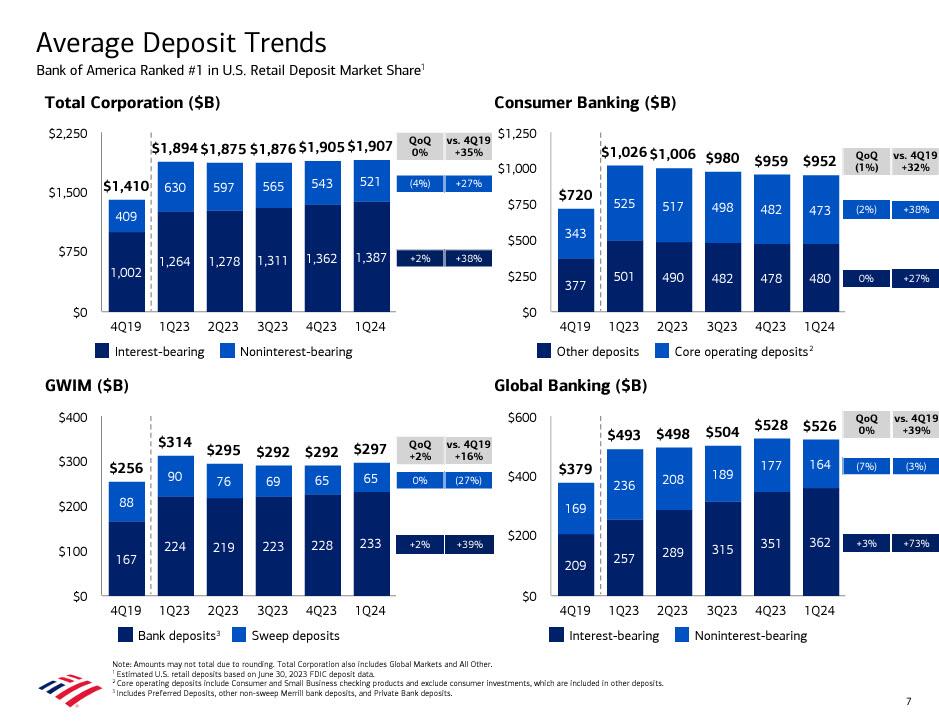
Turning to the balance sheet, total loans rose 1% YoY but dipped sequentially to $1.05 trillion, missing estimates of $1.06 trillion…
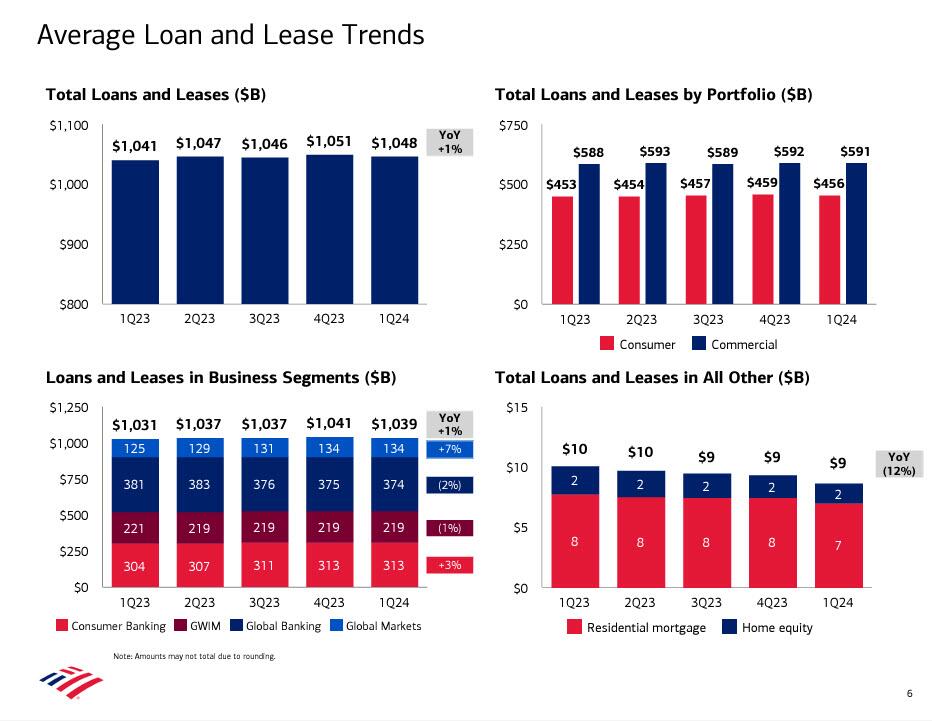
… while total deposits of $1.946 trillion, came just above the estimate of $1.93 trillion.
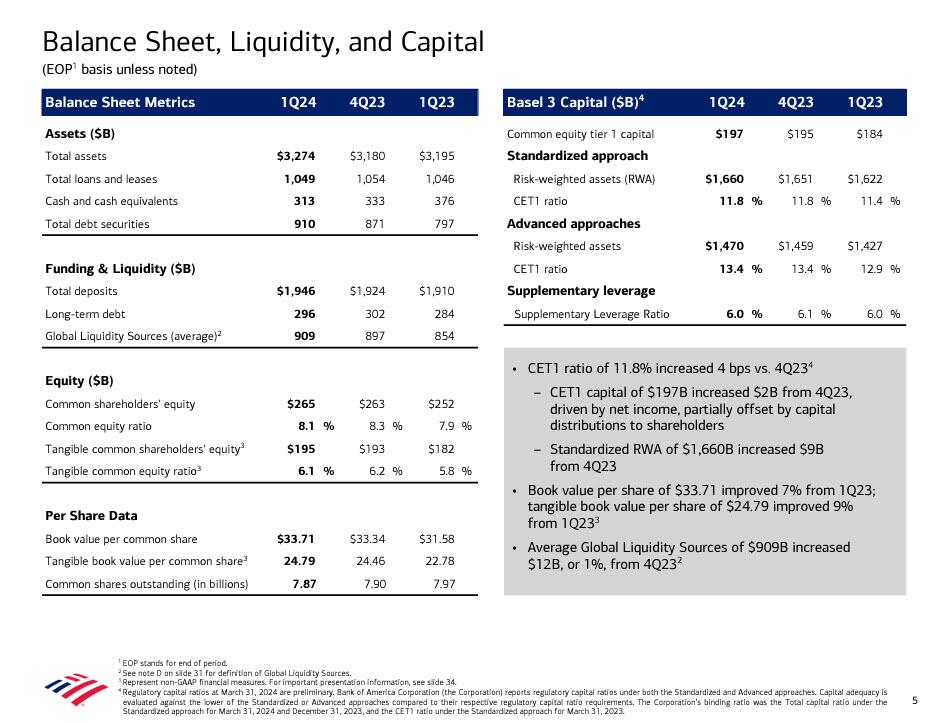
Some more details from the balance sheet:
- CET1 ratio of 11.8% increased 4 bps vs. 4Q234
- CET1 capital of $197B increased $2B from 4Q23, driven by net income, partially offset by capital distributions to shareholders
- Standardized RWA of $1,660B increased $9B from 4Q23
- Book value per share of $33.71 improved 7% from 1Q23; tangible book value per share of $24.79 improved 9% from 1Q233
- Average Global Liquidity Sources of $909B increased $12B, or 1%, from 4Q232
Bottom line: Bank of America managed to game expectations and reported numbers which mostly came just above estimates, which is also why the stock is higher premarket. However, it is only a matter of time before the market notices that BofA is starting to take aggressive losses on its CRE/credit card exposure and it is unclear how much more of this lies ahead. As such, don’t be surprise if what is a modest move higher in the stock premarket reverses in the coming hours.
The full invest presentation is below (pdf link).
Tyler Durden
Tue, 04/16/2024 – 08:31
via ZeroHedge News https://ift.tt/T2Amexs Tyler Durden