Home Sales Plunge At Fastest Rate In 16 Months

It seems, despite the Fed’s efforts to unscamble the treasury complex’s eggs, that the rate shock of a taper/no-taper decision has become sticky in the housing market. With the fast money exiting, existing home sales missed expectations for the 4th month in a row – dropping to the lowest annualized number since June (very much against the trend in recent years). This is the biggest month-over-month drop in existing home sales since June 2012 but, of course, NAR has an excuse… “low inventory is holding back sales.” So, in other words, they could sell loads more houses if only there were more available for sale (or prices were lower…)…

This is not a “seasonal” thing… and in fact is very much against the seasonals of the last few years…


Via NAR,

Lawrence Yun, NAR chief economist, said a flattening trend is expected. “The erosion in buying power is dampening home sales,” he said. “Moreover, low inventory is holding back sales while at the same time pushing up home prices in most of the country. More new home construction is needed to help relieve the inventory pressure and moderate price gains.”


The median time on market for all homes was 54 days in October, up from 50 days in September, but well below the 71 days on market in October 2012. Short sales were on the market for a median of 93 days, while foreclosures typically sold in 46 days, and non-distressed homes took 53 days. Thirty-six percent of homes sold in October were on the market for less than a month.


Total housing inventory at the end of October declined 1.8 percent to 2.13 million existing homes available for sale, which represents a 5.0-month supply at the current sales pace; the relative supply was 4.9 months in September. Unsold inventory is 0.9 percent above a year ago, when there was a 5.2-month supply.


via Zero Hedge http://feedproxy.google.com/~r/zerohedge/feed/~3/91dmTlIxZTg/story01.htm Tyler Durden

According To CBS Poll, Obama's Approval Rating Finally Catches Down With Dubya

Well that escalated quickly. Just a week ago we noted that President Obama’s approval rating trajectory was following an increasingly Dubya-esque route and sur eneough, today, a CBS poll shows that a mere 37% “approve” of the job Obama is doing. This is the same poor approval rating as Bush II’s second term at this time and perhaps more ironically comes only a month or so after he crowed of the Republicans’ collapsing polling results during the debt-ceiling debacle. In aggregate, as RealClearPolitics shows, Obama’s approval rating has collapsed to the lowest on record (and likewise his disapproval rating has soared). We await the next ‘distraction’ from the administration’s dismal state of affairs…


Simply out – it’s been a one-way street since the election.. Over-promise and under-deliver – the mantra of every 2nd term president…


Source: RealClearPolitics


via Zero Hedge http://feedproxy.google.com/~r/zerohedge/feed/~3/I0LDSbSG5Sc/story01.htm Tyler Durden

According To CBS Poll, Obama’s Approval Rating Finally Catches Down With Dubya

Well that escalated quickly. Just a week ago we noted that President Obama’s approval rating trajectory was following an increasingly Dubya-esque route and sur eneough, today, a CBS poll shows that a mere 37% “approve” of the job Obama is doing. This is the same poor approval rating as Bush II’s second term at this time and perhaps more ironically comes only a month or so after he crowed of the Republicans’ collapsing polling results during the debt-ceiling debacle. In aggregate, as RealClearPolitics shows, Obama’s approval rating has collapsed to the lowest on record (and likewise his disapproval rating has soared). We await the next ‘distraction’ from the administration’s dismal state of affairs…


Simply out – it’s been a one-way street since the election.. Over-promise and under-deliver – the mantra of every 2nd term president…


Source: RealClearPolitics


via Zero Hedge http://feedproxy.google.com/~r/zerohedge/feed/~3/I0LDSbSG5Sc/story01.htm Tyler Durden

For The First Time In Four Years Caterpillar Posts Negative Retail Sales Across The Board

All “recovery watchers” are urged to look somewhere else than the just released monthly Caterpillar dealer retail sales. Because while in September there was some hope that North American industrial demand may finally be picking up when retail sales on the continent posted the first two month sequential increase since 2012 even as the rest of the world was stuck deep in negative territory, that hope too was just been dashed with October North American retail sales posting the first decline of -2% since July. And unfortunately while North American sales just rejected any glimmer of a localized recovery, the rest of the world just keeps getting worse and worse, with negative sales prints across the board for every region – the first time this has happened since February 2010. The only difference is that then the trend was higher. Now, well, it isn’t.

As for the rest of the CAT story: we have covered it more than enough in the past – find more here, here, here and here. And then there is, of course, Jim Chanos.


via Zero Hedge http://feedproxy.google.com/~r/zerohedge/feed/~3/jWC0_0w11Iw/story01.htm Tyler Durden

"Whatever It Takes": European Corporate Results Crater Thanks To Strong Euro

Talking-heads and commission-takers have momentum-chased clients’ hard-earned money into Europe’s ‘what works now’ markets – on the basis of what has now proved to be entirely fallacious macro- and micro-fundamental improvement (as we noted here and here). But, while “whatever it takes” has smashed bond spreads lower and has blown stock prices higher; most critically, the ‘confidence’ has seen the EUR rise almost 15% against the USD from its July 2012 “whatever It Takes” lows. The effect of this EUR strength is to collapse earnings growth expectations as European competitiveness is crushed (core or periphery). Of course, bulls can rest assured, as the following chart shows, 2014 is expected to hockey-stock back to record EPS growth (just like 2013 was supposed to?).


So it would seem, “whetever it takes” now means – jawbone the EUR down whenever we can… (and we wonder what that will do to US earnings as the USD is ramped)…


Source: UBS


via Zero Hedge http://feedproxy.google.com/~r/zerohedge/feed/~3/l_8LQ0FP5CM/story01.htm Tyler Durden

“Whatever It Takes”: European Corporate Results Crater Thanks To Strong Euro

Talking-heads and commission-takers have momentum-chased clients’ hard-earned money into Europe’s ‘what works now’ markets – on the basis of what has now proved to be entirely fallacious macro- and micro-fundamental improvement (as we noted here and here). But, while “whatever it takes” has smashed bond spreads lower and has blown stock prices higher; most critically, the ‘confidence’ has seen the EUR rise almost 15% against the USD from its July 2012 “whatever It Takes” lows. The effect of this EUR strength is to collapse earnings growth expectations as European competitiveness is crushed (core or periphery). Of course, bulls can rest assured, as the following chart shows, 2014 is expected to hockey-stock back to record EPS growth (just like 2013 was supposed to?).


So it would seem, “whetever it takes” now means – jawbone the EUR down whenever we can… (and we wonder what that will do to US earnings as the USD is ramped)…


Source: UBS


via Zero Hedge http://feedproxy.google.com/~r/zerohedge/feed/~3/l_8LQ0FP5CM/story01.htm Tyler Durden

Core Retail Sales Just Beat Expectations While Annual Inflation Drops To Lowest Since 2009

Following several months of disappointing retail sales, and two months of missed expectations, October finally saw the best beat in headline expectations since April, with retail sales rising 0.4% vs 0.1% expected. However, as has been the case in all of 2013, the bulk of this beat was driven by car sales, which rose by 1.3%, leaving sales ex autos beating by the tiniest of fractions at 0.2% vs 0.1% expected, and ex autos and gas +0.3%, vs 0.2% expected.

Looking at the components, following month after month of clothing store
sales misses, this category finally posted a modest 1.4%
rebound, together with an increase in Electronic and Sporting goods
sales, amounting to 1.4% and 1.6%, respecitvely. This was offset by the
traditionally strong Building materials sales which declined by 1.9% in
October.


Unlike the exuberant inflation-spree that government-provided CPI showed during the Fed’s QE2, since the start of QE3, inflation data (according to the never-manipulated government providers) has been on a downtrend. The latest print  – at expectations of 1.0% year-over-year – is the lowest CPI since October 2009. What is perhaps more notable is the drop into deflation on MoM basis (CPI -0.1% MoM vs +0.1% exp). Of course, the market’s reaction is exuberance as this clearly gives the Fed a green light to provide more life-giving liquidity to enable nominal stock prices to rise. However, a glance at the chart below might just remind traders (and the Fed) of the Einsteinian foolishness that expectation.


via Zero Hedge http://feedproxy.google.com/~r/zerohedge/feed/~3/NZhq3jr6m5c/story01.htm Tyler Durden

BoE Survey Shows Growing Fears Of House Price Crash

Today’s AM fix was USD 1,271.50, EUR 939.69 and GBP 787.11 per ounce.
Yesterday’s AM fix was USD 1,272.25, EUR 942.13 and GBP 790.12 per ounce.

Gold fell $0.30 or 0.02% yesterday, closing at $1,273.40/oz. Silver slipped $0.09 or 0.44% closing at $20.32/oz. Platinum climbed $3.40 or 0.2% to $1,411.40/oz, while palladium rose $3.75 or 0.5% to $718.47/oz.


Gold in GBP, 1 Year – (Bloomberg)

Gold in sterling terms is testing strong support at the £775/oz level. A breach of this level could lead to gold testing the next level of support at £740/oz and below that at £700/oz which was resistance in 2009 (see 5 year chart below).

Gold was trading in a tight range until it suffered another very sharp concentrated sell off at 1126 GMT which led to prices falling from $1,272/oz to $1,259/50 in seconds. The selling was so furious and concentrated that it led the CME to stop trading for a significant twenty seconds. Some entity appeared determined to get the gold price lower and they succeeded – for now.

Gold failed to make any headway despite dollar weakness after more dovish comments from exiting Fed Chairman Ben Bernanke about the bank’s bond purchases.
 
Bernanke said yesterday that the Fed will maintain an ultra loose U.S. monetary policy for as long as needed and will only begin to taper bond buying once it is assured that labour market improvements would continue.

The assumption that QE will be trimmed is like a lot of assumptions – wrong. There are strong grounds for believing that the weak state of the U.S. economy may lead to Bernanke’s even more dovish successor, Yellen, increasing the QE programme.

Physical demand continues at these levels but is not at the very high levels seen in recent months.

Many bullion coin and bar buyers have accumulated their allocation of gold and silver and are waiting for higher prices. There is a real sense of the calm before the storm in the gold market. How that will manifest and the catalysts for a resumption of the bull market is yet to be seen.


Gold in GBP, 5 Year – (Bloomberg)

?The Bank of England’s Systemic Risk Survey semi annual report to quantify and track market participants’ views of risks to, and their confidence in, the UK financial system shows increasing concerns of a house price crash.

The report presents the results of the 2013 H2 survey, which was conducted between 23 September and 24 October 2013 with 76 financial services companies.

Fears that a house price crash could damage the financial system have risen sharply in the last year, the key Bank of England survey shows. Increased concerns were expressed by the participants over ultra loose monetary policies and the extended low interest rate period.

Concerns about a property price bubble rose and were mentioned by 36% of respondents, up 21% from 14% since the previous survey in the second half of 2012. Concerns were concentrated almost exclusively on the residential market, where responses focused on the risk of a house price correction. 

As we know house price corrections tend to feed on themselves and often lead to house price crashes.

Other Key Risks To The UK Financial System:
• Perceptions of the two main risks to the UK financial system remain sovereign risk and the risk of an economic downturn, although citations of both have fallen: 74% of respondents mentioned the former (-3 percentage points since May 2013) and 67% (-12 percentage points) the latter. Concerns over sovereign risk continue to focus on Europe, but unsurprisingly given the uncertainty surrounding the U.S. debt ceiling negotiations that prevailed during the survey period, there was a sharp increase in concerns around U.S. sovereign risk.

• For the second survey in succession, risk surrounding the low interest rate environment was the fastest growing, with 43% of respondents citing it, up 17 percentage points since May 2013. Over half of the responses emphasised risks around low rates, with the remainder referring to risks associated with a snapback in those low rates to more normal levels. Perceived risk around property prices also rose, being mentioned by 36% of respondents, up 11 percentage points since the previous survey. Concerns were concentrated almost exclusively on the residential market, where responses focused on the risk of a house price correction.

• Other top risks include regulation/taxes (cited by 41% of respondents, up 1 percentage point since May 2013), financial institution failure/distress (+4 percentage points to 30%) and operational risk (+1 percentage point to 25%).

Outside of the top seven, geopolitical risk has grown in prominence, with concern focusing on instability in the Middle East.

The report may have led to GBP weakness upon its release as the pound fell against the dollar, euro and gold.


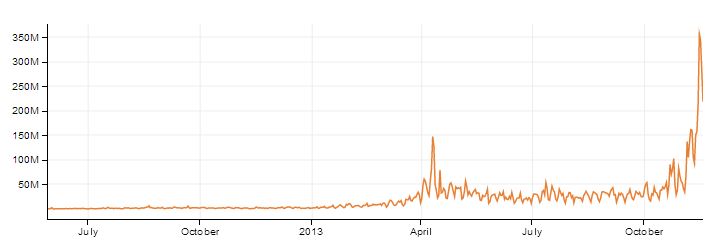
UK Rightmove Regional Avg Asking Price Greater London, 2002-Today – (Bloomberg)

Interestingly, also on Monday came news of a sharp 5% drop in London property prices in what could portend a bust of the London property bubble.

Values in the U.K. capital dropped 5%, or 26,956 pounds ($43,500), from the previous month to an average 517,276 pounds, Rightmove PLC said Monday. Across England and Wales, average prices declined by 2.4%.

Estate agents and property industry blamed the falls on a seasonal pre-Christmas decline, however valuations are extremely stretched with very low yields and the hot money that has fueled the huge increase in London property prices may be pulling back.


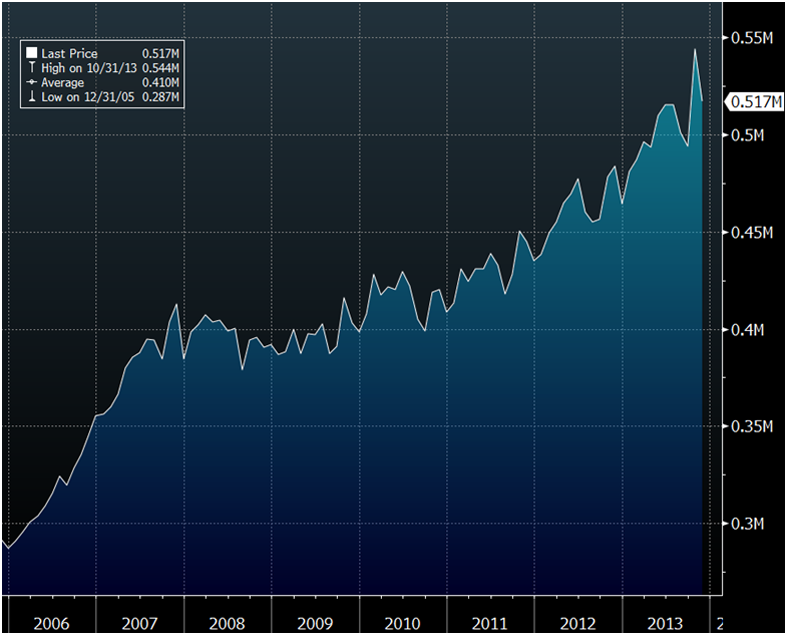
UK Rightmove Regional Avg Asking Price Greater London, 2006-Today – (Bloomberg)

“This is different” and “this location is different” is the mantra of every property bubble. We will soon see if the London property bubble is truly different or will suffer the fate of bubbles throughout history.

Of the four charts in our market update today, which ones do you think show characteristics of a bubble?

Those diversifying and buying gold in the UK today will be rewarded in the coming years. The smart money is reducing exposure to overvalued London property and increasing exposure to undervalued gold.

Click Gold News For This Week’s Breaking Gold And Silver News
Click Gold and Silver Commentary For This Week’s Leading Gold, Silver Opinion
Like Our Facebook Page For Interesting Insights, Blogs, Prizes and Special Offers 


via Zero Hedge http://feedproxy.google.com/~r/zerohedge/feed/~3/NDm_dzpCGv0/story01.htm GoldCore

Bitcoin Bonanza

Click here to follow ZeroHedge in Real-time on FinancialJuice

Five years ago it was worth $0. Then, a month and a half ago it went to $150 a piece. On Monday it shot to over $600. On Tuesday, the value rose to over $900, meaning a 6, 445%-increase in value since the start of the year. It plummeted to $531 at midday today and then recovered reaching $793 while being traded on the Asian markets. Bitcoin: it’s the bonanza of the century.

Volatility and hikes are based on nothing except speculation and the desire to make a mint, thinking that you can predict what the markets are going to do. But, will that Bitcoin volatility lead to a bubble? Or is it bringing in a new era of a new type of currency that people are willing to use and that merchants are now being forced to accept? It might never become a legitimate currency in the future, but that’s hardly important when you can make a profit from it. Of course central banks are at risk from the use of virtual currencies as it would mean that they would have little control over what we spend and how transactions are carried out. Is Bitcoin the death of our central banks?

Some might say that Bitcoin is associated with crime and is an easy way for illicit transactions to take place. Tell me one currency in the world that isn’t laundered these days? Tell me one place in the world where there is a currency that is clean? Pure snow-white virgin money doesn’t and never has existed. Just because it’s associated with crime doesn’t mean it’s not good for the rest of the world. All of the currencies of the world are associated with crime somehow.  Perhaps after all the fall of the Dollar, the death of the greenback will not be because the Chinese have taken the world over and imposed the Renminbi as the reserve currency on the world. Perhaps it will be the Bitcoin that takes over the world economically today.

  • When Bitcoin started out in 2009 after being founded by Satoshi Nakamoto (or under his real name of Gavin Andresen) one Bitcoin was worth $0.30.
  • Bitcoin Transactions in $ 
  • Bitcoin Transactions in $

  • It rose to $32, but then fell to $2. There are some 12 million Bitcoins in circulation today and the number of Bitcoins issued every four years is reduced by 50% (and will be until that number reaches a circulation level of 21 million Bitcoins).
  • The currency is already accepted on some of the world’s most highly-ranked internet sites today:
    • WordPress.com ranked 22 in the world, offering custom-designed software and templates. They have accepted Bitcoins since November 2012.
    • The Pirate Bay, ranked 108 in the world which started accepting Bitcoins in April 2013 for their music and move-software directory.
    • Reddit, which ranks 117 in the world and accepted Bitcoins for the first time in February 2013 for the social and entertainment network site.

There are plenty more and they will be increasing in the future, simply because it’s the people that have decided that they are willing and ready to use Bitcoins as a means of exchange. Have the people started the demise of the Dollar and all other currencies? Are we living a moment in history that we shall look back upon in years to come as we wave goodbye to the hegemonic control of the politically-aided and biased reserve currency that is the greenback and that all other currencies are vying to overtake? Will they all lose out, because we have decided for it to happen? That will certainly wipe the smile off the faces of some at the top of the hill.

Gaining legitimacy is essential for the Bitcoin to be a valued and a valuable means of exchange.  The difference between Bitcoin and any other currency that is controlled by a government is that Bitcoins have become accepted because the market has decided that they are. People want them and merchants accept them. It is not a political currency but quasi-commodity money.  The number of transactions has suddenly increased since the start of November and it has now reached dizzy heights around the world. Even governments are starting to recognize the existence and the validity of Bitcoins today. Germany in August 2013 decided to recognize the virtual money as a real currency, legally and fiscally approving it is valid.

When Andresen spoke of begging Julian Assange not to use Bitcoin back in 2010 as a means of getting around the normal method of financial transactions and thus finding a route to funding WikiLeaks, he said ‘it will destroy us’ adding that they were too small a company to be able to deal with it. Although, with hindsight the ‘you-will-destroy-us’- statement probably had little to do with the nascent company not being able to cope with the financial trading of the currency that had been invented, but the fact that Bitcoin would have been closed down and nipped in the bud before it had got off to a start. Now we can see why Bitcoin wanted to steer away from that can of worms. It had greater things in its sights than WikiLeaks.

It’s a rare thing to have the opportunity today to choose which currency we want to use. Maybe this time the choice will be the right one. Maybe the central banks, the ones that have done the damage in the past and are continuing to do so today will have their power taken away from them.

Climbing the greasy pole that politics has become is nothing to do with who you are and what you say. It has everything to do with where you come from and what you have in the bank account to back you up.


Originally posted: Bitcoin Bonanza


The Super Rich Deprive Us of Fundamental Rights |  Whining for Wine |Cost of Living Not High Enough in EU | Record Levels of Currency Reserves Will Hit Hard | Internet or
Splinternet
 | 
World Ready to Jump into Bed with China

 Indian Inflation: Out of Control? | Greenspan Maps a Territory Gold Rush or Just a Streak? | Obama’s Obamacare: Double Jinx | Financial Markets: Negating the Laws of Gravity  |Blatant Housing-Bubble: Stating the Obvious | Let’s Downgrade S&P, Moody’s and Fitch For Once | US Still Living on Borrowed Time | (In)Direct Slavery: We’re All Guilty |

Technical Analysis: Bear Expanding Triangle | Bull Expanding Triangle | Bull Falling Wedge Bear Rising Wedge High & Tight Flag


via Zero Hedge http://feedproxy.google.com/~r/zerohedge/feed/~3/z33hxJLc2f4/story01.htm Pivotfarm

JCP Burns Through $3 Billion In 2013: All The Earnings Charts That Matter

Moments ago JCP announced results for Q3 which were atrocious, with Q3 earnings of -$1.81 coming in worse than already numerously lowered expectations of -$1.74. Comp store sales declined 4.8% with total revenues of $2.779 billion in the quarter, even as margins continued contracting, and dipped to 29.5%. The margin chart below says it all: Q3 margins have followed the following path: 2011- 37.4%, 2012 – 32.%5; 2013 – 29.5%… one can figure out what comes next. But most notably, in Q3 the company once again ignited its cash burn afterburners, with total free cash flow of $898 million, bringing the total cash burn for 2013 to a whopping $3 billion! Luckily for the company, in 2013 it has been able to fund all of this cash burn through a combination of cash and stock, amounting to $3.2 billion YTD. At October 31, the company had $1.2 billion in total cash which should allow it to enter 2014 without filing for bankruptcy, although with a total debt load of $5.6 billion compared to $3 billion a year ago, only very foolish people can possibly see how this story has anything but a very unhappy ending.

And with yet another horrible quarter in the books, and the company still hemmorhaging cash, we enter the make or break Q4, where revenues jump as margin crater, but cash flows are expected to increase. Because if JCP can’t generate positive FCF in the holiday quarter, it’s pretty much game over.

Free Cash Flow:


Revenues – Q4 will clearly be the liquidation make or break quarter.


Margins – liquidation comes at a price: if the margin is too low there will be no FCF. Can the company pull it off?


via Zero Hedge http://feedproxy.google.com/~r/zerohedge/feed/~3/TXPMVVhBXYo/story01.htm Tyler Durden