How The FDA is Killing Molecular Medicine: Q/A w Peter Huber

When the FDA is shutting down personal genetic services such as
23andMe, it’s blocking the next great era in medical
innovation.

Click above to hear Peter Huber talk about his new book, The
Cure in the Code, and what needs to happen to create truly
personalized drugs.

Originally released on November 20, 2013. Here’s the full
writeup:

“The
search for one-dimensional, very simple correlations – one drug,
one clinical effect in all patients – is horrendously obsolete,”
says Peter
Huber
, a senior fellow at the Manhattan Institute and the
author, most recently, of The
Cure in the Code: How 20th Century Law is Undermining 21st Century
Medicine
.

Pharmaceuticals, Huber says, offer amazing and important ways of
improving our health and quality of life and today’s scientists and
doctors have the ability to tailor drugs to patients’ unique
genetic codes. It’s nothing less than an outrage, argues Huber,
that innovation is being blocked by the Federal Drug
Administration, which clings to an outdated one-size-fits-all drug
approval model.

Huber sat down with Reason TV’s Nick Gillespie to discuss the
future of “molecular medicine,” the FDA drug-approval process, and
how AIDS activism in the 1980s and ’90s provides a model for
disrupting the government’s refusal to allow experimentation and
innovation.

About 10 minutes.

For more of Reason‘s coverage on the FDA,
go here.

Camera by Jim Epstein and Anthony Fisher. Edited by Joshua
Swain.


Go here for more links, resources, etc.

from Hit & Run http://reason.com/blog/2013/11/29/how-the-fda-is-killing-molecular-medicin
via IFTTT

The Magic Of Forward P/E Multiples In One Chart

As readers may or may not recall, one of the main arguments the bulls had in early 2008, a month after the recession had already begun (according to the NBER’s retrospective conclusion over a year later) to justify that the S&P 500, which had recently hit all time highs of 1546, was not in a bubble is that the projected EPS for the following year, 2009, were 120, which meant the multiple was an oh so very cheap 12x. The same analysis with the even nearer, 2008, S&P EPS which at that point were expected to print just below 100, suggested the S&P at around 1500 was a “healthy” 15x multiple. Unfortunately as the events of 2008 showed, not only did the financial system nearly implode, but earnings, both actual and projected, cratered. The result is that the 2009 EPS which was initially forecast to be $120 ultimately ended up being half of that, or $60 (see chart below), which also meant that the forward multiple of a “very cheap” 12x or so ended up being, drumroll, just a tad bubbly 24x!

Which is why we urge anyone using the naive argument that stocks now are cheap based on forward multiples to observe the following chart, which shows that S&P 500 2013 EPS, projected to be just below 110, are now just above what the S&P was supposed to earn in early 2008 and well below the then projected 2009 EPS. Where it gets more amusing is that the current estimate for 2014 EPS is precisely where 2009 EPS were supposed to land…. before those particular earnings ended up being crushed in half.

Finally as we will show in a subsequent post, 2013 EPS on a GAAP basis are currently precisely $100 with another $10.25 coming from adjustments and other write-offs. Which means that on a recurring Net Income basis, assuming Q4 earnings are roughly in line with expectations, the S&P 500 is currently trading at over 18x GAAP earnings, or as the same people who in 2008 said “the market is not in a bubble” would call it, “cheap.


via Zero Hedge http://feedproxy.google.com/~r/zerohedge/feed/~3/TJIdVcSMMr8/story01.htm Tyler Durden

Oil Supplies in Storage Passing 400 Million Threshold Soon

By EconMatters  


Trend is to Store more Oil 


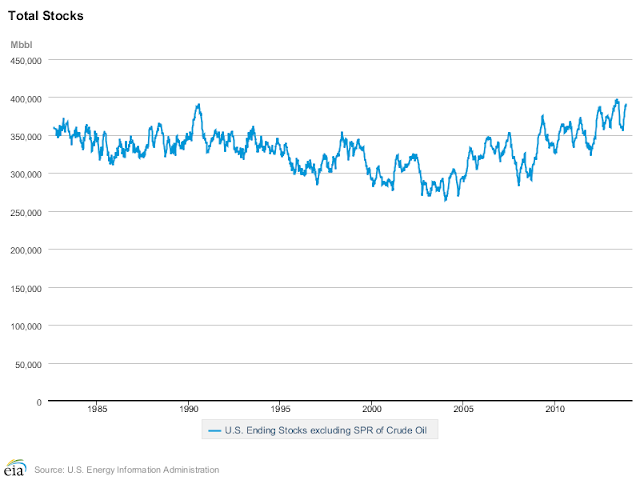
A year ago oil in storage stood at 274 million barrels, and with another robust year of domestic production, and despite curtailed imports, the US Oil Inventory stands at 391 million barrels and climbing. 


We are still technically in the building season for oil supplies which peaked in late May just shy of 400 Million Barrels, before the drawing season kicked off with the exporting of gasoline through increased refinery utilization led by the gulf coast refiners with their increased capacity to take advantage of the spread differential and cheaper operational energy in natural gas to export refined products more competitively than peer nations.


New Records Coming Soon


The domestic need for refined products was stagnant at best, the real demand was in the export market, without a robust export market for refined products, oil supplies would have crushed the 400 Million Barrier this summer, and prices at the pump would have been much cheaper here stateside. 


So the drawing season accounted for roughly a 40 million barrel retracement in US supplies, and we are not even close to the  middle of the building season, which even by conservative estimates should continue until mid-March of 2014. 


We might have some year-end selling of US inventories due to tax reasons, especially in Texas, but after all is said and done, if we go by the recent historical barometer of last year where we added roughly 25 million barrels of oil supplies to inventories, this puts supplies around the 416 Million Barrels of Oil level in the heart of the building season.


If domestic production continues ahead of pace and imports are not properly managed then maybe 425 Million Barrels in storage is possible, all modern records at this point in the data.


Fundamentals & Price: A Path Less Traveled in Recent Years


What effect this has on Oil prices is an entirely different matter as the Oil market is one of the most manipulated markets in the trading world, just look at the Brent-WTI Spread Trade this year for proof of that, and over the last 4 years for that matter.  


All markets are pretty bad these days when it comes to market shenanigans, and when the Federal Reserve has basically gotten into the business of artificially created wealth through artificially pushing up asset prices all bets are off when it comes to predicting price adhering to fundamentals in the marketplace. 


Fundamentals have become irrelevant in most markets these days. But some of us analyst types like to do fundamental analysis just for old time`s sake, who knows it might become a useful tool again sometime in the future once markets lose this unprecedented liquidity injection phenomenon.  


Domestic Production


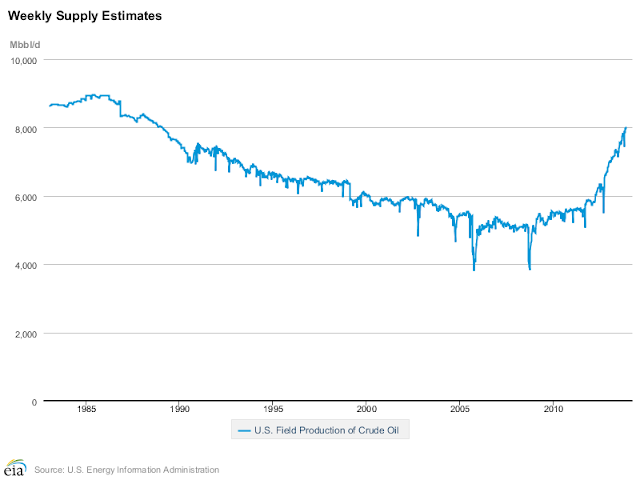
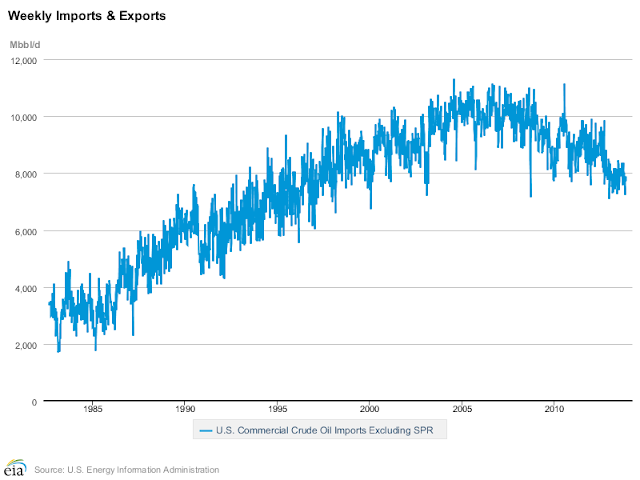
In looking at Domestic production, the US produces over 8 million barrels per day compared with 6.8 million this time last year, quite a significant jump year on year, and ahead of where my most optimistic forecast was for this metric earlier in the year in March of 2013. This increase in Domestic production is being offset by a reduction in Oil imports with the US importing 7.7 Million barrels per day versus over 8.1 million barrels this time last year.


Managing Imports


So the goal is to control supplies through managing imports to align with the substantial increases in Domestic production over the last several years, and this trend continues to play out at present. How far this strategy can go before world oil prices start reacting with considerable downward pressure is anybody`s guess but definitely something to keep track of in 2014. 


But the last several months have had several weeks where Domestic production is more than Imports, and this milestone is quite an achievement for an ‘Outsourcer’ Nation with its core economic strategy of the last 30 years for goods and services. 


2014 & Oil Metrics


Thus if we go by recent historical trends is the 9 million barrels per day of Domestic Oil production really possible for 2014? Can the US hit the 9.5 Million Barrel per day mark? And if so what does this mean for Global Oil prices? 


All these dynamics will be worth watching in 2014, to be sure there are other factors revolving around China, Iran and Venezuela not to mention Saudi Arabia`s strategy in regard to Oil production, but nonetheless 2014 ought to be an interesting one for the Oil Market.


via Zero Hedge http://feedproxy.google.com/~r/zerohedge/feed/~3/sxHtF3EuHnA/story01.htm EconMatters

Jacob Sullum in Forbes: Why Drinking Is Not a Good Excuse for Smoking Crack (or Anything Else)

Toronto Mayor Rob Ford and U.S. Rep. Trey Radel
(R-Fla.) both blame demon rum for driving them to cocaine. Writing
in Forbes, Senior Editor Jacob Sullum explains why it
would be a mistake to accept that excuse.


Read the article
.

from Hit & Run http://reason.com/blog/2013/11/29/jacob-sullum-in-forbes-drinking-is-not-a
via IFTTT

There Are 199,235 “Ultra High Net Worth” People In The World With Over $30 Million In Assets

It is no secret that the bulk of “very rich people” in recent years has been created in Asia (where some $15 trillion in liquidity has entered broad circulation in just the past five years). As the FT reports, “Asia is producing more new wealth than any other part of the world at any point in history. Over the past five years, the assets of rich individuals have grown at triple the rate of the wealthy elsewhere, while the number of rich people has increased by twice that of other regions. Their number grew by almost 10 per cent to reach 3.7m last year, according to the survey, while their wealth expanded by 12 per cent to $12tn.” However, to find the truly ultra-high-net-worthy (UHNW), those with over $30 million in net assets, one has to go to the US and Europe – the places where Ben’s print baby print policy has most aggressively inflated the latest asset bubble, making the richest richester. “More people from the US and Europe entered this club in the past year than from anywhere else – the population in China and Brazil actually declined slightly.” So how many ultra-high-net-worth individuals are there? The answer: 199,235.

Some observations on how the UHNW allocate their wealth:

They will often have $20m tied in a business, with $5m in property and $5m to play with, says Mykolas Rambus, chief executive of Wealth-X.

For those with $30m or more, the first thing they want to buy once they hit that bracket is an aircraft, according to Bassam Salem, chief executive of Citi’s private bank in Asia.


“The newly rich are a bit more exuberant in terms of showing their wealth initially,” he says. “But it takes a little while to become ultra-wealthy for most. The richer you are, the less you want to show it in many countries.”


The exception to this is mainland China, where more people have become vastly rich in a much shorter time because of the explosive pace of growth in recent years. The average age of Citi’s ultra-rich clients in Asia excluding Japan is about 70, according to Mr Salem, whereas in China it is 35.

Another stunning age-related detail: “the average age of millionaires in China is about 33, but that of the world’s ultra-wealthy is 52.

Naturally, the ultra wealthy – especially those from China – are the target audience of the UHNW advisors of the world.

“The reason this market is so lucrative is that a lot of the wealth is not very liquid yet,” he says. “They are likely to have a monetising event within a couple of years, like a listing, and they tend to spread their wealth around among a number of banks.”


There are many more potential clients among those with $5m or less, but they might only have liquid assets of $250,000 or less. “You cannot make money out of that in today’s high cost regimes,” Mr Rambus adds.


The newly rich can be much more demanding clients for private banks and other wealth managers, partly because they can take some convincing that a service they have never used or thought about is worth paying for. On top of this, as they are normally still tied in with their businesses, their investment expectations are for much higher returns than those who have been wealthier for longer and are more interested in preservation.

Sigh – the hard life of advising those for whom money is no object what to invest in…

Finally, if one moves beyond the merely UHNW set, and focuses squarely on the world’s billioanires, of which there are roughly 2170 as we observed previously, the story is a little different.

As Wealth-X reports, the average billionaire is worth US$3.0 billion with a liquidity of 18 percent, equal to US$545 million in cash and other liquid assets per person. This liquidity cushion of over half a billion dollars is higher than it was before the global financial crisis of five years ago, suggesting that the old mantra of “cash is king” remains as relevant as ever.

Private holdings still form the largest component of a typical billionaire’s wealth, with an average of over a US$1 billion in publicly-held companies on top of this.

The breakdown of the average billionaire’s wealth can be seen below:

Ah, the New Normal: $3 billion in assets for some, Wal-Mart stampedes for everyone else.


via Zero Hedge http://feedproxy.google.com/~r/zerohedge/feed/~3/hrCDvI_nx48/story01.htm Tyler Durden

There Are 199,235 "Ultra High Net Worth" People In The World With Over $30 Million In Assets

It is no secret that the bulk of “very rich people” in recent years has been created in Asia (where some $15 trillion in liquidity has entered broad circulation in just the past five years). As the FT reports, “Asia is producing more new wealth than any other part of the world at any point in history. Over the past five years, the assets of rich individuals have grown at triple the rate of the wealthy elsewhere, while the number of rich people has increased by twice that of other regions. Their number grew by almost 10 per cent to reach 3.7m last year, according to the survey, while their wealth expanded by 12 per cent to $12tn.” However, to find the truly ultra-high-net-worthy (UHNW), those with over $30 million in net assets, one has to go to the US and Europe – the places where Ben’s print baby print policy has most aggressively inflated the latest asset bubble, making the richest richester. “More people from the US and Europe entered this club in the past year than from anywhere else – the population in China and Brazil actually declined slightly.” So how many ultra-high-net-worth individuals are there? The answer: 199,235.

Some observations on how the UHNW allocate their wealth:

They will often have $20m tied in a business, with $5m in property and $5m to play with, says Mykolas Rambus, chief executive of Wealth-X.

For those with $30m or more, the first thing they want to buy once they hit that bracket is an aircraft, according to Bassam Salem, chief executive of Citi’s private bank in Asia.


“The newly rich are a bit more exuberant in terms of showing their wealth initially,” he says. “But it takes a little while to become ultra-wealthy for most. The richer you are, the less you want to show it in many countries.”


The exception to this is mainland China, where more people have become vastly rich in a much shorter time because of the explosive pace of growth in recent years. The average age of Citi’s ultra-rich clients in Asia excluding Japan is about 70, according to Mr Salem, whereas in China it is 35.

Another stunning age-related detail: “the average age of millionaires in China is about 33, but that of the world’s ultra-wealthy is 52.

Naturally, the ultra wealthy – especially those from China – are the target audience of the UHNW advisors of the world.

“The reason this market is so lucrative is that a lot of the wealth is not very liquid yet,” he says. “They are likely to have a monetising event within a couple of years, like a listing, and they tend to spread their wealth around among a number of banks.”


There are many more potential clients among those with $5m or less, but they might only have liquid assets of $250,000 or less. “You cannot make money out of that in today’s high cost regimes,” Mr Rambus adds.


The newly rich can be much more demanding clients for private banks and other wealth managers, partly because they can take some convincing that a service they have never used or thought about is worth paying for. On top of this, as they are normally still tied in with their businesses, their investment expectations are for much higher returns than those who have been wealthier for longer and are more interested in preservation.

Sigh – the hard life of advising those for whom money is no object what to invest in…

Finally, if one moves beyond the merely UHNW set, and focuses squarely on the world’s billioanires, of which there are roughly 2170 as we observed previously, the story is a little different.

As Wealth-X reports, the average billionaire is worth US$3.0 billion with a liquidity of 18 percent, equal to US$545 million in cash and other liquid assets per person. This liquidity cushion of over half a billion dollars is higher than it was before the global financial crisis of five years ago, suggesting that the old mantra of “cash is king” remains as relevant as ever.

Private holdings still form the largest component of a typical billionaire’s wealth, with an average of over a US$1 billion in publicly-held companies on top of this.

The breakdown of the average billionaire’s wealth can be seen below:

Ah, the New Normal: $3 billion in assets for some, Wal-Mart stampedes for everyone else.


via Zero Hedge http://feedproxy.google.com/~r/zerohedge/feed/~3/hrCDvI_nx48/story01.htm Tyler Durden

Europe’s Peak Youth Unemployment Gets Peak-er

Despite a ratings ‘upgrade’ Spain’s youth unemployment rate has re-surged to a record 57.4% (just below that of Greece which still tops the scary chart list at 58%). Italy and Portugal also saw notable rises (despite the former’s record low short-dated bond yields) at 41.2% and 36.5% respectively. Ireland and France saw modest improvements but overall the Euro-zone’s youth unemployment just keeps rising. In spite of all the rhetoric from Merkel, Van Rompuy, and Barroso, 24.4% of Europe’s under-25 population is unemployed


via Zero Hedge http://feedproxy.google.com/~r/zerohedge/feed/~3/5PjwGU8OJgE/story01.htm Tyler Durden