Submitted by David Stockman via Contra Corner blog,
During the last 64 months “buying the dips” has been a fabulously successful proposition. As shown in the sizzling graph of the NASDAQ 100 below, at it recent peak just under 4,000 this index of the high-growth, big cap non-financials stood at an astonishing 3.5X its March 2009 low. Moreover, during that 64 month period, there were but five minor market corrections—-the three largest reflecting just a 7-8% dip from the previous interim high. And as the index closed upon its current nosebleed heights, the dips became increasingly shallower, meaning that the reward for buying setbacks came early and often.
So yesterday’s 2% dip will undoubtedly be construed as still another buying opportunity by the well-trained seals and computerized algos which populate the Wall Street casino. But that could be a fatal mistake for one overpowering reason: The radical monetary policy experiment behind this parabolic graph is in the final stages of its appointed path toward self-destruction.

In fact, this soaring index reflects the most artificial, unsustainable and dangerous Fed created financial bubble ever. That’s because its was the untoward product of a completely busted monetary mechanism. What has happened is that the Fed’s historic credit expansion channel of monetary transmission has been frozen shut ever since day one of the massive Bernanke monetary expansion which began in August 2007, but went into warp-drive in the weeks after the Lehman event a year later.
Yet this madcap money printing campaign was a drastic error because it failed to account for the immense roadblock to traditional monetary stimulus that had been built up over the last several decades—namely, “peak debt” in the household and business sector. This condition means that monetary easing and drastic interest rate cuts have not elicited a surge of consumer borrowing and business capital spending and hiring as during past business cycle recoveries.
Instead, the entire tsunami of monetary expansion has flowed into the Wall Street gambling channel, inflating drastically every asset class that could be traded, leveraged or hypothecated. Stated differently, 68 months of zero interest rates had virtually no impact outside the the canyons of Wall Street. But inside the casino, they provided virtually free money for the carry trades, causing an endless bid for leveragable and optionable financial assets.
But now that the monetary flood is cresting, financial asset values hang in mid-air like Wile E. Coyote. Stranded there, they are nakedly exposed to market discovery any moment now that the real economy and sustainable corporate earnings dwell in a region far below.
That the credit channel of monetary expansion is busted and done is patently obvious in the data on the household sector. Below is both the current track of total household debt since the December 2007 peak, and the prior Greenspan housing bubble track. The latter turns out to be the last hurrah for the essential Keynesian “stimulus” gambit of the last several decades, which is to say, the one-time LBO of household balance sheets.
During the 78 months since the last peak, household credit has shrunk by 5%. Nothing like this has every happened before. Not even remotely close. And in truth, the relevant shrinkage has been even greater, since more than 100% of the slight up-tick in borrowing shown in the graph for recent quarters is owing to the explosion of student debt. By contrast, the traditional source of household “borrow and spend”—-mortgage borrowings and credit card debt—-is still below its 7-year ago peak.
Needless to say, this contrasts dramatically with the 78 month path after the 2001 cycle peak. During the Greenspan housing and credit bubble, household debt soared by nearly 90%, providing a robust, if temporary, boost to the consumption component of GDP.


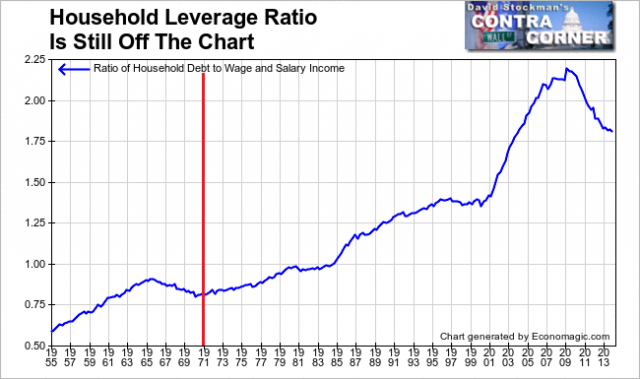
The reason for the sharp difference in the most recent cycle is that Keynesian stimulus was always an economic trick, not an permanently repeatable exercise in enlightened monetary management. Quite simply, the US household balance sheets—-as measured by outstanding credit market debt relative to wage and salary income—got used up during the decades after the nation’s fiat money debt binge incepted at the time of Camp David in August 1971.
Now, in fact, the household leverage ratio has rolled over and is slowly retracing toward the still dramatically lower and more healthy levels that prevailed prior to 1971. In this context, it is surely the case that household leverage will continue to fall—-zero interest rates notwithstanding—– because it is a demographic given. The 10,000 baby boomers retiring each and every day between now and 2030 will not be adding to household debt; they will be liquidating it.

Household Leverage Ratio – Click to enlarge
What this means is that the motor force of traditional Keynesian expansion is gone. Household consumption spending, perforce, can now grow no faster than household income and economic production, and likely even more slowly than that. The coming funding crisis of the social insurance entitlements—Medicare and Social Security—will surely jolt the American public into a realization that higher private savings will be essential to retirement survival. Accordingly, the household savings rate has nowhere to go but up in the years just ahead.

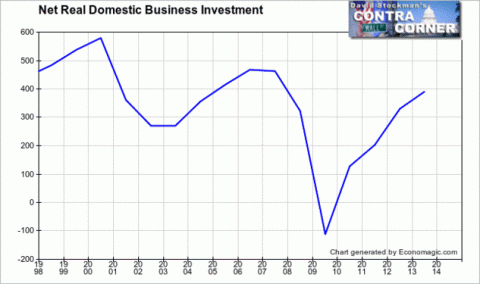
In any event, it is no mystery as to why business capital spending remains stuck on the flat-line. During the most recent quarter, real spending for plant and equipment was still 4% below its late 2007 peak——an outcome that is not even remotely comparable to the 10-25% surges that have occurred during comparable periods of prior business cycles. Business is not rushing to the barricades to add to capacity because it is plainly evident that consumer demand is not growing at traditional recovery cycle rates; and that it will never again do so given the constraints of peak debt and the baby boom retirement cycle ahead.
As shown below, in fact, real net investment in CapEx—after allowance for depreciation of assets currently consumed—- is on a declining trend. Not only does this reflect the drastic downshift in the growth potential of the US economy that has set-in during the era of monetary central planning, but it also underscores that the current stock averages are capitalizing a future that is a pure chimera.
At 19.5X reported LTM earnings, the S&P 500 is at the tippy top of its historical range, and at the point that it has invariably stumbled into a deep correction. Yet why is it rational to capitalize at even historic average PE multiples the earnings of an economy that is clearly locked into a low/no growth mode for as far as the eye can see? In truth, the market’s PE multiple should be well below the historic average generated during recent decades when Keynesian policy-makers were busy using up the nation’s balance sheets on a one-time basis in a nearly continuous campaign to stimulate credit-fueled growth.

At the end of the day, even the heavily massaged data from the Washington statistical mills cannot hide this reality. Setting aside the short-run inventory swings which cloud the headline GDP numbers each quarter, and which accounted for nearly half of the 4% gain reported for Q2, real final sales tell the true story. Notwithstanding the Fed massive balance sheet expansion since its first big rate cut in August 2007—-that is, from $800 billion to $4.4 trillion—–real final sales have grown at less than a 1% CAGR since then.
There is nothing like this tepid rate of trend growth for any comparable period in modern history. Indeed, given the clear bias toward under-reporting inflation in the BEAs GDP deflators, it is probable that during the last seven years the real economy has grown at a rate not far from zero.

All of this means that the financial markets are drastically over-capitalizing earnings and over-valuing all asset classes. So as the Fed and its central bank confederates around the world increasingly run out of excuses for extending the radical monetary experiments of the present era, even the gamblers will come to recognize who is really the Wile E Coyote in the piece.
Then they will panic.


via Zero Hedge http://ift.tt/1scxlWL Tyler Durden