Stocks, Cryptos Tumble To Close Out Catastrophic First-Half

Stocks, Cryptos Tumble To Close Out Catastrophic First-Half

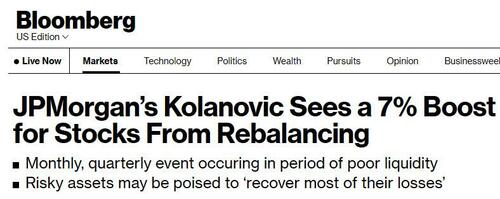
It was supposed to be a 7% ramp into month-end on billions in pension fund residual buying.

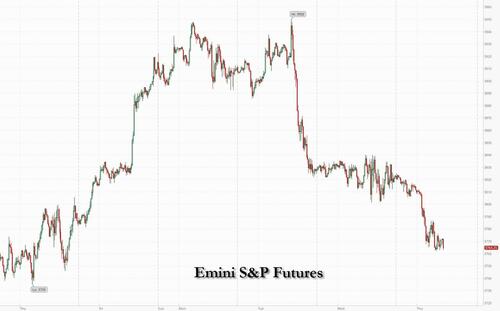
Instead, it ended up being more or less the opposite, with crypto-led liquidations dragging futures and global markets lower, and extending Wednesday losses after central bankers issued warnings on inflation and fueled concern that aggressive policy will end with a hard-landing recession, which increasingly more now see as being 2022 business, an outcome that now appears assured especially after yesterday’s disastrous guidance cut from RH, the second in three weeks!

Recession fears and inflation woes may be prolonged by today’s PCE deflator report. The consumer price gauge favored by the Fed may have picked up to 6.4% last month from 6.3%. Personal income growth probably edged up but Bloomberg Economics highlights an anticipated decline in real personal spending as a major worry.

Meanwhile, China’s economy showed further signs of improvement in June with a strong pickup in services and construction, even if the latest Chinese PMI print came slightly below expectations. Also overnight, Russia said it withdrew troops from Ukraine’s Snake Island in the Black Sea after Ukraine said its forces drove Russian troops from the area.

In any case, with zero demand from pensions so far (even though the continued selling in stocks and buying in bonds will only make the imabalnce bigger), overnight Nasdaq 100 contracts dropped 1.8% while S&P 500 futures declined 1.3%, and cryptos crumbled, with bitcoin dragged back below $19000 and Ether on the verge of sliding below $1000. The tech-heavy gauge managed to end Wednesday’s trading slightly higher, while the S&P 500 fell for a third straight day. In Europe, the Stoxx Europe 600 Index slid 1.9%. Treasuries gained, the dollar was steady and gold declined and crude oil futures edged lower again.

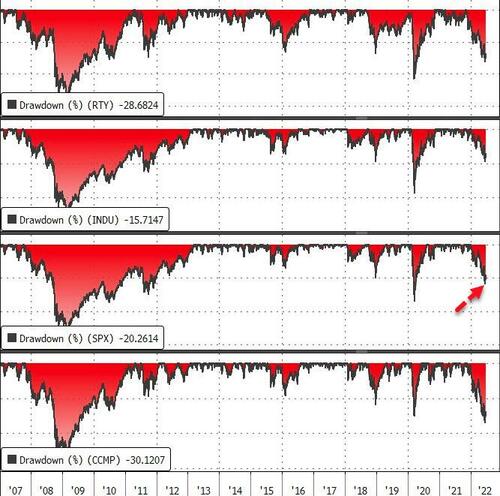
Which brings us to the last trading day of a quarter for the history books: the S&P 500 is set for its biggest 1H decline since 1970 and the Nasdaq 100 since 2002, the height of the dot.com bust. The Stoxx 600 is set for the worst 1H since 2008, the height of the GFC. 

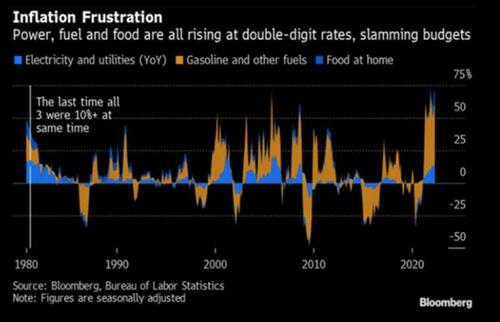
Traders have ramped up bets that the global economy will buckle under central bank tightening campaigns — and that policy makers will eventually backpedal. The bond market shifted to price in a half-point rate cut in the Federal Reserve’s benchmark rate at some point in 2023. On Wednesday, during the annual ECB annual forum, Fed Chair Jerome Powell and his counterparts in Europe and the UK warned inflation is going to be longer lasting. A view that central banks need to act fast on rates because they misjudged inflation has roiled markets this year, with global stocks about to close out their worst quarter since the three months ended March 2020.

“Markets are worried about growth as central bankers continue to emphasize that bringing down inflation is their overriding objective, and that it may take time to bring inflation down,” said Esty Dwek, chief investment officer at Flowbank SA. “We still haven’t seen total capitulation in markets, so further downside is possible.”

Meanwhile, the cost of insuring European junk bonds against default crossed 600 basis points for the first time in two years on Thursday.

And speaking of Europe, stocks are also down over 2% in early trading, with all sectors in the red. DAX and CAC underperform at the margin with autos, consumer discretionary and banking sectors the weakest within the Stoxx 600.  Here are some of the biggest European movers today:

  • Uniper shares slump as much as 23% after the German utility withdrew its outlook and said it was discussing a possible bailout from the German government following Russia’s move to curb natural gas deliveries.
  • SAP sinks as much as 6.5% after Exane BNP Paribas downgraded stock to neutral from outperform, saying it sees risks on demand side in the near term as software spending decisions come under increased scrutiny.
  • Sanofi shares decline as much as 4.5% after the French drugmaker said the FDA placed late-stage clinical trials of tolebrutinib on partial hold in US because of concerns about liver injuries.
  • European semiconductor stocks fell, following peers in the US and Asia lower amid growing concerns that the industry might face a downturn soon as chip stockpiles build. ASML drops as much as 3.4%, Infineon -4.1%, STMicro -3.1%
  • Norsk Hydro shares slide as much as 6% amid metals decline and as DNB cuts the stock to sell from hold, citing concerns about rising aluminum supply.
  • Stainless steel stocks in Europe fall, with Morgan Stanley saying the settlement on the latest ferrochrome benchmark missed its expectations. Outokumpu shares down as much as 6.6%, Aperam -7.2%, Acerinox -4%
  • Saab shares jump as much as 8.4%, after getting an order worth SEK7.3b from the Swedish Defence Materiel Administration for GlobalEye Airborne Early Warning and Control aircraft.
  • Orsted shares rise as much as 2.5%, before paring some of the gains. HSBC raises to buy from hold, saying any further downside for the wind farm operator looks limited.
  • Bunzl shares rise as much as 2.6% after the specialist distribution company said it now expects very good revenue growth in 2022.
  • Grifols shares rise as much as 7.8% after slumping on Wednesday, as the company says that the board isn’t analyzing any capital increase “for the time being.”

Earlier in the session, Asian stocks fell for a second day as tech-heavy indexes in Taiwan and South Korea continued to get pummeled amid concerns over the potential for aggressive monetary tightening in the US to rein in inflation.  The MSCI Asia Pacific Index declined as much as 1.2%, dragged down by technology shares including TSMC, Alibaba and Tencent. Taiwan slid more than 2%, while gauges in Japan, South Korea, Australia dropped more than 1%.  Stocks in mainland China rose more than 1% after the economy showed further signs of improvement in June with a strong pickup in services and construction as Covid outbreaks and restrictions were gradually eased. Traders are also watching Chinese President Xi Jinping’s trip to Hong Kong, his first time outside of the mainland since 2020. 

Asian stocks are struggling to recover from a May low as the threat of higher US rates outweighs China’s emergence from strict Covid lockdowns and its pledge of stimulus measures. While mainland Chinese stocks led gains globally this month, the rest of the markets in the region — especially those heavy with technology stocks and exporters — saw hefty outflows of foreign funds.  “Investors continue to assess recession and also inflation risks,” Marcella Chow, JPMorgan Asset Management’s global market strategist, said in an interview with Bloomberg TV. “This tightening path has actually increased the chance of a slower economic growth going forward and probably has brought forward the recession risks.” Asian stocks are set to post a more than 12% loss this quarter, the worst since the one ended March 2020 during the pandemic-induced global market rout.

Japanese stocks declined after the release of China’s data on manufacturing and non-manufacturing PMIs that showed slower than expected improvements.  The Topix Index fell 1.2% to 1,870.82 as of market close Tokyo time, while the Nikkei declined 1.5% to 26,393.04. Sony Group contributed the most to the Topix Index decline, falling 3.4%. Out of 2,170 shares in the index, 531 rose and 1,574 fell, while 65 were unchanged. “Although China is recovering from a lockdown, business sentiment in the manufacturing industry is deteriorating around the world,” said Tomo Kinoshita, global market strategist at Invesco Asset Management China’s Economy Shows Signs of Improvement as Covid Eases.

Indian stock indexes posted their biggest quarterly loss since March 2020 as the global equity market stays rattled by high inflation and a weakening outlook for economic growth.  The S&P BSE Sensex ended little changed at 53,018.94 in Mumbai on Thursday, while the NSE Nifty 50 Index dropped 0.1%. The gauges shed more than 9% each in the June quarter, their biggest drop since the outbreak of pandemic shook the global markets in March 2020. The main indexes have fallen for all but one month this year as surging cost pressures forced India’s central bank to raise rates twice and tighten liquidity conditions. The selloff is also partly driven by record foreign outflows of more than $28b this year.  Despite the turmoil in global markets, Indian stocks have underperformed most Asian peers, partly helped by inflows from local institutions, which made net purchases of more than $30b of local stocks. “Investors worry that the latest show of central bank determination to tame inflation will slow economies rapidly,” HDFC Securities analyst Deepak Jasani wrote in a note.  Fourteen of the 19 sector sub-gauges compiled by BSE Ltd. fell Thursday, with metal stocks leading the plunge. The expiry of monthly derivative contracts also weighed on markets. For the June quarter, metal stocks were the worst performers, dropping 31% while information technology gauge fell 22%. Automakers led the three advancing sectors with 11.3% gain.

Australian stocks also tumbled, with the S&P/ASX 200 index falling 2% to close at 6,568.10, weighed down by losses in mining, utilities and energy stocks.  In New Zealand, the S&P/NZX 50 index fell 0.8% to 10,868.70

In rates, treasuries advanced, led by the belly of the curve. German bonds surged, led by the short-end and outperforming Treasuries. US yields richer by as much as 5.4bp across front-end and belly of the curve which outperforms, steepening 2s10s, 5s30s by 2bp and 2.8bp; wider bull-steepening move in progress for German curve with yields richer by up to 13.5bp across front-end with 2s10s wider by 3.5bp on the day. US 10-year yields around 3.055%, richer by 3.5bp. Money markets aggressively trimmed ECB tightening bets on relief that French June inflation didn’t come in above the median estimate. Bonds also benefitted from haven buying as stocks slide. Month-end extension flows may continue to support long-end of the Treasuries curve. bunds outperform by 7bp in the sector. IG issuance slate empty so far; Celanese Corp. pushed back plans to issue in euros and dollars, most likely to next week, after deals struggled earlier this week. Focal points of US session include PCE deflator and MNI Chicago PMI. 

In FX, the Bloomberg Dollar Spot Index was steady as the greenback traded mixed against its Group-of-10 peers. The yen advanced and Antipodean currencies were steady against the greenback. French inflation quickened to the fastest since the euro was introduced. Steeper increases in energy and food costs drove consumer-price growth to 6.5% in June from 5.8% in May . Sweden’s krona swung to a loss. It briefly advanced earlier after the Riksbank raised its policy rate by 50bps, as expected, signaled faster rate hikes and a quicker trimming of the balance sheet. The pound rose, snapping three days of losses against the dollar. UK household incomes are on their longest downward trend on record, as the nation’s cost of living crisis saps the spending power of British households. Separate figures showed that the current-account deficit widened sharply to £51.7 billion ($63 billion) in the first quarter. The yen rose and the Japan’s bonds inched up. The BOJ kept the amount and frequencies of planned bond purchases unchanged in the July-September period. The Australian dollar reversed a loss after data showed China’s official manufacturing purchasing managers index rose above 50 for the first time since February in a sign of improvement in the world’s second largest economy.

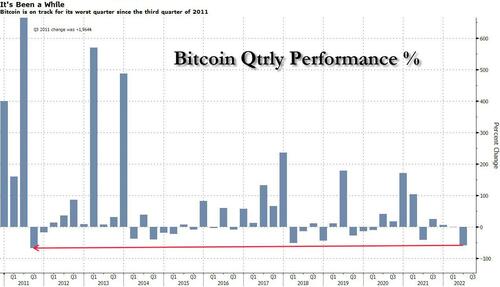
Bitcoin is on track for its worst quarter in more than a decade, as more hawkish central banks and a string of high-profile crypto blowups hammer sentiment. The 58% drawdown in the biggest cryptocurrency is the largest since the third quarter of 2011, when Bitcoin was still in its infancy, data compiled by Bloomberg show.

In commodities, WTI trades a narrow range, holding below $110. Brent trades either side of $116. Most base metals trade in the red; LME zinc falls 3.1%, underperforming peers. Spot gold falls roughly $3 to trade near $1,814/oz. Bitcoin slumps over 6% before finding support near $19,000.

Looking to the day ahead now, data releases include German retail sales for May and unemployment for June, French CPI for June, the Euro Area unemployment rate for May, Canadian GDP for April, whilst the US has personal income and personal spending for May, the weekly initial jobless claims, and the MNI Chicago PMI for June.

Market Snapshot

  • S&P 500 futures down 1.2% to 3,775.75
  • STOXX Europe 600 down 1.8% to 406.18
  • MXAP down 1.0% to 158.01
  • MXAPJ down 1.1% to 524.78
  • Nikkei down 1.5% to 26,393.04
  • Topix down 1.2% to 1,870.82
  • Hang Seng Index down 0.6% to 21,859.79
  • Shanghai Composite up 1.1% to 3,398.62
  • Sensex up 0.2% to 53,136.59
  • Australia S&P/ASX 200 down 2.0% to 6,568.06
  • Kospi down 1.9% to 2,332.64
  • Gold spot down 0.2% to $1,814.91
  • US Dollar Index little changed at 105.04
  • German 10Y yield little changed at 1.42%
  • Euro little changed at $1.0443
  • Brent Futures down 0.4% to $115.85/bbl

Top Overnight News from Bloomberg

  • The surge in the dollar has set Asian currencies on course for their worst quarter since the 1997 financial crisis and created a dilemma for central bankers
  • French Finance Minister Bruno Le Maire said the EU can deliver the global minimum corporate tax with or without the support of Hungary, circumventing Budapest’s veto earlier this month just as the bloc was on the brink of a agreement
  • German unemployment unexpectedly rose, snapping 15 straight months of decline as refugees from the war in Ukraine were included in those searching for work
  • The SNB bought foreign exchange worth 5.7 billion francs ($5.96 billion) in the first quarter of 2022 as the franc sharply appreciated against the euro and briefly touched parity in March
  • The ECB plans to ask the region’s lenders to factor in the economic hit of a potential cut off of Russian gas when considering payouts to shareholders
  • European stocks were poised for their biggest drop in any half-year period since 2008, as investors focused on the prospects for economic slowdown and stubbornly high inflation in the region
  • New Zealand will enter a recession next year that could be deeper than expected, Bank of New Zealand economists said after a survey showed business sentiment continues to slump

A more detailed look at global markets courtesy of Newsquawk

Asia-Pac stocks were varied at month-end amid a slew of data releases including mixed Chinese PMIs. ASX 200 was dragged lower by weakness in energy, miners and the top-weighted financials sector. Nikkei 225 declined after disappointing Industrial Production data and with Tokyo raising its virus infection level. Hang Seng and Shanghai Comp. were somewhat mixed with Hong Kong indecisive and the mainland underpinned after the latest Chinese PMI data in which Manufacturing PMI printed below estimates but Non-Manufacturing PMI firmly surpassed forecasts and along with Composite PMI, all returned to expansion territory.

Top Asian News

  • NATO Secretary General Stoltenberg said China’s growing assertiveness has consequences for the security of allies, while he added China is not our adversary, but we must be clear-eyed about the serious challenges it presents.
  • US blacklisted 5 Chinese firms for allegedly helping Russia in which Connec Electronic, King Pai Technology, Sinno Electronics, Winnine Electronic and World Jetta Logistics were added to the entity list which restricts access to US technology, according to WSJ.
  • Japan’s government cut its assessment of industrial production and noted that production is weakening, while it stated that Japan’s motor vehicle production declined 8% M/M and that industrial production likely saw the largest impact of Shanghai’s COVID-19 lockdown in May, according to Reuters.
  • Tokyo metropolitan government will reportedly increase COVID infections level to the second-highest, according to FNN.

It’s been a downbeat session for global equities thus far as sentiment deteriorates further. European bourses are lower across the board, with losses extending during early European hours. European sectors are all in the red but portray a clear defensive bias. Stateside, US equity futures have succumbed to the glum mood, with the NQ narrowly underperforming.

Top European News

  • Riksbank hiked its Rate by 50bps to 0.75% as expected, and said the rate will be raised further and it will be close to 2% at the start of 2023. Bank said the balance sheet its to shrink faster than previously flagged, and suggested that policy rate will increase faster if needed. Click here for details.
  • Riksbank’s Ingves said inflation over forecast probably not enough for Riksbank to hold extra policy meeting in summer. Ingves added that if the situation requires a 75bps hike, then Riksbank will carry out a 75bps hike.
  • Orsted Gains as HSBC Upgrades With Shares Seen ‘Good Value’
  • Aston Martin Extends Losses as Carmaker Reportedly Seeking Funds
  • Climate Litigants Look Beyond Big Oil for Their Day in Court
  • Ukraine Latest: Putin Warns NATO on Moving Military to Nordics

FX

  • DXY extends on gains above 105.00, but could see more upside on safe haven demand and residual rebalancing flows over fixes – EUR/USD inches towards 1.0400 to the downside.
  • Yen regroups as yields drop and risk sentiment deteriorates to compound corrective price action.
  • Franc unwinds some of its recent outperformance and Loonie lose traction from oil ahead of Canadian GDP.
  • Swedish Crown unable to take advantage of hawkish Riksbank hike in face of risk aversion – Eur/Sek stuck in a rut close to 10.7000.
  • Pound finds some underlying bids into 1.2100 and Kiwi at 0.6200, while Aussie holds above 0.6850 with encouragement from China’s services PMI that also propped the Yuan.

Fixed Income

  • Bonds on bull run into month, quarter and half year end – Bunds top 148.00 at best, Gilts approach 113.50 and 10 year T-note just a tick away from 118-00.
  • Debt in demand on safe haven grounds rather than duration as curves steepen on less hawkish/more dovish market pricing.
  • Italian supply comfortably covered to keep BTP futures propped ahead of US PCE data and yet another speech from ECB President Lagarde.

Commodities

  • WTI and Brent front-month futures are resilient to the broader risk downturn, and firmer Dollar as OPEC+ member members gear up for what is expected to be a smooth meeting.
  • Spot gold is uneventful but dipped under yesterday’s low, with potential support at the 15th June low at USD 1,806.59/oz.
  • Base metals are softer across the board amid the broader risk profile. Dalian and Singapore iron ore futures were on track for quarterly losses.
  • Ship with 7,000 tonnes of grain leaves Ukraine port, according to pro-Russia officials cited by AFP.

US Event Calendar

  • 08:30: June Initial Jobless Claims, est. 229,000, prior 229,000
  • 08:30: June Continuing Claims, est. 1.32m, prior 1.32m
  • 08:30: May Personal Income, est. 0.5%, prior 0.4%
  • 08:30: May Personal Spending, est. 0.4%, prior 0.9%
  • 08:30: May Real Personal Spending, est. -0.3%, prior 0.7%
  • 08:30: May PCE Deflator MoM, est. 0.7%, prior 0.2%
  • 08:30: May PCE Deflator YoY, est. 6.4%, prior 6.3%
  • 08:30: May PCE Core Deflator YoY, est. 4.8%, prior 4.9%
  • 08:30: May PCE Core Deflator MoM, est. 0.4%, prior 0.3%
  • 09:45: June MNI Chicago PMI, est. 58.0, prior 60.3

DB’s Jim Reid concludes the overnight wrap

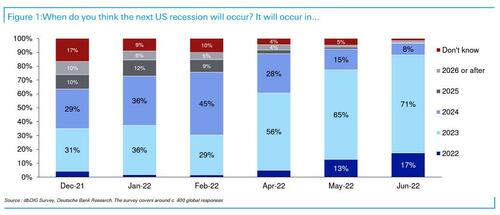
We’ve just released the results of our monthly EMR survey that we conducted at the start of the week. It makes for some interesting reading, and we’re now at the point where 90% of respondents are expecting a US recession by end-2023, which is up from just 35% in our December survey. That echoes our own economists’ view that we’re going to get a recession in H2 2023, and just shows how sentiment has shifted since the start of the year as central banks have begun hiking rates. When it comes to people’s views on where markets are headed next, most are expecting many of the themes from H1 to continue, with a 72% majority thinking that the S&P 500 is more likely to fall to 3,300 rather than rally to 4,500 from current levels, whilst 60% think that Treasury yields will hit 5% first rather than 1%. Click here to see the full results.

When it comes to negative sentiment we’ll have to see what today brings us as we round out the first half of the year, but if everything remains unchanged today we’re currently set to end H1 with the S&P 500 off to its worst H1 since 1970 in total return terms. And there’s been little respite from bonds either, with US Treasuries now down by -9.79% since the start of the year, so it’s been bad news for traditional 60/40 type portfolios. Ultimately, a large reason for that has been investors’ fears that ongoing rate hikes to deal with inflation will end up leading to a recession, and yesterday saw a continuation of that theme, with Fed Chair Powell, ECB President Lagarde and BoE Governor Bailey all reiterating their intentions in a panel at the ECB’s Forum to return inflation back to target.

In terms of that panel, there weren’t any major headlines on policy we weren’t already aware of, although there was a collective acknowledgement of the risk that inflation could become entrenched over time and the need to deal with that. Fed Chair Powell described the US economy as in “strong shape”, but one that ultimately requires much tighter financial conditions to bring inflation back to target. Year-end fed funds expectations remained steady in response, down just -0.7bps to 3.45%. However, further out the curve the simmering slower growth narrative continued to grip markets and sent 10yr Treasury yields -8.2bps lower to 3.09%, and the 2s10s another -1.1bps flatter to 4.7bps. In line with a tighter Fed policy path and slower growth, 10yr breakevens drove the move in nominal yields, falling -8.2bps to 2.39%, their lowest levels since January, having entirely erased the gains seen after Russia’s invasion of Ukraine, when it peaked above 3% at one point in April. Along with 2s10s flattening, the Fed’s preferred measure of the near-term risk of recession, the forward spread (the 18m3m – 3m), similarly flattened by -5.7bps, hitting its lowest level in nearly four months at 154bps. And thismorning there’s only been a partial reversal of these trends, with 10yr Treasury yields (+1.3bps) edging back up to 3.10% as we go to press. Over in equities, the S&P 500 bounced around but finished off of its intraday lows with just a -0.07% decline, again with the macro view likely skewed by quarter-end rebalancing of portfolios. The NASDAQ was similarly little changed on the day, falling a mere -0.03%.

In terms of the ECB, President Lagarde said on that same panel that she didn’t think “we are going back to that environment of low inflation” that was present before the pandemic. But when it came to the actual data yesterday there was a pretty divergent picture. On the one hand, Spain’s CPI for June surprised significantly on the upside, with the annual inflation rising to +10.0% (vs. +8.7% expected) on the EU’s harmonised measure. But on the other, the report from Germany then surprised some way beneath expectations, coming in at +8.2% on the EU-harmonised measure (vs. +8.8% expected). So mixed messages ahead of the flash CPI print for the entire Euro Area tomorrow.

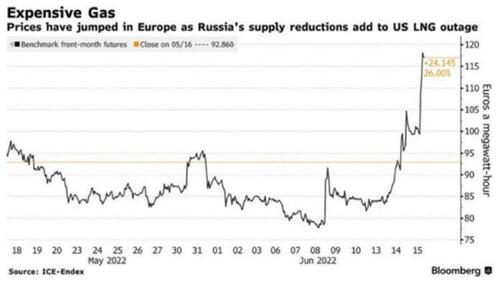
As in the US, there was a significant rally in European sovereign bonds, with yields on 10yr bunds (-10.7bps), OATs (-10.7bps) and BTPs (-16.0bps) all moving lower on the day. Equities also lost significant ground amidst the risk-off tone, and the STOXX 600 shed -0.67% as it caught up with the US losses from the previous session. That risk-off tone was witnessed in credit as well, where iTraxx Crossover widened +21.5bps to a post-pandemic high. At the same time, there were further concerns in Europe on the energy side, with natural gas futures up by +8.06% to a three-month high of €139 per megawatt-hour, which follows a reduction in capacity yesterday at Norway’s Martin Linge field because of a compressor failure.

Whilst monetary policy has been the main focus for markets lately, we did get some headlines on the fiscal side yesterday too, with a report from Bloomberg that Senate Democrats were working on an economic package that had smaller tax increases in order to reach a deal with moderate Democratic senator Joe Manchin. For reference, the Democrats only have a majority in the split 50-50 senate thanks to Vice President Harris’ tie-breaking vote, so they need every Democrat Senator on board in order to pass legislation. According to the report, the plan would be worth around $1 trillion, with half allocated to new spending, and the other half cutting the deficit by $500bn over the next decade.

Overnight in Asia we’ve seen a mixed market performance overnight. Most indices are trading lower, including the Nikkei (-1.45%) and the Kospi (-0.81%), but Chinese equities have put in a stronger performance after an improvement in China’s PMIs in June, and the CSI 300 (+1.62%) and the Shanghai Comp (+1.31%) have both risen. That came as manufacturing activity expanded for the first time in four months, with the PMI up to 50.2 in June (vs. 50.5 expected) from 49.6 in May. At the same time, the non-manufacturing climbed to 54.7 points in June, up from 47.8 in May, which also marked the first time it’d been above the 50 mark since February.

Nevertheless, that positivity among Chinese equities are proving the exception, with equity futures in the US and Europe pointing lower, with those on the S&P 500 (-0.28%) looking forward to a 4th consecutive daily decline as concerns about a recession persist.

When it came to other data yesterday, the third estimate of US GDP for Q1 saw growth revised down to an annualised contraction of -1.6% (vs. -1.5% second estimate). Separately, the Euro Area’s M3 money supply grew by +5.6% year-on-year in May (vs. +5.8% expected), which is the slowest pace since February 2020.

To the day ahead now, data releases include German retail sales for May and unemployment for June, French CPI for June, the Euro Area unemployment rate for May, Canadian GDP for April, whilst the US has personal income and personal spending for May, the weekly initial jobless claims, and the MNI Chicago PMI for June.

Tyler Durden
Thu, 06/30/2022 – 07:58

via ZeroHedge News https://ift.tt/JIsn8e9 Tyler Durden
State of the Fifth Circuit Address

Recently, the Jackson, Mississippi Federalist Society Chapter invited me to deliver an address on the state of the Fifth Circuit. That invitation was occasioned by several posts I’ve written about how the judges on the Fifth Circuit often divide in unexpected ways. To prepare this address, I focused on opions from the the en banc court over the past four years. More precisely, I focused on how the Republican-appointed judges vote on the en banc court. As present, twelve of the seventeen active judges are Reagan, Bush 43, and Trump nominees.

You can watch the lecture here. And I’ve uploaded the slides here. After the jump, I will highlight some of my findings.

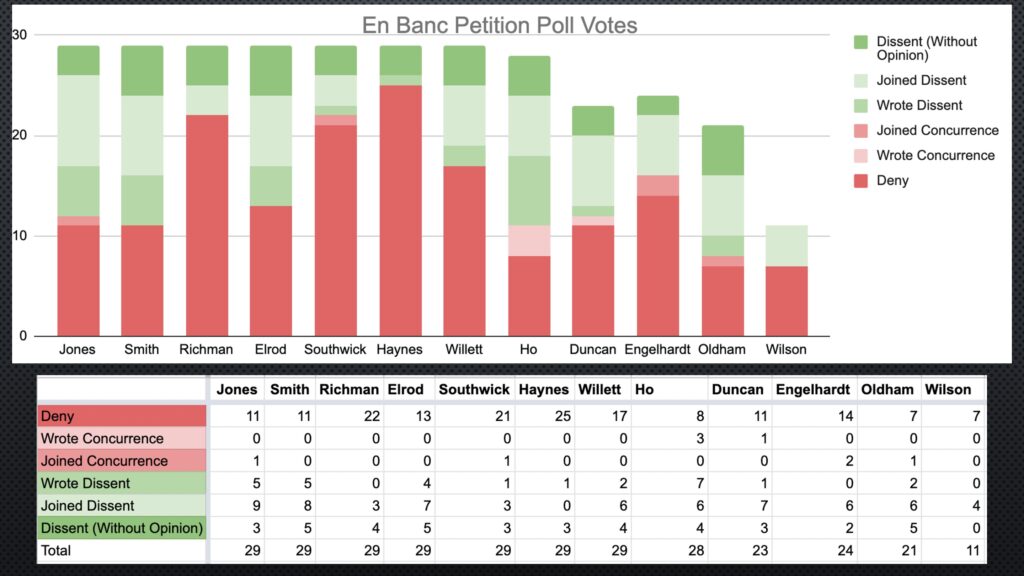
First, I studied petitions for rehearing en banc that were denied with at least one dissent from denial. Between 2018 and 2022, I counted approximately 29 such cases. I say approximately, because it is difficult to get a precise count. The Fifth Circuit does not publish on its website all en banc polls with dissents. These orders are not always indexed on WestLaw or Lexis. The only way to find them is on PACER, which of course does not permit search. One such case is Louisiana v. Becerra, the vaccine mandate case that went to the Supreme Court. The Supreme Court is often criticized for having a “shadow docket.” The term is misleading, because all of the Supreme Court’s orders are readily available on its website. Nothing is in the shadows. By contrast, the Fifth Circuit actually has a shadow docket with opinions that are hidden. The Fifth Circuit, and all courts, should post all of its en banc polls–or at least those with at least one dissent.

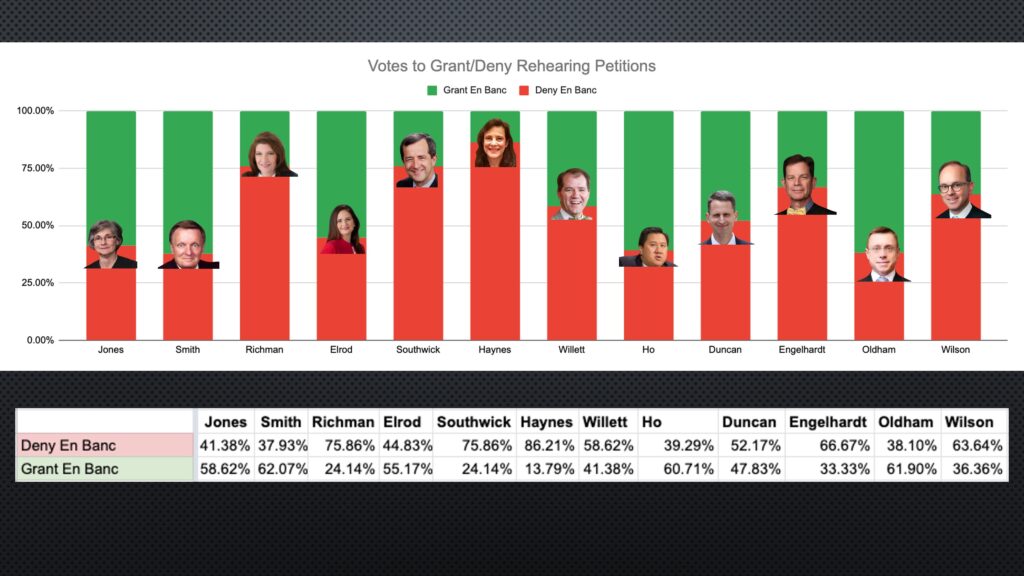
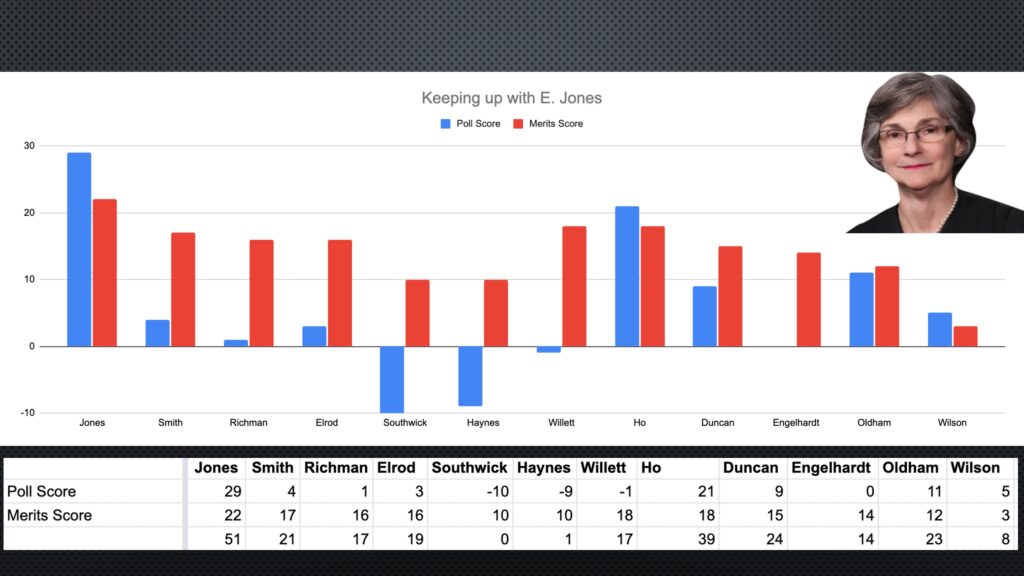
This figure tracks how each of the Republican-appointed judges voted on the 29 en banc petition polls.

This figure simplifies the numbers, and shows how often each judge was willing to go en banc. On the current court, Judge Smith was the judge who most often voted for en banc review, followed by Judges Oldham, Ho, Jones, and Elrod.

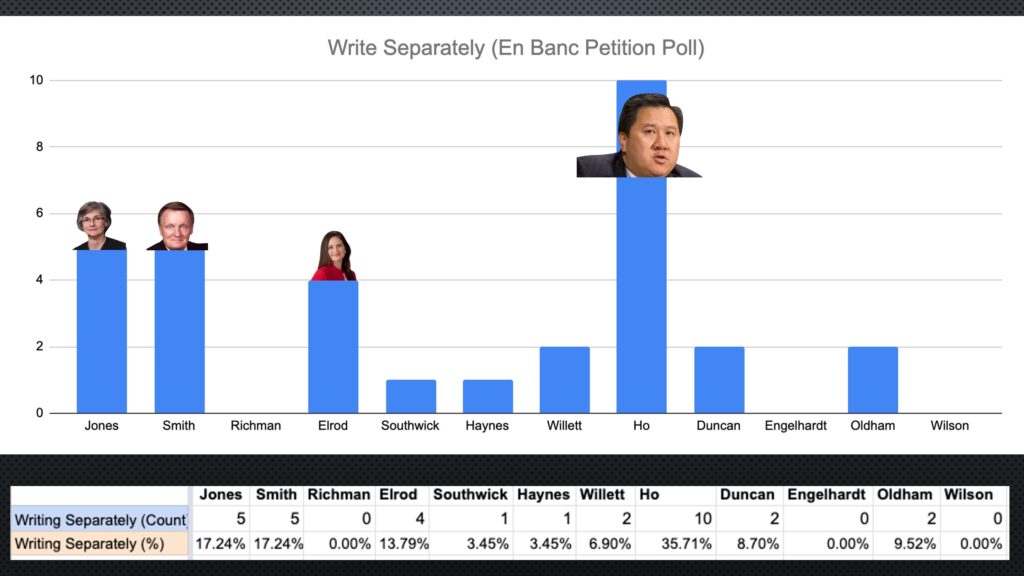
Next, I looked at how often judges wrote a separate writing at the petition phase. Judge Ho, far and away, has the most separate writings. Judges Jones, Smith, and Elrod round out the pack.

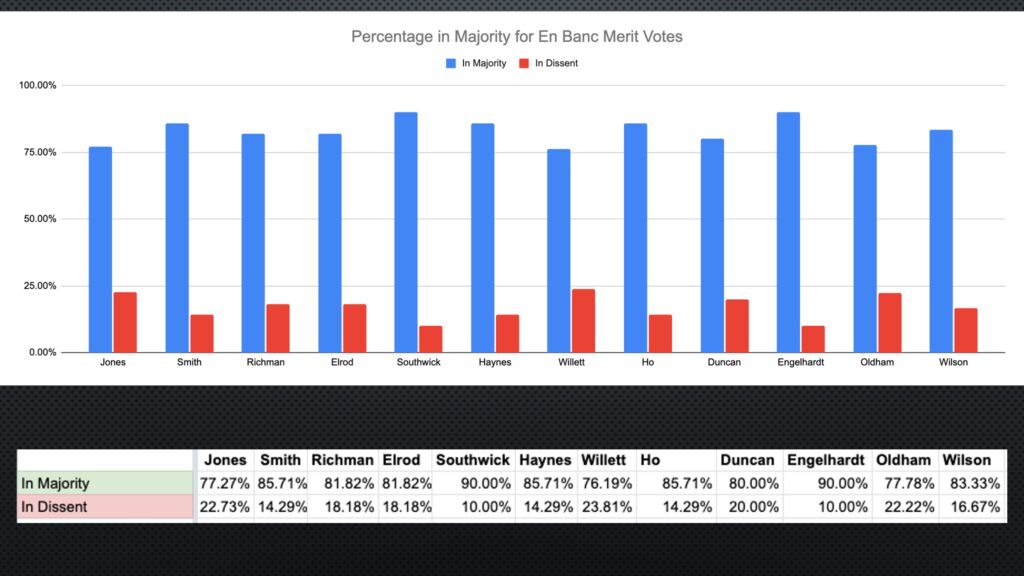
While the judges are fairly divided at the petition stage, there is fairly broad agreement when cases are heard on the merits. All of the Republican-appointed judges are in the majority more than 75% of the time. The judges in the majority the most are Judges Southwick and Engelhardt. And the judge who is in the majority the least is Judge Jones. (More on Judges Jones later.)

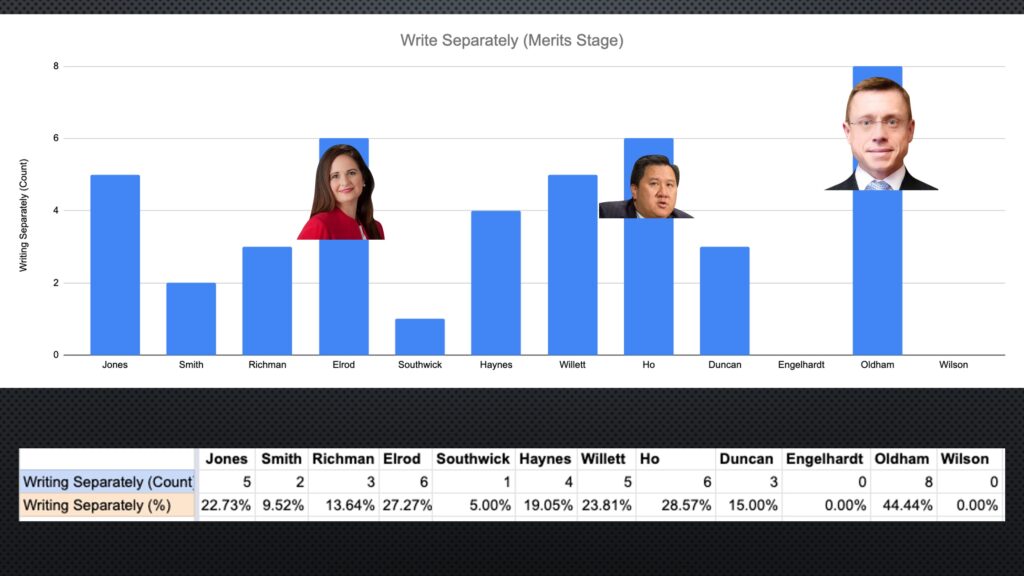
At the merits stage, Judge Oldham is the most prolific separate writer, followed by Judges Elrod and Ho.

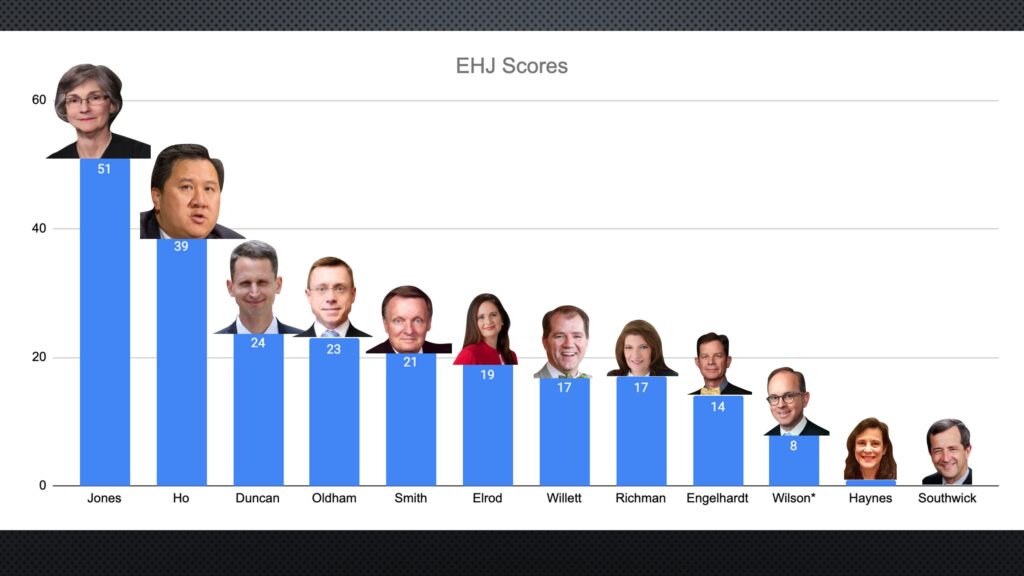
Next, I tried to assess the ideology of the Fifth Circuit judges. I was inspired by the Martin-Quinn scores. When a new member joins the Supreme Court, they are assigned a Martin-Quinn score based, in part, on the Justice they most closely resemble. For example, Justice (in waiting) Ketanji Brown Jackson would probably be most similar to Justice Sotomayor. I tried something similar, though far less scientific. I call it the EHJ score. I measured how close each Republican-appointed judge was to the most conservative member of the court–Judge Edith H. Jones. Every time a judge voted with Judge Jones on the en banc court, I added one point. Every time a judge voted against Judge Jones on the en banc court, I subtracted one point. These totaled points yield the EHJ scores. I don’t pretend these numbers are indicative of much. But it does provide a baseline to assess how the conservative members of the Court line up.

Here are the EHJ scores at the petition and merit phases:

Finally, I plotted the judges based on their EHJ scores. The judges closest to Judge Jones are Judges Ho, Duncan, and Oldham.

Still, I temper how useful these ratings are. My presentation demonstrates that conservative judges can, in good faith, disagree. I focus on a few such cases. Consider Hewitt v. Helix Energy Solutions. This dispute turned on the interpretation of the FLSA. Judge Ho wrote the majority opinion, which was joined by Judges Smith, Stewart, Haynes, Graves, Higginson, Costa, Willett, Duncan, Engelhardt, Oldham, and Wilson. Judge Jones wrote the dissent, which was joined by Chief Judge Owen (now Richman), and Judges Weiner, Elrod, and Southwick. Both opinions purport to be textualist. But only one can be right. The Supreme Court has granted cert in this case.

Another divided case was Oliver v. Arnold. Here, a teacher required his students to transcribe the pledge of allegiance and listen to “Born in the USA” by Bruce Springsteen. A student refused. The teacher then reprimanded the student, and gave her a zero on the assignment. The student sued the teacher for violating the First Amendment. The panel allowed a 1983 suit to proceed. The en banc court denied review by a vote of 10-7. Who voted to deny review? Judges Ho and Willett, among others. Who voted against review? Judges Jones, Smith, Elrod, Duncan, Engelhardt, Oldham, and Wilson. This case exposes fractures of how conservatives view free speech and educational policy.

There is also Sambrano v. United Airlines, a vaccine mandate case. Judge Smith’s dissent excoriated a majority opinion by Judges Elrod and Oldham.  I trust the Good Ship Fifth Circuit is no longer aflame.

These cases demonstrate the the Fifth Circuit is not monolithically conservative. Like on the Supreme Court, even judges of similar stripes can draw very different lines.

I hope to deliver this address in other cities throughout the Fifth Circuit. And if things go to plan, I can update the presentation each year.

The post State of the Fifth Circuit Address appeared first on Reason.com.

from Latest https://ift.tt/4gmMvKP
via IFTTT

The 2022 Market Disaster… More Pain To Come

The 2022 Market Disaster… More Pain To Come

Authored by Matthew Piepenburg via GoldSwitzerland.com,

If you think the current market disaster hurts; it’s gonna get worse despite recent dead cat bounces in U.S. equities.

The Big 4: Dead Bonds, Rising Yields, Tanking Stocks & Stagflation

For well over a year before fantasy-pushers and politicized, central-bank mouth pieces like Powell and Yellen were preaching “transitory inflation,” or hinting that “we may never see another financial crisis in our lifetime,” we’ve been patiently and bluntly (rather than “gloomily”) warning investors of the “Big Four.”

That is, we saw an: 1) inevitable liquidity crisis which would take our 2) zombie bond markets to the floor, yields (and hence interest rates) to new highs and 3) debt-soaked nations and markets tanking dangerously south into 4) the dark days of stagflation.

In short, by calmly tracking empirical data and cyclical debt patterns, one does not have to be a market timer, tarot-reader or broken watch of “doom and gloom” to warn of an unavoidable credit, equity, inflation and currency crisis, all of which lead to levels of increasing political and social crisis and ultimately extreme control from the top down.

Such are the currents of history and the tides/fates of broke(n) regimes.

And that is precisely where we are today—no longer warning of a pending convergence of crises, but already well into a market disaster within the worst macro-economic setting (compliments of cornered “central planners”) that I have ever experienced in my post-dot.com career.

But sadly, and I do mean sadly, the worst is yet to come.

As always, facts rather than sensationalism confirm such hard conclusions, and hence we turn now to some equally hard facts behind this market disaster.

The Ignored Hangover

For well over a decade, the post-2008 central bankers of the world have been selling the intoxicating elixir (i.e., lie) that a debt crisis can be solved with more debt, which is then paid for with mouse-click money.

Investors drank this elixir with abandon as markets ripped to unprecedented highs on an inflationary wave of money printed out of thin air by a central bank near you.

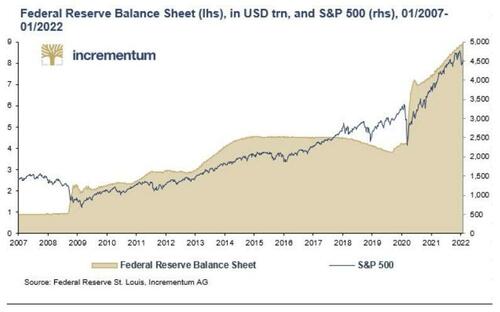
In case you still don’t know what such “correlation” looks like, see below:

But as we’ve warned in interview after interview and report after report, the only thing mouse-click money does is make markets drunker rather than immune from a fatal hangover and market disaster.

For years, such free money from the global central banks ($35T and counting) has merely postponed rather than outlawed the hangover, but as we are seeing below, the hangover, and puking, has already begun in a stock, credit or currency market disaster near you.

Why?

Every Market Crisis is a Liquidity Crisis

Because the money (i.e., “liquidity”) that makes this drunken fantasy go round is drying up (or “tightening”) as the debt levels are piling up.

That is, years and years of issuing IOU’s (i.e., sovereign bonds) has made those IOU’s less attractive, and the solution-myth of creating money out of thin air to pay for those IOUs is becoming less believable as inflation rises like a killer shark from beneath the feet of our money printers.

The Most Important Bond in the World Has Lost Its Shine

As we’ve warned, the UST is experiencing a liquidity problem.

Demand for Uncle Sam’s bar tab (IOU’s) is tanking month, after month, after month.

As a result, the price of those bonds is falling and hence their yields (and our interest rates) are rising, creating massive levels of pain in an already debt-saturated world where rising rates kill drunken credit parties (i.e., markets).

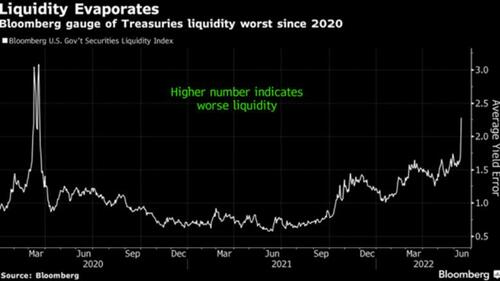
Toward this end, Wall Street is seeing a dangerous rise in what the fancy lads call “omit days,” which basically means days wherein inter-dealer liquidity for UST’s is simply not available.

Such omit days are screaming signs of “uh-oh” which go un-noticed by 99.99% of the consensus-think financial advisors selling traditional stocks and bonds for a fee.

As the repo warnings (as well as our written warnings) have made clear since September of 2019, when liquidity in the credit markets tightens, the entire risk asset bubble (stocks, bonds and property) starts to cough, wheeze and then choke to death.

Unfortunately, the extraordinary levels of global debt in general, and US public debt in particular, means there’s simply no way to avoid more choking to come

The Fed—Tightening into a Debt Crisis?

As all debt-soaked nations or regimes since the days of ancient Rome remind us , once debt levels exceed income levels by 100% or more, the only option left is to “inflate away” that debt by debasing (i.e., expanding/diluting) the currency—which is the very definition of inflation.

And that inflation is only just beginning…

Despite pretending to “control,” “allow” and then “combat” inflation, truth-challenged central bankers like Powell, Kuroda and Lagarde have therefore been actively seeking to create inflation and hence reduce their debt to GDP ratios below the fatal triple digit level.

Unfortunately for the central bankers in general and Powell in particular, this ploy has not worked, as the US public debt to GDP ratio continues to stare down the 120% barrel and the Fed now blindly follows a doomed policy of tightening into a debt crisis.

This can only mean higher costs of debt, which can only mean our already debt-soaked bond and stock markets have much further to go/tank.

Open & Obvious (i.e., Deadly) Bond Dysfunction

In sum, what we are seeing from DC to Brussels, Tokyo and beyond is now an open and obvious (rather than pending, theoretical or warned) bond dysfunction thanks to years of artificial bond “accommodation” (i.e., central-bank bond buying with mouse-click currencies).

As we recently warned, signals from that toxic waste dump (i.e., market sector) known as MBS (“Mortgage-Backed Securities”) provide more objective signs of this bond dysfunction (market disaster) playing out in real-time.

Earlier this month, as the CPI inflation scale went further (and predictably) up rather down, the MBS market went “no bid,” which just means no one wanted to buy those baskets of unloved bonds.

This lack of demand merely sends the yields (and hence rates) for all mortgages higher.

On June 10, the rates for 30-year fixed mortgages in the U.S. went from 5.5% to 6% overnight, signaling one of the many symptoms of a dying property bull as U.S. housing starts reached 13-month lows and building permits across the nation fell like dominoes.

Meanwhile, other warnings in the commercial bond market, from Investment Grade to Junk Bonds, serve as just more symptoms of a dysfunctional “no-income” (as opposed to “fixed income”) U.S. bond market.

And in case you haven’t noticed, the CDS (i.e., “insurance”) market for junk bonds is rising and rising.

Of course, central bankers like Powell will blame the inevitable death of this U.S. credit bubble on inflation caused by Putin alone rather than decades of central bank drunk driving and inflationary broad money supply expansion.

Pointing Fingers Rather than Looking in the Mirror

Powell is already confessing that a soft landing from the current inflation crisis is now “out of his hands” as energy prices skyrocket thanks to Putin.

There’s no denying the “Putin effect” on energy prices, but what’s astounding is that Powell, and other central bankers have forgotten to mention how fragile (i.e., bloated) Western financial systems became under his/their watch.

Decades of cramming rates to the floor and printing trillions from thin air has made the U.S. in particular, and the West in general, hyper-fragile; that is: Too weak to withstand pushback from less indebted bullies like Putin.

But as we warned almost from day 1 of the February sanctions against Russia, they were bound to back-fire big time and accelerate an unraveling inflationary disaster in the West.

The West & Japan: Overplaying the Sanction Hand

As we warned in February, Russia is squeezing the sanction-makers with greater pain than history-and-math-ignorant “statesmen” like Kamala Harris could ever grasp.

From here in Europe, Western politicians are beginning to wonder if following the U.S. lead (coercion?) in chest-puffing was a wise idea, as gas prices on the continent skyrocket.

In this backdrop of rising energy costs, Germany, whose PPI is already at 30%, has to be asking itself if it can afford tough-talk in the Ukraine as Putin threatens to cut further energy supplies.

In this cold reality, the geniuses at the ECB are realizing that the very “state of their European Union” is at increasing risk of dis-union as citizens from Italy to Austria bend under the weight of higher prices and falling income.

As of this writing, the openly nervous ECB is thus inventing clever plans/titles to “fight fragmentation” within the EU by, you guessed it: Printing more money out of thin air to control bond yields and cap borrowing costs.

Of course, such pre-warned and inevitable (as well as politicized) versions of yield curve controls (YCC) are themselves, just well…Inflationary.

Even outside the EU, the UK’s Prime Minister is discussing the idea of handing out free money to the bottom 30% of its population as a means to combat inflating prices, equally forgetting to recognize that such handouts are by their very nature just, well…Inflationary.

(By the way, such monetary policies are an open signal to short the Euro and GBP against the USD…)

Looking further east to that equally embarrassing state of the union in Japan, we see, as warned countless times, a tanking Yen out of a Japan that knows all too well the inflationary sickness that a non-stop money printer can create.

Like the UST, the Japanese JGB is as unloved as a pig in lipstick. Prices are falling and yields are rising.

As demand for Japanese IOU’s falls, yields and rates are rising, compelling more YCC (i.e., money printing) from the Bank of Japan as the now vicious (and well…inflationary) circle of printing more currencies to pay for more debt/IOUs spins/spirals fatally round and round.

By the way, and as part of our continued warning and theme of the slow process of de-dollarizationwhich the sanctions have only accelerated, it would not surprise us to see Japan making a similar “China-like” move to buy its Russian oil in its own currency rather than the USD.

Just saying…

Don’t Be (or buy) a Dip

As indicated above, trying to combat inflation with rate hikes is not only a joke, it creates a market disaster when a nation’s debt to GDP is at 120%.

To fight inflation, rates need be at a “neutral level,” (i.e., above inflation), and folks, that would mean 9% rates at the current 8%+ CPI level.

That aint gonna happen…

At $30T+ of government debt and rising, the Fed can NEVER use rising rates to fight inflation. End of story. The days of Volcker rate hikes (when public debt was $900B not $30T) are gone.

But the fickle Fed can raise rates high enough to kill a securities bubble and create “asset-bubble deflation,” which is precisely what we are seeing in real time, and this market disaster is only going to get worse.

In short, if you are buying this “dip,” you may want to think again.

As June trade tapes remind, the Dow dipped below 30000, and the S&P 500 reported an ominous 3666, already losing more than 20% despite remaining grossly over-valued as it slides officially into bear territory.

As for the NASDAQ’s -30% YTD loss, well, it’s embarrassing…

Many, of course, will buy this dip, as many forget the data, facts and traps of dead-cat bounces.

Toward this end, it’s worth reminding that 12 of the top 20 one-day rallies in the NASDAQ occurred after that market began a nearly 80% plunge between 2000 and 2003.

Similarly, the S&P saw 9 of its top 20 one-day rallies following the 1929 crash in which that market lost 86% from its highs.

In short: These bear markets are not even close to their bottom, and today’s dip-buy may just be a trap, unless you think you can time a one-day rally amidst years of falling assets.

Markets won’t and don’t recover from the bear’s claws until spikes are well above two standard deviations. We are not there yet, which means we have much further to fall.

Capitulation in U.S. stocks won’t even be a discussion until the DOW is below 28,400 and the S&P blow 3500. Over the course of this bear, I see both falling much further.

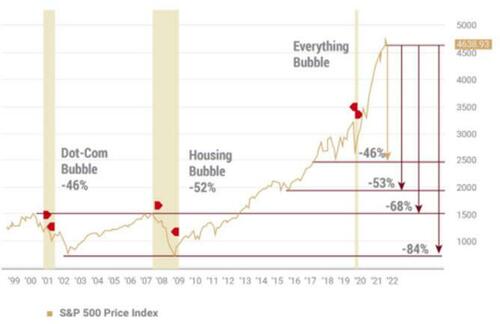
As we’ve warned, mean-reversion is a powerful force and we see deeper lows/reversions ahead:

Toward that end, we see an SPX which could easily fall at least 15% lower (i.e., to at least 1850) than the “Covid crash” of March 2020.

Based upon historic ranges, stocks won’t be anywhere near “fair value” until we see a Shiller PE at 16 or a nominal PE of 9-10.

Index bubbles have been driven by ETF inflation which followed the Fed liquidity binge—and those ETF’s will fall far faster in a market disaster than they grew in a Fed tailwind.

And if you still think meme stocks, alt coins or the Fed itself can save you from further market disaster, we’d (again) suggest you think otherwise.

Looking at historical data on prior crashes from 1968 to the present, the average bear crash is at around -33%.

Unfortunately, there’s nothing “average” about this bear or the further falls to come. The Shiller PE, for example, has another 40% to go (down) before stocks approach anything close to “fair value.”

In the 1970’s, for example, when we saw the S&P lose 48%, or even in 2008, when it lost 56%, U.S. debt to GDP levels were ¼ of what they are today. Furthermore, in the 1970’s the average consumer savings rate was 12%; today that rate is 4%.

Stated simply, the U.S., like the EU and Japan, is too debt-crippled and too GDP-broke to make this bear short and sweet. Instead, it will be long and mean, accompanied by stagflation and rising unemployment.

The Fed knows this, and is, in part, raising rates today so that will have something—anything—to cut in the market disaster tomorrow.

But that will be far too little, and far too late.

And, Gold…

Of course, the Fed, the IMF, the Davos crowd, the MSM and the chest-puffing sanction (back-firing) West will blame the current and future global market disaster on a virus with a 99% survival rate and an avoidable war in a corner of Europe that neither Biden nor Harris could find on a map.

Instead, and as most already know, the real cause of the greatest market bubble and bust in the history of modern capital markets lies in the reflection of central bankers and politicians who bought time, votes, market bubbles, wealth disparity and cancerous inflation with a mouse-click.

History reminds us of this, current facts confirm it.

For now, the Fed will tighten, and thereby unleash an even angrier bear.

Then, as we’ve warned, the Fed will likely pivot to more rate cuts and even more printed (inflationary) currencies as the US, the EU and Japan engage in more inflationary YCC and an inevitable as well as disorderly “re-set” already well telegraphed by the IMF.

In either/any scenario, gold gets the last laugh.

Gold, of course, has held its own even as rates and the USD have risen—typically classic gold headwinds. When markets tank and the Fed pivots, yields on the 10Y could fall as global growth weakens—thus providing a gold tailwind.

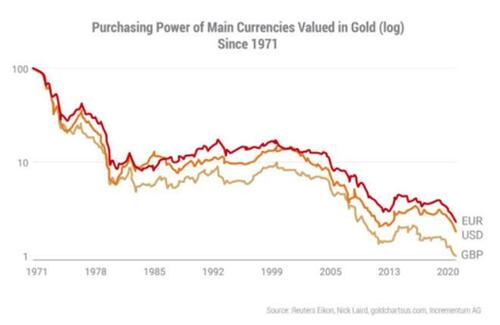
Furthermore, the USD’s days of relative strength are equally numbered, as is the current high demand for US T-Bill-backed collateral for that USD. As the slow trend toward de-dollarization increases, so will the tailwind and hence price of gold increase as the USD’s credibility decreases.

In the interim, the fact that gold has stayed strong despite the temporary spike in the USD speaks volumes.

In the interim, Gold outperforms tanking stocks by a median range of 45%, and when the inflationary pivot to more QE returns, gold protects longer-term investors from grotesquely (and increasingly) debased currencies.

And when (not if) the re-set toward CBDC (central bank digital currencies) finally arrives, that blockchain eYen and eDollar will need a linkage to a neutral commodity not to an empty “faith & trust” in just another new fiat/fantasy with an electronic profile.

As we’ve been saying for decades: Gold Matters.

Tyler Durden
Thu, 06/30/2022 – 07:20

via ZeroHedge News https://ift.tt/U2jBiQS Tyler Durden

Who’s Still Buying Fossil Fuels From Russia?

Who’s Still Buying Fossil Fuels From Russia?

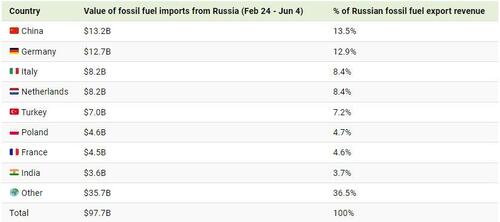
Despite looming sanctions and import bans, Russia exported $97.7 billion worth of fossil fuels in the first 100 days since its invasion of Ukraine, at an average of $977 million per day.

So, which fossil fuels are being exported by Russia, and who is importing these fuels?

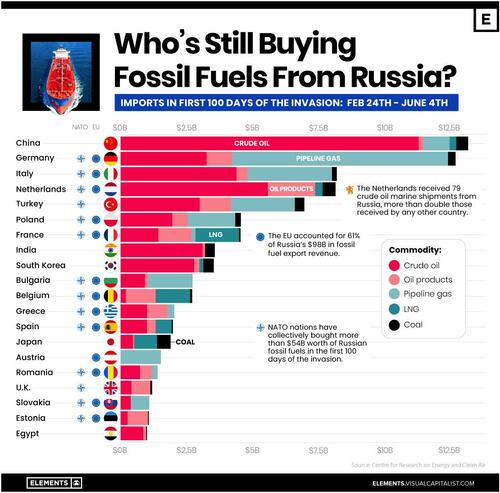
The infographic below, via Visual Capitalist’s Niccolo Conte and Govind Bhutada, tracks the biggest importers of Russia’s fossil fuel exports during the first 100 days of the war based on data from the Centre for Research on Energy and Clean Air (CREA).

In Demand: Russia’s Black Gold

The global energy market has seen several cyclical shocks over the last few years.

The gradual decline in upstream oil and gas investment followed by pandemic-induced production cuts led to a drop in supply, while people consumed more energy as economies reopened and winters got colder. Consequently, fossil fuel demand was rising even before Russia’s invasion of Ukraine, which exacerbated the market shock.

Russia is the third-largest producer and second-largest exporter of crude oil. In the 100 days since the invasion, oil was by far Russia’s most valuable fossil fuel export, accounting for $48 billion or roughly half of the total export revenue.


While Russian crude oil is shipped on tankers, a network of pipelines transports Russian gas to Europe. In fact, Russia accounts for 41% of all natural gas imports to the EU, and some countries are almost exclusively dependent on Russian gas. Of the $25 billion exported in pipeline gas, 85% went to the EU.

The Top Importers of Russian Fossil Fuels

The EU bloc accounted for 61% of Russia’s fossil fuel export revenue during the 100-day period.

Germany, Italy, and the Netherlands—members of both the EU and NATO—were among the largest importers, with only China surpassing them.


China overtook Germany as the largest importer, importing nearly 2 million barrels of discounted Russian oil per day in May—up 55% relative to a year ago. Similarly, Russia surpassed Saudi Arabia as China’s largest oil supplier.

The biggest increase in imports came from India, buying 18% of all Russian oil exports during the 100-day period. A significant amount of the oil that goes to India is re-exported as refined products to the U.S. and Europe, which are trying to become independent of Russian imports.

Reducing Reliance on Russia

In response to the invasion of Ukraine, several countries have taken strict action against Russia through sanctions on exports, including fossil fuels. 

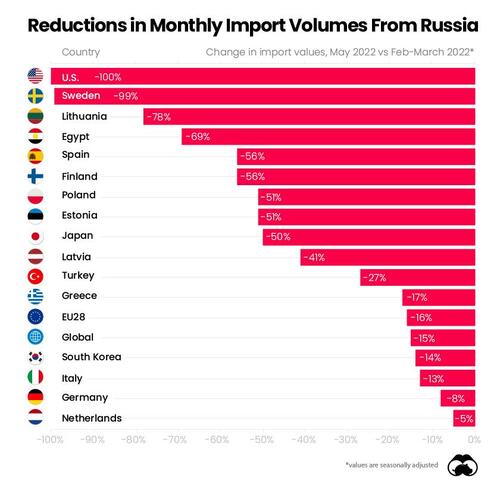
The U.S. and Sweden have banned Russian fossil fuel imports entirely, with monthly import volumes down 100% and 99% in May relative to when the invasion began, respectively.

On a global scale, monthly fossil fuel import volumes from Russia were down 15% in May, an indication of the negative political sentiment surrounding the country.

It’s also worth noting that several European countries, including some of the largest importers over the 100-day period, have cut back on Russian fossil fuels. Besides the EU’s collective decision to reduce dependence on Russia, some countries have also refused the country’s ruble payment scheme, leading to a drop in imports.

The import curtailment is likely to continue. The EU recently adopted a sixth sanction package against Russia, placing a complete ban on all Russian seaborne crude oil products. The ban, which covers 90% of the EU’s oil imports from Russia, will likely realize its full impact after a six-to-eight month period that permits the execution of existing contracts.

While the EU is phasing out Russian oil, several European countries are heavily reliant on Russian gas. A full-fledged boycott on Russia’s fossil fuels would also hurt the European economy—therefore, the phase-out will likely be gradual, and subject to the changing geopolitical environment.

Tyler Durden
Thu, 06/30/2022 – 06:55

via ZeroHedge News https://ift.tt/AHyU4PC Tyler Durden

Christopher Alexander’s Utopian Blueprint


topicsideas

Imagine a federation of independent regions. Each of its cities is a mosaic of distinctive, self-governing neighborhoods, where “people can choose the kind of subculture they wish to live in, and can still experience many ways of life different from their own.” Homes and workplaces sit side by side, and those workplaces are a mix of owner-operated businesses and self-managed workshops. Bureaucracy is minimal, and services are administered in small offices without red tape.

Children roam the city freely, and the playgrounds are filled with raw materials for kids to build with. Instead of compulsory schooling, there are voucher-funded “networks of learning”: freelance instructors, shopfront schools, apprenticeships, museums. Instead of conventional universities, there are scholarly marketplaces where anyone can offer classes to willing customers. The most important mode of public transportation is a jitney-style fleet of mini-buses. One part of town is a permanent carnival. There are public bandstands, so people can dance in the street.

It is one of the least sterile, most appealing utopian blueprints I have read—tucked away, improbably, in a book about architecture. The book is A Pattern Language, published in 1977. Six names appear on its cover, but the text is most closely associated with the first author listed: Christopher Alexander, who died in March at 85.

One thing that makes this vision so appealing is that it’s less interested in telling people how to live than in maximizing their ability to live the lives they want. But it’s still a blueprint, and at times it can’t help feeling prescriptive.

While Alexander’s thinking evolved over the course of his life, he consistently believed that good design principles are encoded in the world and waiting to be discovered. These universal patterns, he stressed, are broad principles, not rigid instructions: ideas that you can use “a million times over, without ever doing it the same way twice.”

A Pattern Language lists 253 of them. It begins at the most macro level, with those independent regions, then gradually narrows its way through ever-smaller social institutions before finally discussing individual buildings. By then, the utopian speculations have given way to practical advice on shaping a comfortable living space.

Much of this advice is great. Who could deny that “young children seek out cave-like spaces to get into and under,” and that a home with kids should accommodate that? Or that “cupboards that are too deep waste valuable space, and it always seems that what you want is behind something else”? (Alexander’s calls for a participatory construction process are similarly attentive to human-scale touches. His 1985 book The Production of Houses recommends a “barrel of beer at the end of every operation.”)

But then there’s pattern number 138: “Sleeping to the East.”

Don’t want the sun to wake you? You’re not alone: “This is one of the patterns people most often disagree with,” wrote Alexander and company. “However, we believe they are mistaken.” A healthy sleep cycle, they tell us, demands a solar waking.

Alexander’s books do not usually take a we-know-best tone. Their general spirit is anarchistic: In 1983, Nomos magazine even reprinted part of A Pattern Language under the headline “Libertarian Architecture.” As the Danish designer Per Galle once said, Alexander aimed to give nonarchitects “control over their physical environments (apparently leaving little or nothing for the professionals to do).” But if you’re sensitive to sunlight or fond of sleeping late on weekends, this insistence on eastern exposure will sound awfully imperious.

The social institutions in the book sometimes veer in that direction too, with the authors offering ideas about enacting their patterns through the law. Sometimes that just means striking down existing rules or building basic infrastructure in a way that facilitates free action. But other times, A Pattern Language issues commands. Do not merely allow city land and farmland to interlock; make sure those agricultural strips are only a mile wide. Don’t just avoid parking minimums; impose a parking maximum. Don’t let people live in buildings more than four stories tall. Suddenly, the man searching for Platonic forms is barking orders like a Platonic government.

Alexander isn’t the first thinker to get caught between the ideal of a grand system and the ideal of a spontaneous order. Fortunately, we don’t have to buy the whole blueprint. Give me those bandstands and networks of learning. But on Saturday morning, let me recline in a fifth-floor bedroom facing west.

The post Christopher Alexander's Utopian Blueprint appeared first on Reason.com.

from Latest https://ift.tt/cw917FV
via IFTTT

Prosecutors Say Prince Andrew ‘Next Target’ After Ghislaine Maxwell Sentenced To 20 Years

Prosecutors Say Prince Andrew ‘Next Target’ After Ghislaine Maxwell Sentenced To 20 Years

Authored by Steve Watson via Summit News,

Following the relatively light twenty year sentence Ghislaine Maxwell has received for sex trafficking underage girls for Jeffrey Epstein, prosecutors representing the victims have said that the ‘next target’ should be British Royal Prince Andrew.

The lawyers acting on behalf of those alleging abuse requested that the FBI continue investigating the Epstein case and look harder at Andrew and other individuals accused by the victims.

“Let’s hope they’re the next target,” Attorney Brad Edwards told reporters.

Edwards represented Virginia Roberts Giuffre, who settled a sex abuse civil lawsuit out of court with Andrew, the Duke of York.

Attorney Spencer Kuvin, representative of several other alleged victims of Epstein and Maxwell added “Obviously, Andrew is one of the targets they will be looking into. He should definitely be concerned, but if he did nothing wrong, then come forward and tell the full story to the FBI, not the media.”

Los Angeles lawyer Lisa Bloom, who is representing several other alleged victims said “We call upon the FBI to fully investigate Prince Andrew. Virginia Giuffre’s civil case should be just the beginning. Everyone associated with Epstein and Maxwell should be carefully investigated.”

Bloom previously told reporters that Prince Andrew “should be quaking in his boots.”

As we previously reported, the British public have expressed concerns that the money for Andrew’s pay off to Virginia Roberts Giuffre, which will likely run into the millions, will be siphoned from taxpayers.

The amount that Andrew will pay Giuffre, and a victims’ rights charity of her choice, has not been disclosed, however it is estimated to be in excess of £12 MILLION, and that won’t even include legal fees.

While not admitting any guilt in the case, a statement read in court noted that “Prince Andrew has never intended to malign Ms. Giuffre’s character, and he accepts that she has suffered both as an established victim of abuse and as a result of unfair public attacks.”

The settlement came just days before Andrew would have been made to undergo a deposition, and be questioned under oath by Giuffre’s lawyers, reported the New York Times.

No individuals other than Maxwell and Epstein have yet been named in court throughout the case.

Maxwell will likely serve her sentence at the Federal Correctional Institution in Danbury, Connecticut, a low security 1000-inmate facility about 55 miles from New York City. The prison is said to be like Disneyland compared to the facility Maxwell has resided for the past two years.

*  *  *

Brand new merch now available! Get it at https://www.pjwshop.com/

In the age of mass Silicon Valley censorship It is crucial that we stay in touch. We need you to sign up for our free newsletter here. Support our sponsor – Turbo Force – a supercharged boost of clean energy without the comedown. Also, we urgently need your financial support here.

Tyler Durden
Thu, 06/30/2022 – 06:30

via ZeroHedge News https://ift.tt/41uhiO6 Tyler Durden

Christopher Alexander’s Utopian Blueprint


topicsideas

Imagine a federation of independent regions. Each of its cities is a mosaic of distinctive, self-governing neighborhoods, where “people can choose the kind of subculture they wish to live in, and can still experience many ways of life different from their own.” Homes and workplaces sit side by side, and those workplaces are a mix of owner-operated businesses and self-managed workshops. Bureaucracy is minimal, and services are administered in small offices without red tape.

Children roam the city freely, and the playgrounds are filled with raw materials for kids to build with. Instead of compulsory schooling, there are voucher-funded “networks of learning”: freelance instructors, shopfront schools, apprenticeships, museums. Instead of conventional universities, there are scholarly marketplaces where anyone can offer classes to willing customers. The most important mode of public transportation is a jitney-style fleet of mini-buses. One part of town is a permanent carnival. There are public bandstands, so people can dance in the street.

It is one of the least sterile, most appealing utopian blueprints I have read—tucked away, improbably, in a book about architecture. The book is A Pattern Language, published in 1977. Six names appear on its cover, but the text is most closely associated with the first author listed: Christopher Alexander, who died in March at 85.

One thing that makes this vision so appealing is that it’s less interested in telling people how to live than in maximizing their ability to live the lives they want. But it’s still a blueprint, and at times it can’t help feeling prescriptive.

While Alexander’s thinking evolved over the course of his life, he consistently believed that good design principles are encoded in the world and waiting to be discovered. These universal patterns, he stressed, are broad principles, not rigid instructions: ideas that you can use “a million times over, without ever doing it the same way twice.”

A Pattern Language lists 253 of them. It begins at the most macro level, with those independent regions, then gradually narrows its way through ever-smaller social institutions before finally discussing individual buildings. By then, the utopian speculations have given way to practical advice on shaping a comfortable living space.

Much of this advice is great. Who could deny that “young children seek out cave-like spaces to get into and under,” and that a home with kids should accommodate that? Or that “cupboards that are too deep waste valuable space, and it always seems that what you want is behind something else”? (Alexander’s calls for a participatory construction process are similarly attentive to human-scale touches. His 1985 book The Production of Houses recommends a “barrel of beer at the end of every operation.”)

But then there’s pattern number 138: “Sleeping to the East.”

Don’t want the sun to wake you? You’re not alone: “This is one of the patterns people most often disagree with,” wrote Alexander and company. “However, we believe they are mistaken.” A healthy sleep cycle, they tell us, demands a solar waking.

Alexander’s books do not usually take a we-know-best tone. Their general spirit is anarchistic: In 1983, Nomos magazine even reprinted part of A Pattern Language under the headline “Libertarian Architecture.” As the Danish designer Per Galle once said, Alexander aimed to give nonarchitects “control over their physical environments (apparently leaving little or nothing for the professionals to do).” But if you’re sensitive to sunlight or fond of sleeping late on weekends, this insistence on eastern exposure will sound awfully imperious.

The social institutions in the book sometimes veer in that direction too, with the authors offering ideas about enacting their patterns through the law. Sometimes that just means striking down existing rules or building basic infrastructure in a way that facilitates free action. But other times, A Pattern Language issues commands. Do not merely allow city land and farmland to interlock; make sure those agricultural strips are only a mile wide. Don’t just avoid parking minimums; impose a parking maximum. Don’t let people live in buildings more than four stories tall. Suddenly, the man searching for Platonic forms is barking orders like a Platonic government.

Alexander isn’t the first thinker to get caught between the ideal of a grand system and the ideal of a spontaneous order. Fortunately, we don’t have to buy the whole blueprint. Give me those bandstands and networks of learning. But on Saturday morning, let me recline in a fifth-floor bedroom facing west.

The post Christopher Alexander's Utopian Blueprint appeared first on Reason.com.

from Latest https://ift.tt/cw917FV
via IFTTT