First-Time Homebuyers Are Absolutely Screwed Right Now

First-Time Homebuyers Are Absolutely Screwed Right Now

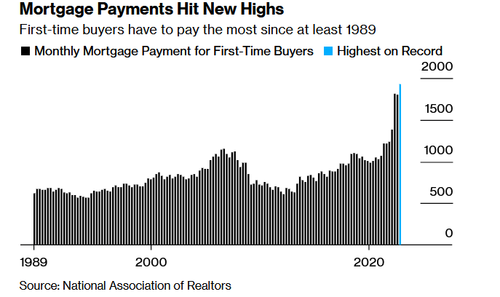
Despite a recent softening in the US housing market, a combination of rising borrowing costs and still-high prices have put prospective first-time homebuyers in a serious bind.

How times have changed…

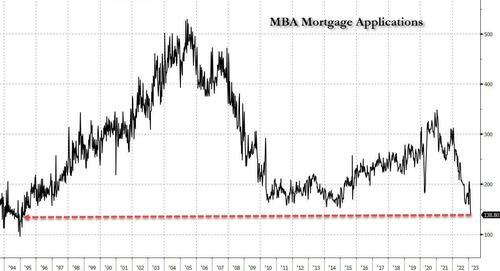
For the first time since records began, first-time homebuyers made up the smallest share of sales last year at 26%. And as we noted on Thursday, a surge in mortgage rates above 7% have sent homebuyer applications to a 28-year-low across all age groups.

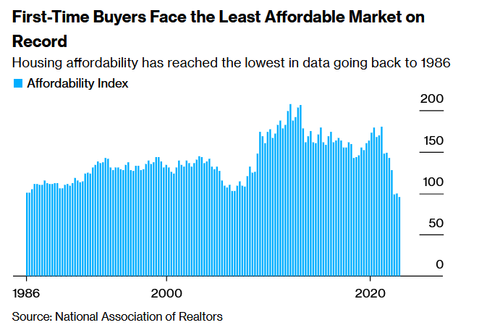
Now, as the spring homebuying season approaches, tight inventory and uncomfortably high interest rates mean that the American dream can only be achieved by those with high-paying jobs, lots of money, or rich parents, Bloomberg reports.

The average rate for a 30-year, fixed mortgage climbed for a fourth straight week, reaching 6.65%, Freddie Mac data released Thursday show.

The difficulties for first-time buyers have been escalating for years. During the pandemic boom, they were frequently squeezed out as they competed against people with cash and investors who frequently target starter homes. The typical household income for first-time buyers soared to as much as $90,000 in 2022 from about $70,000 in 2019. -Bloomberg

We’re far from affordability for the masses,” according to Zillow senior economist, Nicole Bachaud. “The scales are shifted toward homebuyers with higher incomes and a better financial background. This will be the norm until we get more inventory in the market.”

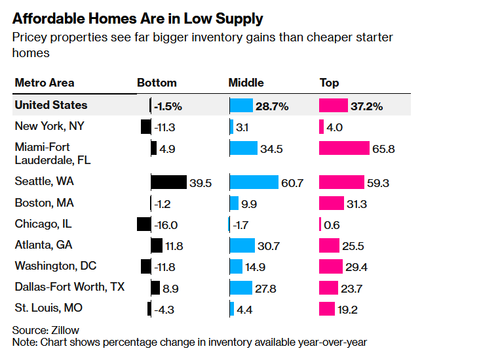
When mortgage rates hit 7% towards the end of 2022, Zillow predicted that it would take around 10 years for an individual saving 5% of the median household every month to set aside enough for a 10% down payment on a typical home (and are banks even taking 10% down?). What’s more, supply of entry-level housing remains tight, with the inventory of America’s cheapest properties down 1.5% in January vs. the same time last year, while supply for the most-expensive properties jumped 37%.

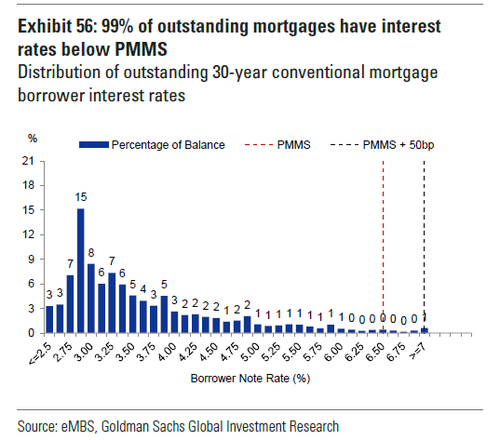
Also submitted for your consideration – 99% of outstanding mortgages have interest rates below the Primary Mortgage Market Survey. People bought and refinanced when rates were low, while new applications have essentially crashed as illustrated above.

Lowered expectations

Bloomberg highlights the plight of Rob and Kelsey Scott, a Seattle couple who have a combined income of $200,000, and were able to save $70,000 toward a down payment on a house. After the surge in mortgage rates, the Scotts had to lower their budget from $800,000. They ended up buying a two-bedroom house in a ‘quaint’ neighborhood for $700,000.

Rob and Kelsey Scott with cat child bought their first home in November

“If we compared ourselves to our parents who bought in their late 20s, we felt like we were behind. But if we look around today, we’re on track,” said 35-year-old Rob. “Where we were workwise as a couple is the only reason we’re in a house.”

Meanwhile, the median age of first-time buyers has jumped from 29 in 1981 to 36 in 2022, the oldest in the National Association of Realtors’ records – and is due to the fact that home prices have far outpaced wages, according to Zillow chief economist Skylar Olsen.

Rich kids win again

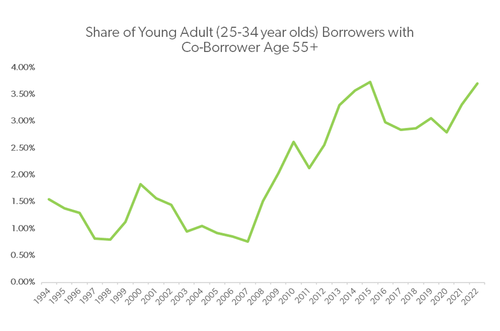
Even before the pandemic, around 1/3 of first-time homebuyers tapped rich parents or family members for a gift or loan to cover at least part of their down payment, Zillow’s Olson says. That increased to around 40% in 2021, while the percentage of young adult buyers with a co-borrower over the age of 55 has spiked since 2021, Freddic Mac reported.

Source: Freddie Mac

I don’t know how anyone could afford a home on their own at my age,” said Maddie Duleyrie, 29, who was only able to buy a condo in New York City thanks to help from her parents, despite being “fortunate to have a well-paying job.”

Kimberly Jay, the Duleyrie family’s real estate broker, said “I see some parents giving gifts for the full price of a million-dollar property.”

“This is a city with wealthy people.”

Even in Dallas, Texas, at least half of young first-time homebuyers are getting help from their families, according to real estate agent Connie Segovia, who says that most are receiving the entire minimum down payment from such sources.

Others simply have to make due with less.

Ashley Shipp-McGhee didn’t just want to buy her first house — she urgently needed more space after adopting her late aunt’s two children. The 39-year-old nurse started her search in December 2021 in the Illinois suburbs north of St. Louis, with a $260,000 budget.

Nearly one year and 30 houses viewed later, she finally landed a place for $256,000, a higher price than she had hoped.

She used an escalation clause to pay $1,000 over competing offers, waived the inspection and paid all the closing costs. She felt “uncomfortable” with her monthly mortgage payments after she was preapproved for 2.9% at the beginning of her hunt, only to close on the home at 6.4%. But she’s holding on to hope that she can refinance down the line if rates go down. -Bloomberg

Thanks to higher interest rates, a buyer purchasing a $400,000 home with 20% down on a 30-year fixed loan, the monthly payment, including principal and interest, is now roughly $230 a month more than it would have been a month ago. Compared with a year ago, when rates were in the 4% range, today’s monthly payment is about 50% higher, according to CNBC’s Diana Olick.

Good luck out there…

Tyler Durden
Sat, 03/04/2023 – 12:00

via ZeroHedge News https://ift.tt/ia4swZh Tyler Durden

Feinstein, Fetterman Hospitalizations May Mean Trouble For Democrats

Feinstein, Fetterman Hospitalizations May Mean Trouble For Democrats

Authored by Jack Phillips via The Epoch Times (emphasis ours),

Senate Democrats have little room for error after Sen. Dianne Feinstein (D-Calif.) announced she was hospitalized with shingles on Thursday and amid Sen. John Fetterman’s (D-Penn.) ongoing treatment for clinical depression.

Sen. Dianne Feinstein (D-Calif.) is seen speaking on Capitol Hill in Washington on May 5, 2020, and Sen. John Fetterman (D-Pa.)is seen at Belmont Water Treatment Center in Philadelphia on Feb. 3, 2023. (Andrew Harnik/ AP Photo; Andrew Caballero-Reynolds/AFP via Getty Images)

On Thursday, Feinstein, 89, said she was hospitalized with the virus and won’t return until “later this month,” while Fetterman, 53, was hospitalized at Walter Reed National Military Medical Center to treat clinical depression last month. It’s not clear when Fetterman will be released.

Two other senators this week missed votes, including Sen. Jeff Merkley (D-Ore.) and Sen. Mike Crapo (R-Ind.) Merkeley said in a statement that he is in Oregon to deal with a “family matter,” while Crapo reportedly is suffering from illness.

Because of absences this week, the Senate is deadlocked at 48–48, forcing Vice President Kamala Harris to cast tie-breaking votes for Democrats. When Crapo and Merkley return, the Senate will be tied at 49–49.

With no time-table provided for either Fetterman’s or Feinstein’s respective returns to the Senate, some analysts say that Democrats could face problems when trying to confirm President Joe Biden’s nominees.

This week, the Senate voted 49–48 in favor of one of Biden’s judicial picks, Margaret Guzman, and also voted 49–48 to confirm Araceli Martinez-Olguin to serve as a federal judge in the Northern District of California.

Slim majorities are always challenging, but especially so in today’s Senate,” Sarah Binder, political science professor at George Washington University’s Columbian College of Arts and Science, told Newsweek on Thursday. “There are not many legislative measures on tap in the Senate, but Democrats will feel the pinch of a tied Senate whenever they try to confirm a controversial nominee.”

“In those cases, Democrats will need Vice President Harris back in the chair to break a tied vote to cut off debate on a confirmation vote,” Binder added. “That might slightly slow down Democrats and encourage them to focus on nominees who have some support from across the aisle.”

In an interview with Fox News, strategist Doug Heye said that “the danger of having such a small majority is that one or two illnesses can bring things to a halt,” noting the White House “has been aggressive and effective on judicial nominees, but that’s all on hold for now.”

Read more here…

Tyler Durden
Sat, 03/04/2023 – 11:30

via ZeroHedge News https://ift.tt/SfYJxG8 Tyler Durden

‘Triple-Digit’ La Nina Ending As El Nino May Strike Soon

‘Triple-Digit’ La Nina Ending As El Nino May Strike Soon

On Wednesday, the World Meteorological Organization reported that a ‘triple-digit’ La Nina weather phenomenon, which caused severe droughts and floods, is finally ending. Nonetheless, the probability of an El Nino occurring is increasing and could affect global weather patterns.

Severe Weather Europe provides an in-depth forecast of one of the most important weather changes in years: 

La Nina is over, and an El Nino event is forecasted to begin this Summer. An El Nino event can completely change the weather patterns in the upcoming seasons, especially during the late Fall and Winter seasons, so this will likely be one of the biggest global events in 2023.

Ocean anomalies and especially their changes can significantly influence seasonal weather patterns. Perhaps even more so in Winter, when the pressure systems are strongest.

First, we will look at why these ocean anomalies affect global weather on a large scale. Then we will look at how and when El Nino will emerge and how it can influence the Winter season of 2023/2024 based on historical data.
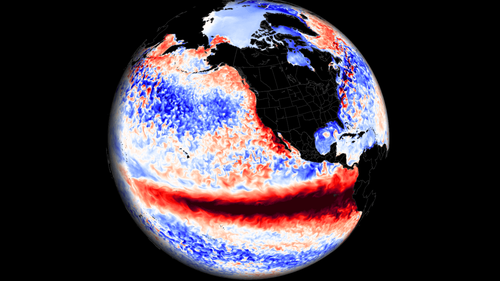
OCEAN-ATMOSPHERE WEATHER RELATIONS 

El Nino and La Nina are two phases of the ENSO, which stands for “El Niño Southern Oscillation.” This is a region of the equatorial Pacific Ocean that shifts between warm and cold phases. Typically there is a phase change around every 1-3 years.

ENSO significantly influences tropical rainfall, pressure patterns, and the complex energy exchange between the ocean and the atmosphere. As a result, we can observe large-scale pressure changes in the tropics with each developing phase or during its breakdown.

The image below shows the ENSO regions across the tropical Pacific. Regions 3 and 4 expand over the east and west tropical Pacific. The main area combines regions 3 and 4, seen in the image as the Nino 3.4 region.
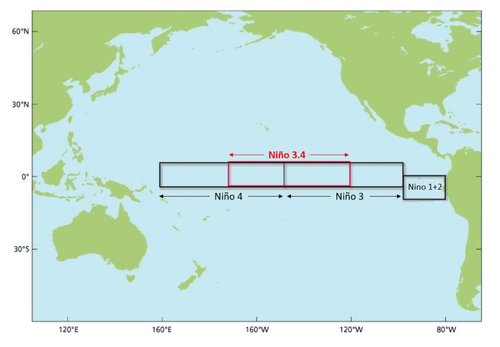
Each ENSO phase influences the pressure and weather in the tropics differently. This affects the overall global circulation over time, changing the weather patterns worldwide.

A new (cold/warm) phase usually develops between late Summer and early Fall. It then lasts until Spring, but some events can last up to two or three years.

The following image below from NOAA Climate shows the typical circulation during a cold ENSO phase, which is currently on its way out.

Descending air in the eastern Pacific causes high pressure and stable weather. At the same time, the air is rising in the western Pacific, causing frequent thunderstorms, low pressure, and more rainfall.
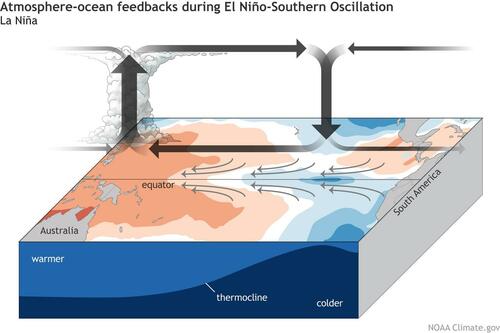
This way, ENSO strongly impacts the tropical rainfall and pressure patterns, affecting the ocean-atmosphere feedback system. Through this ocean-atmosphere system, the ENSO influences the weather globally.

ATMOSPHERIC CHANGES

The cold ENSO phase is called La Nina, and the warm phase is called El Nino. Besides the ocean temperatures, one of the main differences between the phases is the pressure patterns they develop, seen below as high (H) and low (L) pressure zones.
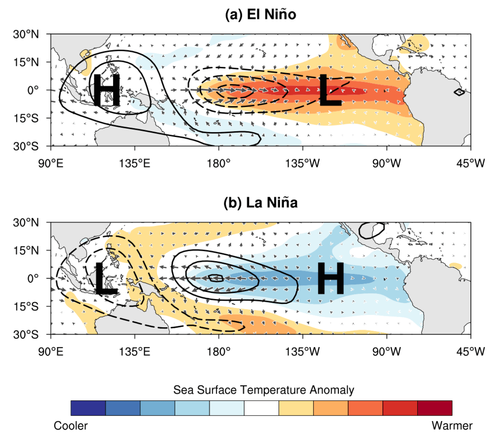
During an El Nino, the pressure over the tropical Pacific is lower, with more rainfall and storms in this region.

But during a La Nina, the pressure over the equatorial Pacific is higher, creating stable conditions and fewer storms. These pressure changes translate into global circulation over time, affecting seasonal weather over both Hemispheres.

We can observe a global shift in pressure patterns during the emergence of an ENSO phase. But it is usually more influential during the peak of its phase.

But how does ENSO even shift between cold and warm phases? The simplest answer is that it happens because of a complex relationship between pressure, winds, and ocean currents.

Global trade winds usually start or stop a certain ENSO phase by overturning the ocean surface layers and altering the ocean currents. Trade winds are steady and persistent winds, blowing towards (and along) the Equator in both Hemispheres.
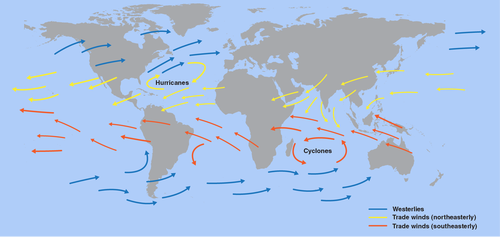
But the key here is not just in the winds, as pressure differences drive them. Thus, the ENSO phase directly responds to an atmospheric pressure change called the Southern Oscillation Index (SOI).

The Southern Oscillation Index or SOI represents the difference in air pressure measured at Tahiti (French Polynesia) and Darwin (Australia). The image below shows the location of the two pressure zones important for ENSO.

Positive SOI values mean the pressure over the Tahiti side is higher than over Darwin in Australia. This corresponds to stronger easterly trade winds, supporting La Nina conditions.

But during an El Nino, we see lower pressure in the eastern Pacific, over Tahiti, and higher pressure over Darwin. This produces a negative SOI value and weaker trade winds, which means less ocean surface cooling.

This entire process is much better seen in the video animation below. It shows the ocean temperature anomalies from Summer to Fall and how quickly they can change in the ENSO regions.

ENSO cooling restarted in August as the trade winds intensified. As a result, cold waves developed across the equatorial Pacific as the winds pushed surface waters to the west.

WINTER SEASON 2022/2023 CLOSES

So with La Nina slowly saying goodbye, we will quickly look at its influence on the Winter season.

A strong blocking high-pressure system in the North Pacific is a typical effect of a cold ENSO phase (La Nina). That usually redirects the polar jet stream down over the northern United States. You can see the La Nina winter weather patterns in the image below by NOAA Climate.
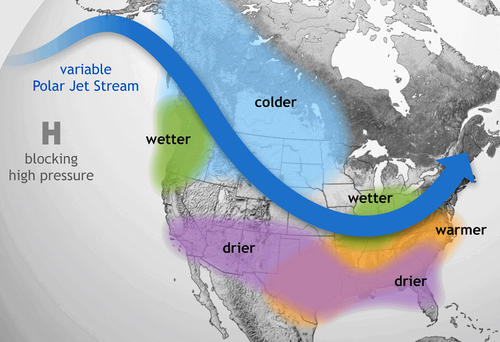
The colder air is typically spread over the northwestern United States, the Midwest, and western Canada. Warmer than normal winter weather is found in the southeastern and eastern parts of the United States.

Looking below at the actual 22/23 Winter analysis, you can see a very similar pattern. Colder air focused on western Canada, the northwestern United States, and parts of the Midwest. The rest of the United States ended up warmer than normal. Europe is also warmer than normal, but that is not a direct La Nina-specific pattern.

This is due to the jet stream changes, which you can see reflected in the pressure anomalies below. A high-pressure anomaly extends from the North Pacific and into the polar regions. A low-pressure area was present over the western United States, bringing more unsettled Winter to the west and pumping warm weather into the eastern United States.
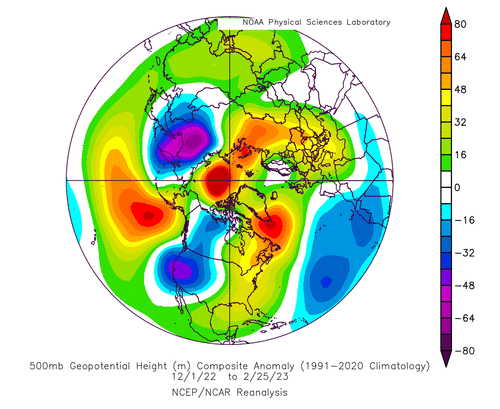
Over Europe, we mainly see higher-than-normal pressure anomalies and lower pressure to the southwest. Again, this is something that was indicated in the seasonal forecast models, which had a good idea about this pattern in advance.

What about snowfall? The historical data shows that the jet stream from a La Nina also changes the snowfall potential over North America as the pressure systems take a different path.

The colder air is more easily accessible to the northern United States, which increases the snowfall potential when moisture is available. The graphic below by NOAA-Climate shows the average snowfall pattern for La Nina Winters.
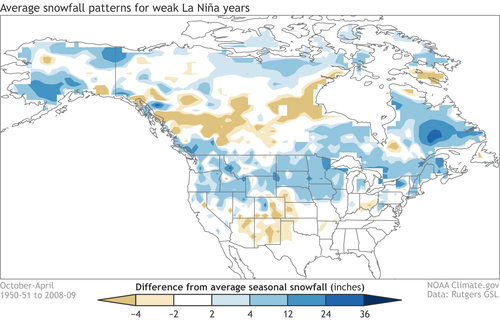
Besides the northwestern United States and the Midwest, we can see more snowfall potential over the northeastern United States and eastern Canada.

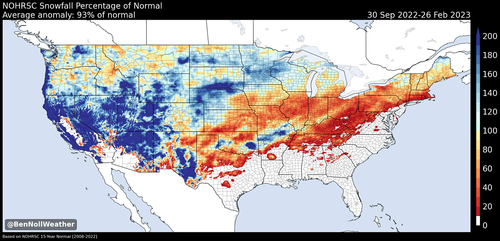
Looking at the actual Snowfall anomalies, we can see more snowfall across the western and northern United States. This is where we typically see more snow in a La Nina winter. But there is a large lack of snowfall in the central and eastern United States. Image by Ben Noll.
But, as you will see, La Nina is already breaking down, slowly losing its influence in the atmosphere.

LA NINA HEADS FOR THE EXIT

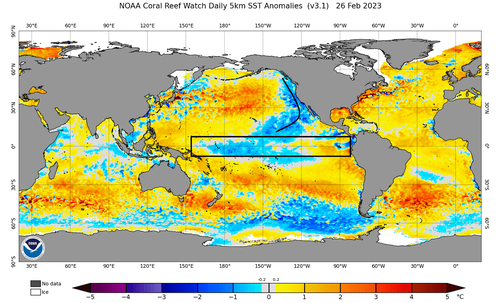
The latest global ocean analysis below reveals weakening cold ocean anomalies in the tropical Pacific. However, cold anomalies remain in the western regions. A relatively strong cold horseshoe pattern persists on the west coast of North America, associated with a negative PDO phase. But more on that in another article. Image by NOAA CRW.
Below, you can see the anomaly data from the past years across the ENSO region. You can see the first La Nina event in 2020. The second La Nina occurred in late 2021, lasting through the Winter. A third-year event is currently active but is already on its way out.

The current La Nina was 3rd consecutive. No cold ENSO event has gone into the 4th year in the known records. So it is expected that this is the last La Nina phase for some time, increasing the statistical likelihood of an El Nino event for the 2023/2024 season.

Looking more closely at the latest analysis of the ENSO regions below, the cold anomalies are breaking down over the east. So overall, La Nina is really hard to define at this point. But as the ocean anomalies break apart, the atmospheric influence lingers for a while.
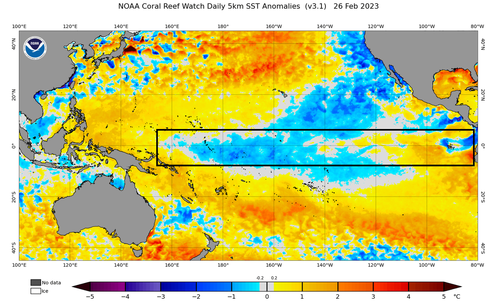
Below we have the latest 7-day ocean temperature anomaly change. You can clearly see an active warming trend across the ENSO regions. Some of it is seasonal, but the patterns are changing, and the La Nina is looking at its last days.

But there is more going on beneath the ocean surface as well.

BELOW THE OCEAN SURFACE

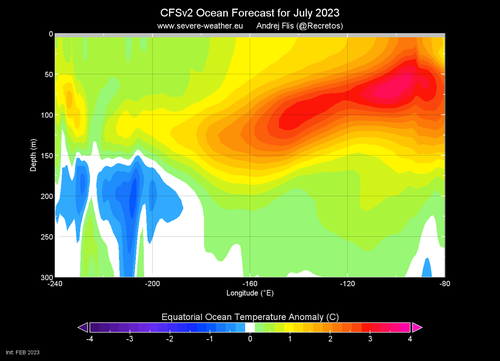
The activity below the ocean surface shows a strong subsurface wave of warm anomalies, also known as a Kelvin Wave, expanding from the west. In the east, you can see the remaining cold anomalies. These cold patches are what remains of the subsurface “engine” of the La Nina, now starting to turn off slowly as warmer waters move in.
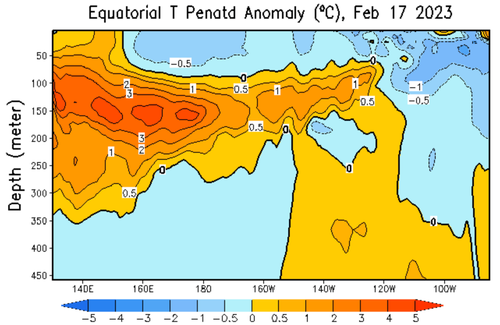
Looking at the latest July 2023 ocean forecast from CFS, we can see the warm pool taking over the subsurface waters. This signals that El Nino conditions may appear on the surface during Summer, creating completely different weather patterns by the end of the year.
But what do the forecasts show for the ocean surface layer?

EL NINO EVENT 2023 FORECAST

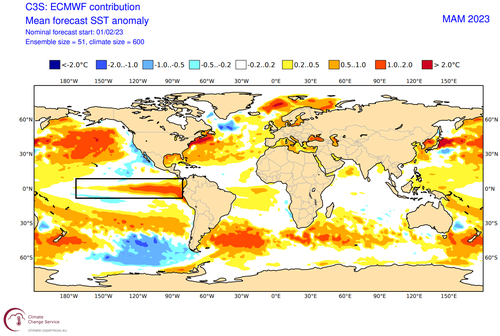
The ocean temperature forecast from the ECMWF model shows the eastern and central ENSO regions going warm this Spring. The image below shows the average anomaly forecast for the March-April-May season, which is the meteorological Spring season.
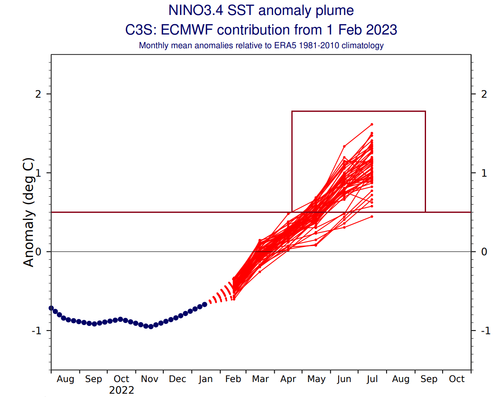
Below you can see the ensemble forecast for the eastern ENSO region. The La Nina conditions are forecast to dissipate rapidly. A shift into the warmer territory is forecast during Spring, with the El Nino threshold being above +0.5. So far, this looks like a moderate event in the works.
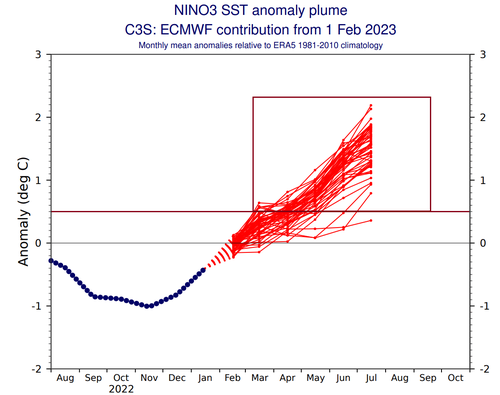
But below, you can look at the latest shorter-term seasonal forecast for the main ENSO region. Compared to the previous month, the latest update shows an even better consolidation in the El Nino territory over the Summer. Most of the ensembles reach above the El Nino threshold.
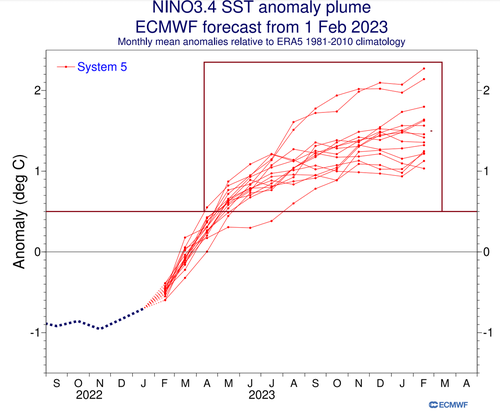
You can also see that in the extended seasonal forecast by ECMWF for the main ENSO region. It shows the cold phase going out rapidly by early Spring. A sustained shift into El Nino territory is forecast for the next Fall and Winter seasons of 2023/2024.
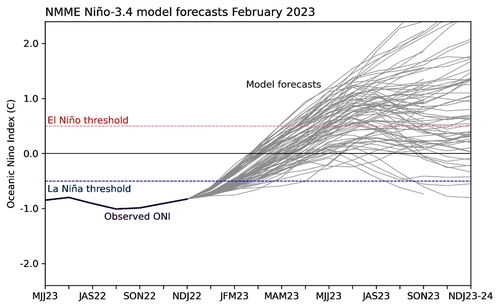
The ENSO forecast from the NOAA multi-model forecast is similar. First, it shows the current cold anomalies will weaken over the Winter. Then the forecast suite goes for the shift into the warm phase, but not as convincingly as the other model solutions for now.
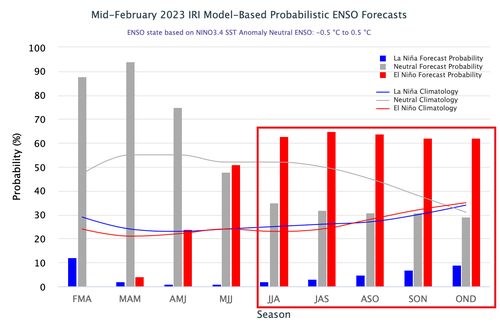
The IRI official probabilistic ENSO forecast also shows the current La Nina quickly disappearing. But it is typical for a new phase to emerge in late summer/fall with seasonal pressure changes. Below, you can see a strong sustained probability increase of an El Nino event in 2023.
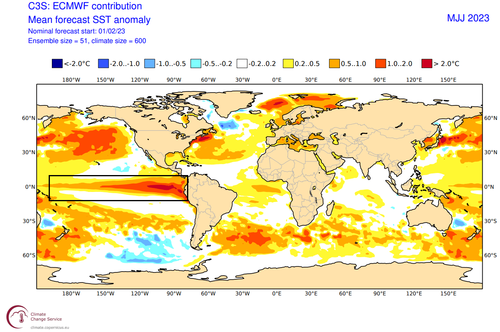
Looking at the warm season ahead, the ECMWF forecasts a strong tongue of warm anomalies across the equatorial Pacific. These conditions, as forecast, show a full El Nino event starting in Summer and would likely last till next Spring.
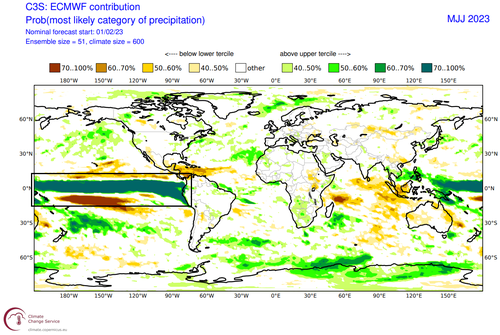
We can also look at the precipitation forecast, where you can see a strong area of increased precipitation over the ENSO regions. This is because an El Nino event causes lower pressure over the central and eastern tropical Pacific, increasing the number of storms and precipitation.
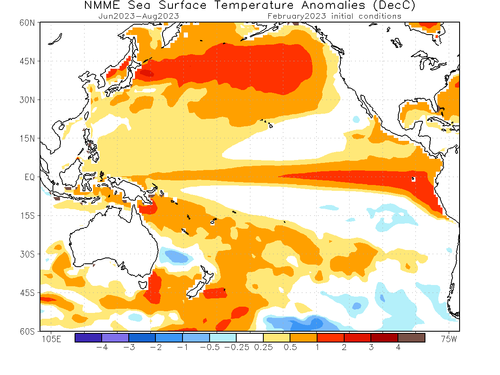
The North American multi-model ensemble forecast (NMME) also shows the same anomalies developing over Summer. It is somewhat weaker than the ECMWF forecast. But as the anomalies tend to strengthen over Fall, this is a healthy case for an El Nino Winter of 2023/2024 in the works.
ATMOSPHERIC PRECURSOR

Another sign of the El Nino development was pointed out by Eric Webb. He showed data from a study by Vimont et al. (2002) on how specific North Pacific pressure patterns precede El Nino events. Below is the expected pressure pattern ahead of El Nino events.

As you can see, the main pattern is a high-pressure system in the far North Pacific. Under that system is a low-pressure area, driving westerly winds across the equatorial Pacific.
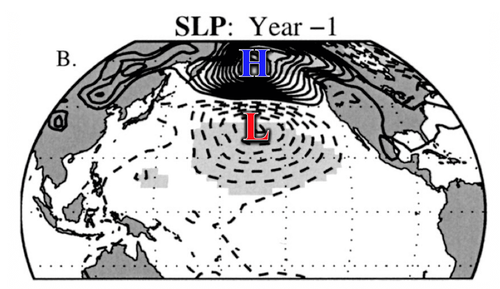
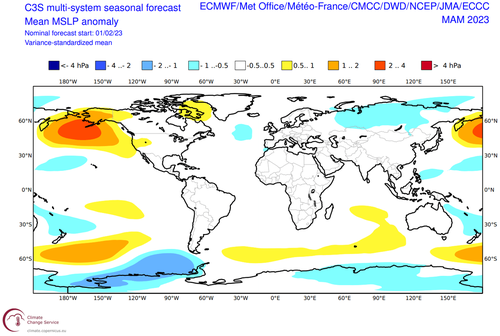
The EMCWF pressure forecast for this Spring shows a very similar pattern. A strong surface high-pressure system with an underlying low-pressure area. This does raise confidence for a proper weak to moderate El Nino event developing over the year.
But how does an El Nino change the weather patterns during the cold weather season?

EL NINO WINTER WEATHER IMPACT

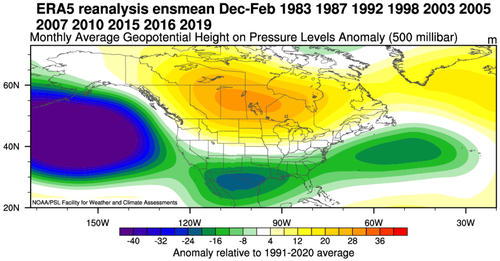
During the El Nino winter season, we usually have a strong and persistent low-pressure area in the North Pacific. That pushes the polar jet stream further north, bringing warmer-than-normal temperatures to the northern United States and western Canada.

But the southerly Pacific jet stream is amplified, bringing storms with lots of precipitation and cooler weather to the southern United States.

The image below shows the average winter pressure pattern for the past few El Nino winters. You can see the strong low-pressure area in the North Pacific, typical for an El Nino. A high-pressure zone is over Canada, and a low-pressure storm track with precipitation spans the southern United States.
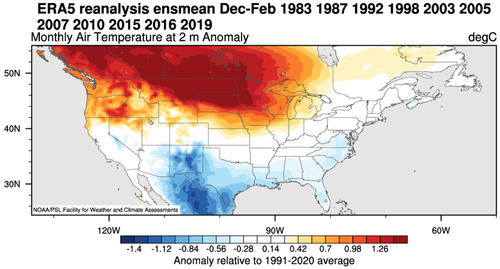
Below are temperature anomalies in these winters. You can see the average El Nino winter having colder temperatures in the southern half of the United States and parts of the eastern United States. The northern half of the country is warmer than usual, as is southern Canada.
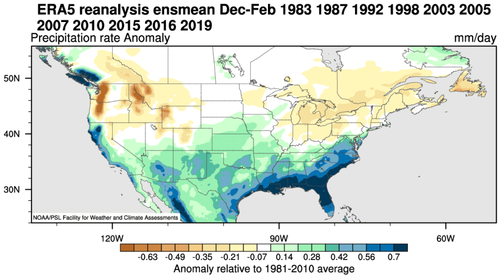
Precipitation-wise, an average El Nino winter can bring more precipitation to the southern half of the United States, especially in the southeast, due to the stronger subtropical jet stream. However, drier winter conditions prevail in the northwestern United States and around the Great Lakes, opposite a La Nina’s influence.
Of course, an El Nino also changes the snowfall patterns, as seen in the image below. There is usually less snowfall in the northern United States during the El Nino winter seasons. But more snow than normal is seen in the central and southern United States during an El Nino. And also over parts of the east.
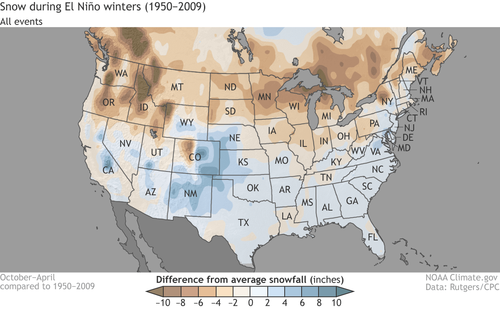
This is mainly due to low-pressure systems trailing across the southern United States. With cooler air available and more moisture, the chances of snowfall increase in the southern half of the country. But a lot depends on the availability of the cold air coming from the north.

After passing Canada and the United States, the jet stream moves into the North Atlantic, where it can take different paths toward Europe.

But the ENSO effects are much less direct in Europe than North America. That is why we focus more on North America to track direct (and more predictable) weather changes.

But still, looking at the historical connections of ENSO to Europe, we produced two graphics below. First is the Winter pressure anomaly signal. It shows a high-pressure tendency over most of Europe, with the subtropical ridge expanding during an El Nino winter season.
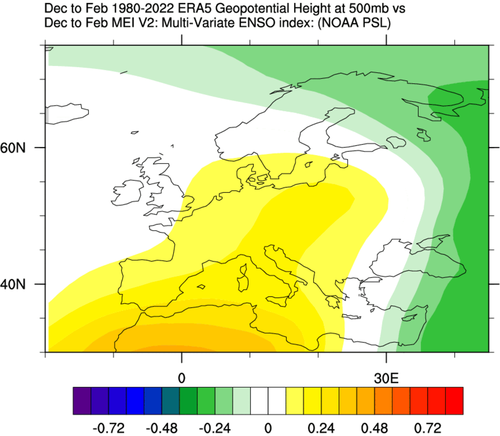
The following temperature is, of course, warmer than normal over much of the continent. But the signal has a weak strength, as the ENSO influence loses most of any direct influence this far out. So while there is a signal in the average, it cannot be used for any direct weather pattern forecasts over Europe.
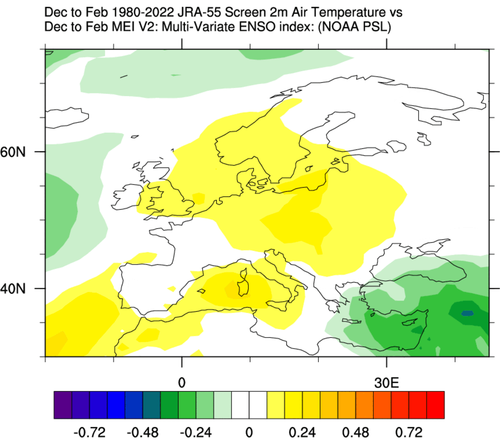
As El Nino changes the weather globally, hardly a corner of the world does not feel its effect. But the weather changes in parts further away are less predictable. That is because local weather systems play a specific role, as well as other global weather drivers.

But what does the long-range forecast data show for the upcoming Spring, still partially under the influence of the outgoing La Nina?

SPRING 2023 WEATHER OUTLOOK

The pressure pattern forecast from ECMWF below shows the typical La Nina high-pressure system in the North Pacific. The low-pressure system is indicated over western Canada, with another high-pressure area over Greenland. This helps to keep a low pressure over western Canada and southwestern/western Europe.
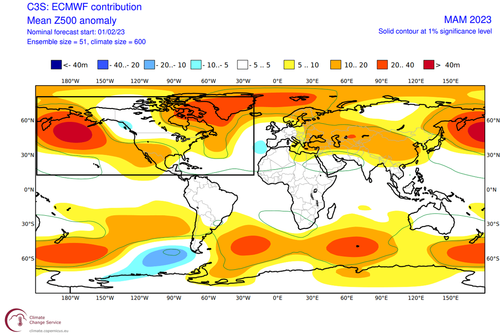
We also see the North Atlantic in a west-negative North Atlantic Oscillation (NAO) mode and blocking over the North Atlantic.

Looking closer at Europe, you can see that the surface temperatures are mostly above normal. This is due to the low-pressure area focused to the southwest, creating a warmer southerly flow over the continent.
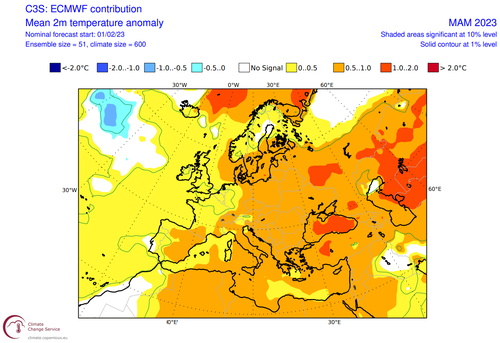
Over Noth America, the ECMWF forecast hints at normal to colder-than-normal surface temperatures over the northwestern United States and upper Midwest. In addition, we see an indication or a gap in the warmer anomalies toward the Ohio Valley. This is likely caused by a cold outbreak, common during Spring, especially early in the season.
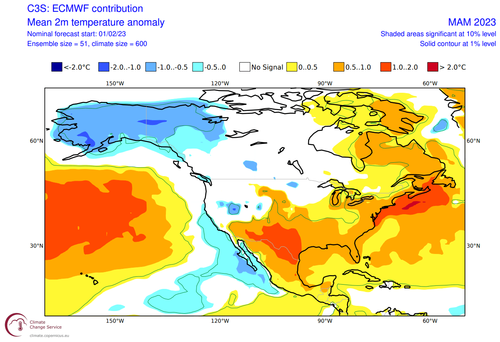
Despite being shown warmer than normal, the central parts of the United States can also get occasional colder weather and snow in early Spring during these jet stream patterns. But mostly warmer than normal temperatures are forecast over the far south and the southwestern United States.

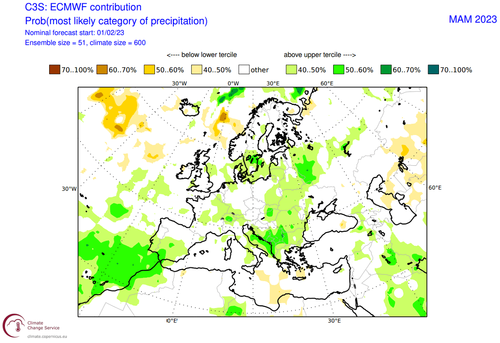
Precipitation-wise, Europe is trending to have more precipitation over the continent. This is the expected scenario as the model is going for a lower-pressure area over western and southwestern Europe, sustaining a warm and moist southerly flow over the mainland.
The North American precipitation anomaly forecast below shows a more La Nina-type pattern over Canada and the United States. As a result, the United States has wetter conditions in the northwest and the northeast and drier conditions over the southwest.
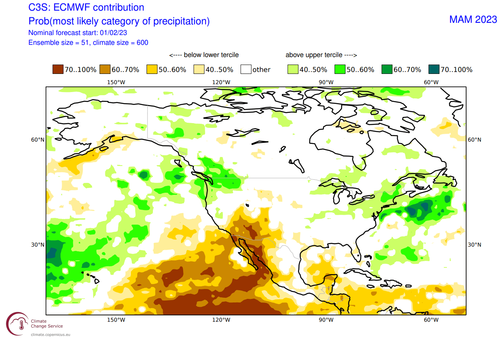
In Canada, the forecast currently shows more precipitation over the west and southeast. In combination with colder temperatures, that also affects the snowfall potential in early Spring.

NOAA OFFICIAL SPRING 2023 FORECAST

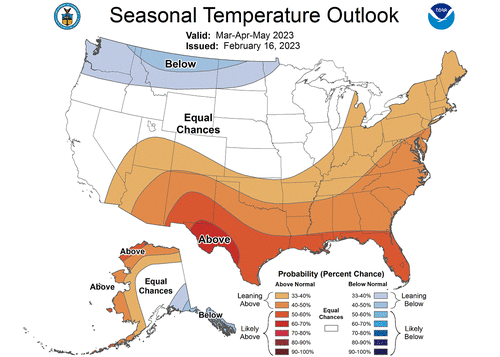
Below is the official Spring temperature forecast for the United States by NOAA. It shows the temperature probability, with colder to equal chances in the northern United States. The southern half of the country and the northeast have a higher probability of warmer than normal weather, as seen in the models above.
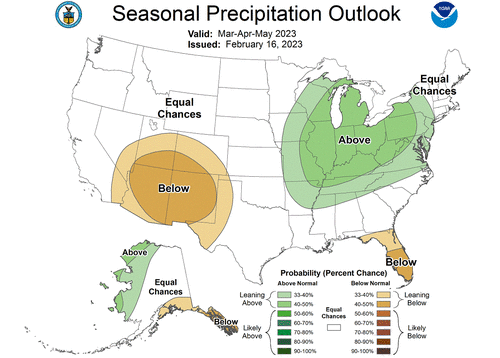
The official precipitation forecast is also quite similar to the model forecast. We see an equal-to-higher probability for more precipitation in the eastern United States across the Ohio Valley and the Great Lakes area. On the other hand, the southwestern United States is forecast to have a drier-than-normal spring season.
*   *   *

We would like to remind all the climate warriors on social media: “El Nino and La Nina are naturally occurring climate patterns and humans have no direct ability to influence their onset, intensity or duration,” according to the UN Office for the Coordination of Humanitarian Affairs

Tyler Durden
Sat, 03/04/2023 – 11:00

via ZeroHedge News https://ift.tt/1zEBY6V Tyler Durden

Brace Yourself For Extreme Economic Turbulence

Brace Yourself For Extreme Economic Turbulence

Authored by Michael Snyder via TheMostImportantNews.com,

Why is the U.S. economy suddenly deteriorating so rapidly all around us? 

Well, the short answer is that this downturn is way overdue.  For years, our leaders tried to cheat the laws of economics.  The Federal Reserve pushed interest rates all the way to the floor, which is something that never would happen in a true free market economy, and they pumped trillions of fresh dollars that they literally created out of thin air into the financial system.  Meanwhile, our politicians in Washington were engaging in the greatest debt binge that the world has ever seen. 

All of this reckless manipulation seemed to work for a while, but many of us warned that it would inevitably create a major inflation crisis, and that is precisely what happened. 

So now the Fed is aggressively hiking interest rates in a desperate attempt to tame the inflation monster that they helped to create, and higher rates are absolutely crushing economic activity.

At this point, most Americans understand that something has seriously gone wrong, and this is pushing consumer confidence lower.

On Tuesday, we learned that consumer confidence has now fallen for two straight months to start 2023…

U.S. consumer confidence unexpectedly fell for the second straight month in February as Americans’ outlook on the economy tumbled further, showing how persistent inflation is weighing on shoppers amid looming recession fears.

The Conference Board’s latest Consumer Confidence Index released Tuesday declined to 102.9 for this month, slipping from 106.0 in January — which was revised lower. Economists polled by Refinitiv had expected February’s index to tick up to 108.5.

Even more troubling is the fact that Americans seem to be bracing themselves for more economic turbulence as 2023 rolls along.

The Conference Board’s senior director of economics, Ataman Ozyildirim, is warning that U.S. consumers are planning to do far less spending in the months ahead…

“Expectations for where jobs, incomes, and business conditions are headed over the next six months all fell sharply in February,” Ozyildirim reported, noting that “consumers may be showing early signs of pulling back spending in the face of high prices and rising interest rates.”

“Fewer consumers are planning to purchase homes or autos and they also appear to be scaling back plans to buy major appliances,” the economist added. “Vacation intentions also declined in February.”

So home sales could go down even more?

That is really bad news, because home sales in southern California have already fallen to the lowest level ever recorded

When Christmas lights go up, home sales typically go down as buyers and sellers take a break.

But this past Christmas, Santa delivered a giant lump of coal to Southern California’s housing market, as well as to real estate agents, lenders, escrow officers and anyone else who gets paid by the transaction.

Closed sales this past January — which reflect deals signed during the holiday season — fell to 9,938, the lowest number of transactions in records dating back 35 years, real estate data firm CoreLogic reported Tuesday, Feb. 28.

As I keep telling my readers, a new housing crash has begun.

In fact, U.S. home prices have now declined for sixth months in a row

US home prices fell for the sixth month in a row in December, as rising mortgage rates pushed prospective buyers out of the housing market, according to the latest S&P CoreLogic Case-Shiller US National Home Price Index, released Tuesday.

Sadly, home prices will likely fall quite a bit more in many areas if the Federal Reserve keeps raising rates.

Higher rates are also really hurting the auto industry, and Zero Hedge is reporting that one of the most prominent subprime auto lenders in the entire country has just collapsed…

Well, after a lengthy period in which nothing seemed to happen, suddenly the dominoes are starting to fall, and as Bloomberg reports, used car retailer and subprime auto loan lender, American Car Center, told employees the business was closing its doors, just one day after the company had hoped to pull off a funding Hail Mary by selling a $222 million bond (it failed).

According to Bloomberg, the used car retailer, which targets consumers regardless of their credit history (and thus targets almost entirely subprime borrowers who can’t get a loan elsewhere), said in an email to employees on Friday the firm was ceasing all operations, closing its headquarters in Memphis, Tennessee, and that all employees would be terminated by the end of the business day, the people said. It employed about 288 people at its headquarters.

Yes, the dominoes are certainly starting to tumble.

But at least things in the U.S. are still better than they are over in Europe.

Right now, consumers in the UK are literally fighting over cucumbers as the nationwide rationing of fruits and vegetables starts to become extremely painful…

A supermarket shopper has described ‘customers fighting over the last box of cucumbers’ on the first day that Aldi and Tesco imposed rationing on some of its fresh produce. The two retailers announced limits on purchases of certain fruit and vegetables on Thursday.

It followed similar moves from Morrisons and Asda, with four major supermarkets now limiting the number of items people can buy across items such as peppers, cucumbers and tomatoes. The temporary measures are in response to a nationwide shortage of some fruit and veg.

And food prices in the UK continue to spiral completely out of control

A measure of UK grocery price inflation soared to a record high this month — that’s more bad news for consumers already facing a shortage of fruit and vegetables that has led to rationing at major supermarkets.

Grocery prices rose 17.1% in the four weeks to February 19, compared with the same period a year ago, according to data published by Kantar Tuesday. That’s the highest rate of inflation since the data company started tracking it in 2008, and is equivalent to adding an extra £811 ($980) to a household’s average yearly grocery bill.

Unfortunately, what we are facing is a global crisis.

Economic conditions all over the planet will deteriorate in the months ahead, and so I would encourage you to brace yourself for a tremendous amount of economic turbulence.

Because it is coming, and at this point there is nothing that our leaders can do to stop it.

For such a long time, central banks and politicians all over the world tried to cheat the system.

But in the process they made our long-term problems even worse.

Now a moment of reckoning is here, and every man, woman and child on the entire planet will feel the pain.

*  *  *

It is finally here! Michael’s new book entitled “End Times” is now available in paperback and for the Kindle on Amazon.

Tyler Durden
Sat, 03/04/2023 – 10:30

via ZeroHedge News https://ift.tt/AdIM1Tj Tyler Durden

Twitter Challenges Persist As December Revenues, Adjusted Earnings Dropped 40%

Twitter Challenges Persist As December Revenues, Adjusted Earnings Dropped 40%

The Wall Street Journal reported Friday night that Twitter Inc. sustained a year-over-year decrease of approximately 40% in both revenue and adjusted earnings for December. 

The report comes after a Jan. 24 Reuters story, citing data by Standard Media Index (SMI), which showed a collapse in advertising spend on the social media platform by 71% in December. Since Elon Musk’s takeover in October, there has been an exodus of advertisers

At the time, SMI said Twitter’s ad business was beginning to stabilize after offering a “slew of initiatives to win back advertisers, offering some free ads, lifting a ban on political advertising and allowing companies greater control over the positioning of their ads,” Reuters said. 

Musk has been focused on cutting costs since his takeover of Twitter was finalized on Oct. 27. As the self-appointed leader. He has supervised the firings of about half of the company’s 7,500 employees and the departure of senior executives while still actively seeking ways to streamline operations.

“Twitter still has challenges, but is now trending to breakeven if we keep at it. Public support is much appreciated!” the billionaire recently said. 

Twitter’s future remains uncertain as it is required to repay some of the $13 billion of debt that was utilized during the takeover by Musk. WSJ reported that the annual interest payments on the debt exceed $1 billion, and the first payment to a group of banks, including Morgan Stanley, Barclays PLC, and Bank of America Corp, was recently completed. 

Since Twitter went private after Musk’s acquisition, it no longer reports its financials to the SEC. This makes gaining insights into the company’s balance sheets more difficult. 

Last month, Gizmodo said the “revamped Twitter Blue subscription service” is a “struggling product” for the company and has “fewer than 300,000 paying subscribers worldwide.”

Even though Twitter is reining in costs, a slump in the ad business and lack of mass adoption of Twitter Blue brings into question if some of the future high-interest debt payments will be paid on time.. 

Tyler Durden
Sat, 03/04/2023 – 09:55

via ZeroHedge News https://ift.tt/mvcstEo Tyler Durden

Politics And Propaganda: Why Putin Won’t Pull Out Of Ukraine

Politics And Propaganda: Why Putin Won’t Pull Out Of Ukraine

Authored by The Jamestown Foundation via OilPrice.com,

  • The consequences of Russia’s invasion of Ukraine are mounting both internationally and domestically.

  • Despite the losses, however, the fallout for Putin if Russia does pull out of the war would be devasting.

  • Propaganda has successfully garnered a lot of domestic support for the war, and it’s been a huge point in local politicians’ electoral success.

Among the many terrible consequences of Russia’s full-scale aggression against Ukraine launched by Vladimir Putin a year ago, one should be singled out – that is, the Russian president’s inability to end the conflict as currently constituted.

Several primary factors underline this fact.

First, the war has caused an unusually high level of support among the Russian public for the Russian authorities and Putin personally; in recent years, before the invasion, this rating had been steadily declining (Radio Svoboda, May 25, 2019). Even independent sociologists, for example, the scientific director of the Levada Center (labeled as a “foreign agent” in Russia), Lev Gudkov, admit that public support is “not very clearly expressed, but quite tangible for the authorities and the war itself in society.”

According to Gudkov, approval for the war among Russians remains around 70 percent. Yet, at the same time, 50 percent of respondents want the fighting to end. He notes that this duality is partly due to the fact that many Russians are deeply aware of the war’s criminal nature but prefer to isolate themselves from the unpleasant truth and avoid receiving objective information (Eurasia Review, February 17).

Another factor that ensures passive support for the war from the majority of the population is the constant stream of propaganda that paints a harrowing future in the case of Russia’s defeat (Readovka, October 6).

Pro-Kremlin sociologists say that the lack of stability is having a negative impact on public sentiment. However, they immediately reassure the Russian authorities that this “does not affect the ratings of trust in the country’s leadership, since the prolongation of the special military operation means the prolongation of the effects of the consolidation of society and power” (T.me/russica2, February 6).

Realizing this, Moscow is not only dragging out the war but also trying to draw the entire Russian society into the conflict. At the regional level, the creation of volunteer organizations and initiative groups to help the mobilized has been encouraged. Sometimes even schoolchildren and students are forced to participate (see EDM, November 28, 2022). In cities, medical and hygienic supplies are being collected for the military, and in some regions, students are forced to stand in for mobilized workers at their places of employment (see EDM, February 6).

Despite all these efforts, even pro-Kremlin sociologists state that the majority of Russian society remains apolitical and the level of involvement in the military effort is steadily declining (T.me/russica2, February 4). This is confirmed by a recent study from the Levada Center, according to which the number of people closely following military operations in Ukraine is declining. Nevertheless, sociologists counter that society is mentally ready to continue the “special military operation” for a long time (Levada.ru, February 2).

Overall, the number of radical patriots who actively support the war, though they represent a smaller part of society, is nevertheless steadily growing. This is facilitated by massive propaganda, mobilization and an active policy of involving the population in the military effort, starting with the teaching of mandatory war propaganda in schools (Mel.fm, August 28, 2022). As former political prisoner Mikhail Khodorkovsky notes, these people, “whose whole life is now connected to the war,” have become Putin’s new support. The Kremlin’s stake in these radical “national patriots” represents the second major reason why Putin cannot end this war (Twitter.com/MikhailKhodorkovsky, February 6).

The third reason involves the growth in the number of beneficiaries, if not of the war itself, then of active support for it. Today, the public ratings of not only federal but also regional as well as local authorities depend on their degree of involvement in the war. As one experts point out, in the face of the threat of an external enemy, a “depoliticization of ideas of social justice [takes place], that is, its transfer from internal socioeconomic problems to the level of international politics and the special military operation as an event aimed at protecting the national interests of the country and restoring social justice” (T.me/russica2, February 11).

This is also understood by regional political scientists, who openly note that “support for the [special military operation] guarantees votes in elections” and explain how this has influenced the growing popularity of specific governors (Russia-rating.ru, December 28, 2022). As a result, both federal and regional authorities are trying to stand out as much as possible in supporting those who came to Ukraine armed and ready to kill its citizens.

Some Russian State Duma deputies propose involving these officials in teaching at schools in the occupied territories and promise to support them when they are nominated for elections. They also regularly report on measures taken to support “participants of the [special military operation]” (Kp.ru, January 14). Such a policy greatly raises the status of people returning from the war. This, in turn, creates the fourth reason for the impossibility of ending the war—that is, not only the increase in the number of radical patriots but also an increase in their influence in Russian society.

Based on this, one can envision the emergence of a future conflict between the apolitical part of society and the aggressive “patriots” returning from the front. Corrupted by impunity and the propaganda cult around them, these people may begin to demand too much from the rest of the population. However, the real paradox lies in the fact that the Kremlin, even realizing this, sees only one way to delay the social upheaval: continuing its war against Ukraine.

In reality, this method could smooth out the external manifestations of social conflicts, but at the same time, it will only exacerbate their causes. Thus, sooner or later these conflicts will make themselves known within the Russian Federation.

Tyler Durden
Sat, 03/04/2023 – 09:20

via ZeroHedge News https://ift.tt/zaQqICW Tyler Durden

Why Won’t Maryland Sell Me a Goddamn Beer?


A beer next to several driver's liscences

A few weeks ago, I learned the hard way just how easily government regulations can ruin a good night out.

Some friends and I had decided to drive an hour or so outside D.C. to visit Annapolis, Maryland. We were eager to go barhopping but quickly ran into trouble: Being over 21 and having valid identification to prove it wouldn’t be enough to actually get us alcohol.

As it turned out, a few of us—me included, unfortunately—had vertical driver’s licenses. After sitting down at a local restaurant, our waiter told us this meant he couldn’t serve us. He insisted that Maryland law barred serving alcohol to anyone who tries to buy it with a vertical IDs.

“He was very adamant about Maryland only accepting vertical IDs, despite my previous experience to the contrary,” said. Jack Bailey, a friend of mine who was there that night. “I’ve been to plenty of restaurants in Maryland where I’ve been allowed to purchase alcohol.”

We eventually found a restaurant that was willing to serve us, vertical IDs and all, but the incident struck me as strange. Based on some quick internet searching, the experience was far from unique. In Maryland, it’s not uncommon for restaurants and bars to refuse service to vertical ID holders, and the online consensus is that Maryland law requires this restriction.

But the real reason behind this practice turns out to be a complicated mess of local rules, state laws, and overzealous regulators.

Most states give vertical licenses to drivers under 21, presumably to make it easier for bartenders to weed out underage drinkers. In some states—like Maryland—vertical licenses are set to expire soon after the user turns 21, to make this difference even clearer. However, in many states—including Florida and Alabama, where Jack and I are from—vertical licenses can remain in use for much longer. Mine is good until just a few months shy of my 24th birthday. Jack’s is valid until he’s 24.

However, despite the insistence of online commenters—and our server—there’s no Maryland law barring the use of vertical IDs in alcohol purchases. Maryland law “really doesn’t mention anything about what orientation the driver’s license has to have,” Jeffrey Kelly, the executive director of the Maryland Alcohol and Tobacco Commission told me. “It doesn’t make any comment to that. It’s just the obligation of the individual seller to be certain that the person they’re selling to is 21 or older.”

Importantly, Maryland does have some other restrictive ID regulations. In Maryland, alcohol sellers are only technically allowed to accept Maryland driver’s licenses or ID cards, a military ID, or a state-issued electronic driver’s license. This particular regulation seems unusual, as all of Maryland’s five neighbors (Delaware, Virginia, Pennsylvania, West Virginia, D.C.) allow businesses to officially accept any U.S. driver’s license.

This means that businesses must exercise extra caution when examining out-of-state IDs. “If it’s an out-of-state ID, that doesn’t mean they can’t purchase alcohol. It just might require another level, I guess, evaluation by the seller,” Kelly said. If the customer does not obviously look older than 21, a business can ask for a second form of identification, or ask the customer to sign a form swearing that they are over 21.

This seems to be part of why vertical ID holders get turned away so often in Maryland—it’s just easier than using one of the other methods of verifying the age of out-of-state customers. Rather than turning away everyone not from Maryland, turning away the minority of early 20-somethings with leftover vertical IDs helps businesses lower their risk of losing their license over an accidental sale of alcohol to a minor without busting out a load of paperwork.

However, this isn’t the full reason behind Maryland bars’ tendency to turn away vertical ID holders. Local regulations and recommendations can get in the way, too. “Maryland has a different way of approaching the retail sales of alcohol, different than most every other state in the country, and that is each local jurisdiction…[has] their own local liquor boards,” Kelly said, “So each of these local boards has its own set of regulations that apply to the retailers, and each jurisdiction has some type of unique legislation surrounding [sic] as well.”

For example, the local government of Fredrick County Maryland has a suggested “Responsible Sales Policy” that, among other restrictions, recommends that business mandate that “no employee will accept a vertical identification card.”

These factors—Maryland’s narrow range of officially acceptable IDs and stringent local regulations and “suggestions”—end up incentivizing business owners to turn away droves of legal, paying customers. Making matters worse, many of them seem to think they’re following state law when pushing out vertical ID holders.

My friends and I will probably stick to barhopping in D.C. instead.

The post Why Won't Maryland Sell Me a Goddamn Beer? appeared first on Reason.com.

from Latest https://ift.tt/YAQoWIg
via IFTTT

“Boon For Europe”: US NatGas Flows To Freeport LNG Hit ‘Record High’

“Boon For Europe”: US NatGas Flows To Freeport LNG Hit ‘Record High’

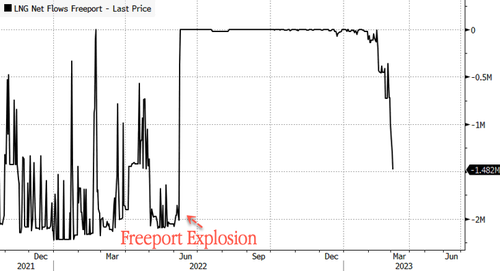
Houston-based energy firm Criterion Research told clients Friday morning that the Freeport LNG export facility in Texas has recorded a surge in natural gas flowing into the plant. Inflows hit a daily record high as the export facility partially restarts operations. 

According to Criterion Research flow data, Freeport LNG nominations have surged to nearly 1.5 Bcf/d as of this morning, which implies that the terminal now has two full LNG trains operating. The pop in Freeport volumes pushed net US LNG feed gas demand above 14 Bcf/d, which is a new all-time high

Thus far, the FERC has given full regulatory approval for the restart of Trains 2 & 3, and there is a pending request by Freeport LNG to bring liquefaction Train 1 in the near term. Criterion currently believes the terminal could reach 2 Bcf/d by the end of March if the FERC gives them clearance to activate Train 1 in a timely manner. 

… and when operating at full power, Freeport’s three LNG trains will likely increase volumes north of 2 Bcf/d. Some analysts have suggested that the plant may not resume full capacity until late March or early April.

Criterion Research noted the return of Freeport is a “boon for Europe” as the continent rejiggers NatGas sourcing away from Russia. 

While the US natural gas market is mainly concerned about high production and the after-effects of a mild winter on storage, the return of Freeport is a boon for Europe as it moves closer to the storage refill season in the coming months. The added 2 Bcf/d in exports from Freeport will go a long way in helping to offset lost Russian volumes.

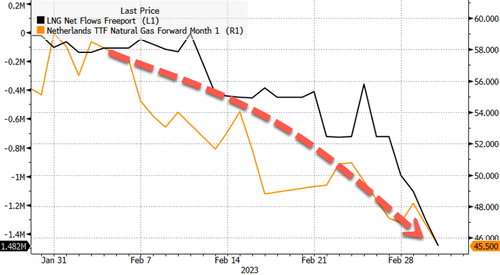
Freeport accounts for 15% of all US LNG exports. The prospect of Freeport returning has sent TTF price, Europe’s NatGas benchmark, lower over the last month. Other price pressures have been unseasonably warm weather and large supplies. 

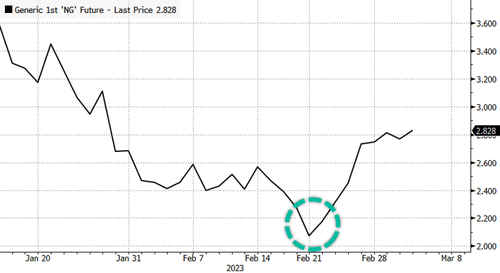
And inversely, US NatGas prices have bounced 37% since falling around the $2 handle last month. Freeport’s return would mean tighter US markets as exports to Europe and or Asia ramp up in the months ahead. 

The return of Freeport LNG is excellent news for Europe’s supply ahead of the summer season. 

Tyler Durden
Sat, 03/04/2023 – 08:45

via ZeroHedge News https://ift.tt/LI943Ha Tyler Durden

NATO Member Says 50 Billion Euros In Aid To Ukraine “Far From” Satisfying, Urges Allies To Boost Spending

NATO Member Says 50 Billion Euros In Aid To Ukraine “Far From” Satisfying, Urges Allies To Boost Spending

Authored by Lorenz Duschamps via The Epoch Times,

Estonia has called on all NATO allies to increase defense spending in a bid to strengthen collective support for Ukraine as the conflict recently passed its one-year mark.

“Members have not done enough,” Estonian Foreign Minister Urmas Reinsalu told Fox News Digital in an exclusive interview. “This is my comprehensive assessment.”

“The Western camp has supported weapons aid, given around 50 billion euros [about $53 billion] approximately, and this is far from being satisfying,” he added.

“If we want to invest in Ukrainian victory, not only to invest to Ukraine, that they can survive and not lose, we have to change the paradigm of our support.”

The Baltic state, which joined NATO in 2004 and is also a member of the European Union, recently increased military aid for Ukraine to 370 million euros (about $392 million), slightly more than 1 percent of Estonia’s gross domestic product (GDP).

In the interview, Reinsalu asked all member states to follow Estonia’s target, noting that not only should allies contribute more to Ukraine, but they should also increase defense spending to the alliance itself, suggesting raising spending from 2 percent to 2.5 percent.

“We are making—before the Vilnius Summit—the call that all the NATO allies should contribute their fair share to defense, and the 2 percent is not enough … to raise the minimum of defense expenditure from GDP to 2.5 percent level,” Reinsalu said, adding that Estonia “passed the decision” to raise defense spending to 3 percent of GDP starting next year.

Reinsalu’s remark reiterates a stance revealed in early February by Estonian Minister of Defense Hanno Pevkur, who pled during a bilateral meeting in Estonia’s capital, Tallinn, with U.S. Secretary of Defense Lloyd Austin that all EU partners and NATO member states “must spend more than 2 percent” of their GDP, “ideally closer to 2.5 percent” on defense, according to a transcript of the meeting.

U.S. Secretary of Defense Lloyd Austin (R) and Estonian Defense Minister Hanno Pevkur stand for their national anthems during an honor cordon at the Pentagon in Arlington, Va., on Oct. 18, 2022. (Kevin Dietsch/Getty Images)

Estonia, though a small country, has been a vocal supporter of Ukraine since the start of Russia’s invasion and, as a share of its economic size, has “provided more military aid to Ukraine than any other country in the world,” Austin said at the meeting.

According to data from The World Bank reported by Fox News, Estonia invested as much as 2.4 percent of its GDP toward NATO in 2020, though that number dropped to 2.2 percent in 2021.

Spending Pledges

NATO allies agreed in 2014, after Russia annexed Ukraine’s Crimean Peninsula, to halt the spending cuts they had made after the Cold War and move toward spending 2 percent of GDP on their defense budgets by 2024. That pledge expires next year, and now, some NATO members are working toward a new target, despite some existing members not even supplying the necessary 2 percent of GDP to defense as stipulated.

NATO leaders are expected to map out the way ahead when they meet for their next summit at the Heads of State Summit in Vilnius, Lithuania, in July, although it is unclear what the new guideline will be because some member states say 2.5 percent of GDP is unrealistic.

The United States, meanwhile, spends more on its defense budget than all the other allies combined, putting 3.47 percent of GDP into its military coffers, according to NATO estimates for last year.

On the one-year mark of Russia’s invasion of Ukraine, the Biden administration also announced an additional $2 billion in new military aid, bringing the total to $32 billion in taxpayer funds provided to Kyiv in the past 12 months, or roughly five times Ukraine’s annual military budget.

Tyler Durden
Sat, 03/04/2023 – 08:10

via ZeroHedge News https://ift.tt/jvyANqT Tyler Durden