2013 was not a good year for The Bond King after Bill Gross’ flagship Total Return Fund had its first disappointing year in a long time, and with a record outflow of $41.1 billion, it just may be a year Gross would like to forget entirely. Judging by his just released letter, the first for 2014, the “Seesaw Rider”, the manager of the world’s largest bond fund has had an earful from investors who are suddenly concerned that in an environment of rising rates owning bonds may not be the best strategy first and foremost due to the potential of capital loss. Which is why, not surprisingly, Bill comes out with a full court press defense of the one thing he does: own bonds.
As Gross has made abundantly clear in recent months, the bonds he does own are not spread out across the curve – in fact, those keeping track of his TRF holdings will know that it is currently short by 5% of AUM in the 20 year+ maturity bucket, and long some 62% in the 1-5 year space – but focus on the short end. To wit: “An investor should own bonds with less duration and shorter maturities when the teeter totter is on the losing end. Admittedly, those with long-term liability structures such as pension funds and insurance companies have to be careful about their underweights but as a rule, less duration should mean more alpha relative to an investor’s benchmark as the interest rate worm turns and the cycle shifts upward.”
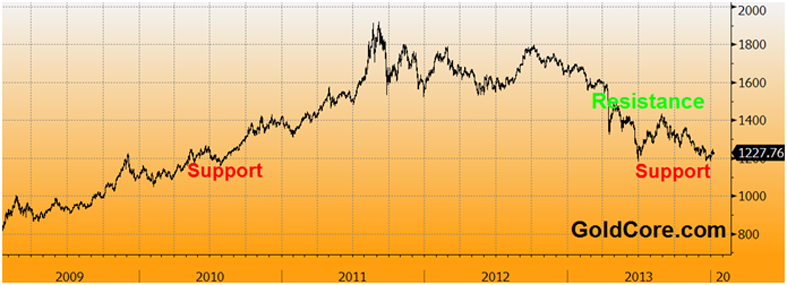
But the main defense Gross uses circles around the following statement: “Bond prices as shown in Chart 1 have already come down a lot since April of 2013 or July of 2012 – whenever you want to label the peak. And bond prices – especially those at the front end of yield curves – say 1-5 years, are critically dependent on the future level of Fed Funds, not the glidepath of the almost preordained Fed Taper which should end in 2014. Both the taper and the policy rate of course are dependent on 1) economic growth, 2) the level of unemployment, and 3) future inflation – the third condition being the runt of the Fed’s litter but one that promises to turn a sow’s ear into a silk purse for those who watch it closely.”
In short: Gross believes that the one catalyst that is preventing him for capitulating on the bond sector is the persistent lack of (BLS measurable) inflation:
I am amazed at the fascination and emphasis placed on the u-rate during employment Fridays. Bond prices will move (in some cases by points) with a minor up or down change in unemployment relative to expectations, but when it comes to the third little pig of the litter – inflation – no one seems to care. This number – the PCE annualized inflation rate – is released near the 20th of every month but you will not see CNBC or Bloomberg analysts waiting with bated breath for its release. I do. I consider it the critical monthly statistic for analyzing Fed policy in 2014. Why? Bernanke, Yellen and their merry band of Fed governors and regional presidents have told us so. No policy rate hike until both unemployment and inflation thresholds have been breached and even then “they’re not thresholds,” they’re forks in the road that may or may not lead in a different direction. (To paraphrase Yogi Berra, “if you come to a fork in the road, you don’t have to take it!”) At the moment, the Fed’s fork or target for PCE inflation is 2.0% or higher while December’s annualized rate was only 1.2%. Miles to go before Yogi or anyone else has to begin worrying about a policy rate hike. 2016 at the earliest.
His conclusion for those holding the short-end: “1-5 year bonds, combined with credit, volatility, curve rolldown, and a dollop of currency should float a bond investor’s boat in 2014 and avoid breaking the buck in total return space. I’m not saying we’ve got a bull market here. That would be like saying the Knicks or the Cubs have got a chance to win the big one. They don’t, and a bull market in bonds is one for the history books. But if PCE inflation stays below 2.0% and inflationary expectations don’t rise appreciably above 2.5%, then a 3-4% total return for 2014 is realistic.”
That’s all fine and great, but what Gross misses is one simple thing: bond rates traditionally have always gone up during easing episodes, only to, paradoxically, plunge just after QE ends, as equities tumble and as investors around the world scramble for the safety bid – Treasurys. Just recall what drove bonds to sub-2% in August 2011 – it was the 20% drop in stocks, certainly not the downgrade of the US by Standard and Poors.
Which is why if indeed the Fed is trimming and ultimately ending QE, it is that which investors should focus on, not on inflation. Because the big driver for 2014 will not be the short end based on always wrong expectations of what Fed monetary policy does to prices, but the exodus of speculative money from equities into safe havens, the Great Unrotation.
Everything else is largely irrelevant.
* * *
From Bill Gross’ Investment Outlook letter: “Seesaw Rider“
There’s 50 ways to leave your lover and maybe more than that to lose your money or “break the buck,” as some label it in the money markets. You can buy the Brooklyn Bridge, bet on the Cubs to win the World Series or have owned 30 year Treasury bonds in 2013, to name just a few. But bridges and baseball aside, what you’re probably interested in hearing from me is how to avoid breaking your investment buck in 2014.

First of all, some disclosures: There are no guarantees, and staying above water in financial markets is not one of them. If you want a life preserver buy a Treasury bill, but then the 6 basis point yield may not excite you. Secondly, I’ve had lots of experience in breaking the buck so the advice may be somewhat tainted. Having started at PIMCO in 1971, there followed an intermittent stretch of nearly 10 years when yours truly was dog-paddling like crazy just to stay afloat. Still, PIMCO’s waterwings functioned better than most, so that when the time came for yields to drop and prices to go up in 1981, we were well positioned for a 30 year bull market.
Yet having experienced those formative years – with 2013 now being one of them in total return space – it’s helpful to remember some of the client and indeed personal frustrations that accompanied them. When your annual return shows a minus sign, clients wonder why they should pay you a fee to lose money. They have a point, although it may be somewhat shortsighted. A few also struggle to understand that bond prices go down when interest rates go up, and that with interest rates so low, the odds of up as opposed to down are slightly tilted. This principle I call the teeter totter or “seesaw.” I used to explain bonds to my mom every Thanksgiving or so, on a journey up to San Francisco. She wondered then why she was always 10 or 11% richer on her statement at year-end, remarking that these “yields” were pretty high. I reminded her that the 11% or so was a total return not a yield and that when interest rates went down, prices went up just like a “teeter totter.” That seemed to help her understand the “bond market” much like it would help some “mom and
pop” investors understand it today, although bonds switched seats so to speak on the seesaw in 2013.
Still, if you’re on the wrong end of an interest rate teeter totter headed up, it makes you wonder why anyone would own bonds or at least why anyone would own longer-term bonds. That question and its answer are the key for 2014.
First of all the obvious: An investor should own bonds with less duration and shorter maturities when the teeter totter is on the losing end. Admittedly, those with long-term liability structures such as pension funds and insurance companies have to be careful about their underweights but as a rule, less duration should mean more alpha relative to an investor’s benchmark as the interest rate worm turns and the cycle shifts upward.
But riding the bond market seesaw doesn’t always mean negative returns, especially when it comes to other “carry” components inherent in fixed income securities. As I pointed out in my August 2013 Investment Outlook titled “Bond Wars,” maturity extension is just one of the ways to produce carry and total return in a fixed income portfolio. In addition there are 1) credit spreads, 2) volatility sales, 3) curve and 4) currency-related characteristics that when combined with maturity can produce returns over and above those microscopic Treasury bill rates, and still keep you from “breaking the buck” under a majority of scenarios. On the “down” side of an interest rate teeter totter these carry components can help a portfolio benchmarked to a 5-year duration bond market index float above water and even enjoy swimming! Likewise, they become major components of low duration and “unconstrained bond portfolios” that do more than dog-paddle in a marketplace where bonds, stocks and alternative assets are competing for total returns. So in 2014, look for PIMCO to stress credit, curve, volatility and a tiny bit of currency while deemphasizing 10- and 30-year maturities that are Taper affected.
Still, a seesaw rider should not get carried away by this metaphor that seems to guarantee that what goes up must come down. Bond prices as shown in Chart 1 have already come down a lot since April of 2013 or July of 2012 – whenever you want to label the peak. And bond prices – especially those at the front end of yield curves – say 1-5 years, are critically dependent on the future level of Fed Funds, not the glidepath of the almost preordained Fed Taper which should end in 2014. Both the taper and the policy rate of course are dependent on 1) economic growth, 2) the level of unemployment, and 3) future inflation – the third condition being the runt of the Fed’s litter but one that promises to turn a sow’s ear into a silk purse for those who watch it closely.

I am amazed at the fascination and emphasis placed on the u-rate during employment Fridays. Bond prices will move (in some cases by points) with a minor up or down change in unemployment relative to expectations, but when it comes to the third little pig of the litter – inflation – no one seems to care. This number – the
PCE annualized inflation rate – is released near the 20th of every month but you will not see CNBC or Bloomberg analysts waiting with bated breath for its release. I do.
I consider it the critical monthly statistic for analyzing Fed policy in 2014. Why? Bernanke, Yellen and their merry band of Fed governors and regional presidents have told us so. No policy rate hike until both unemployment and inflation thresholds have been breached and even then “they’re not thresholds,” they’re forks in the road that may or may not lead in a different direction. (To paraphrase
Yogi Berra, “if you come to a fork in the road, you don’t have to take it!”) At the moment, the Fed’s fork or target for PCE inflation is 2.0% or higher while December’s annualized rate was only 1.2%. Miles to go before Yogi or anyone else has to begin worrying about a policy rate hike. 2016 at the earliest.
If so, then 1-5 year bonds, combined with credit, volatility, curve rolldown, and a dollop of currency should float a bond investor’s boat in 2014 and avoid breaking the buck in total return space. I’m not saying we’ve got a bull market here. That would be like saying the Knicks or the Cubs have got a chance to win the big one. They don’t, and a bull market in bonds is one for the history books. But if PCE inflation stays below 2.0% and inflationary expectations don’t rise appreciably above 2.5%, then a 3-4% total return for 2014 is realistic. Granted, that doesn’t come close to the 11% yields that my mother grew used to years ago, but then she was riding a seesaw and never knew it. Bond investors will be less rich, but more placid in 2014 than when she was teetering and tottering her way to good fortune.
Seesaw Speed Read
1) Total return bond portfolios should float above water in 2014.
2) No guarantees either!
3) Watch PCE inflation more than the unemployment rate.
4) Emphasize credit, volatility, currency and 1-5 year maturities.
5) Expect 3-4% total return for bonds.
6) If you think stocks will keep going, then keep riding. But seesaws go up and down!


via Zero Hedge http://feedproxy.google.com/~r/zerohedge/feed/~3/0gmjXWeaLfQ/story01.htm Tyler Durden
 Yesterday, I
  When South African prisoner-turned-president