Steven Greenhut Explains Why Cigarette Sin-Tax Hike Could Boost Black Markets

Anti-smoking activists in Sacramento have
submitted to the attorney general a proposed ballot measure to
boost taxes on a pack of cigarettes by $2, and use the revenues to
fund research into the treatment of tobacco-related diseases. It’s
the latest effort to crush smoking by significantly hiking the
costs of tobacco. But, Steven Greenhut points out, tax hikes offer
diminishing benefits and can lead to black markets.

View this article.

from Hit & Run http://reason.com/blog/2013/11/22/steven-greenhut-explains-why-cigarette-s
via IFTTT

Was JFK Killed by Right-Wing "Hate" – or by a Commie's Bullet?

Note: I’ll be talking about JFK’s foreign policy on
Huffington Post Live at about 12.25pm ET today.
Go here to watch
. The channel’s program “What if JFK had
lived?” starts at noon ET.

Over at the Volokh Conspiracy, David Bernstein asks the obvious
question after reading various attempts to blame the assassination
of John F. Kennedy on a generalized “atmosphere of hate” pervading
Dallas, Texas in the early 1960s. Was Dallas a hotbed of right-wing
paranoid fantasies back then? Sure was. But – and this is really
kinda important – it wasn’t the likes of nutjub Gen. Edwin Walker
who plugged the president. It was Lee Harvey Oswald, a Castro
supporter who had defected to the Soviet Union out of a mix of
Marxist idealism and anti-Americanism.

Look, guys. Lee Harvey Oswald murdered JFK. Oswald was
Communist. Not a small c, “all we are
saying is give peace a chance and let’s support Negro civil rights”
kind of Communist, but someone so committed to the cause (and so
blind to the nature of the USSR) that he actually went to live in
the Soviet Union. And when that didn’t work out, Oswald became a
great admirer of Castro. He apparently would have gone to live in
Cuba before the assassination if the Cubans would have had him.
Before assassinating Kennedy, Oswald tried to kill a retired
right-wing general. As near as we can tell, he targeted Kennedy in
revenge for Kennedy’s anti-Castro actions.


More here.

For more on the 50th anniversary of JFK’s murder, go here.

And watch our recent interview with Roger Stone, author of The
Man Who Killed Kennedy: The Case Against LBJ. I ain’t buying the
conspiracy theory – though I did literally buy his book and found
it a really captivating read, right up there with Don DeLillo’s
novel on “Oswaldskovich” (the nickname given Oswald by his fellow
Marines because he wouldn’t shut up about how great the USSR was),
Libra.


from Hit & Run http://reason.com/blog/2013/11/22/was-jfk-killed-by-right-wing-hate-or-by
via IFTTT

Was JFK Killed by Right-Wing “Hate” – or by a Commie’s Bullet?

Note: I’ll be talking about JFK’s foreign policy on
Huffington Post Live at about 12.25pm ET today.
Go here to watch
. The channel’s program “What if JFK had
lived?” starts at noon ET.

Over at the Volokh Conspiracy, David Bernstein asks the obvious
question after reading various attempts to blame the assassination
of John F. Kennedy on a generalized “atmosphere of hate” pervading
Dallas, Texas in the early 1960s. Was Dallas a hotbed of right-wing
paranoid fantasies back then? Sure was. But – and this is really
kinda important – it wasn’t the likes of nutjub Gen. Edwin Walker
who plugged the president. It was Lee Harvey Oswald, a Castro
supporter who had defected to the Soviet Union out of a mix of
Marxist idealism and anti-Americanism.

Look, guys. Lee Harvey Oswald murdered JFK. Oswald was
Communist. Not a small c, “all we are
saying is give peace a chance and let’s support Negro civil rights”
kind of Communist, but someone so committed to the cause (and so
blind to the nature of the USSR) that he actually went to live in
the Soviet Union. And when that didn’t work out, Oswald became a
great admirer of Castro. He apparently would have gone to live in
Cuba before the assassination if the Cubans would have had him.
Before assassinating Kennedy, Oswald tried to kill a retired
right-wing general. As near as we can tell, he targeted Kennedy in
revenge for Kennedy’s anti-Castro actions.


More here.

For more on the 50th anniversary of JFK’s murder, go here.

And watch our recent interview with Roger Stone, author of The
Man Who Killed Kennedy: The Case Against LBJ. I ain’t buying the
conspiracy theory – though I did literally buy his book and found
it a really captivating read, right up there with Don DeLillo’s
novel on “Oswaldskovich” (the nickname given Oswald by his fellow
Marines because he wouldn’t shut up about how great the USSR was),
Libra.


from Hit & Run http://reason.com/blog/2013/11/22/was-jfk-killed-by-right-wing-hate-or-by
via IFTTT

Wired's Louis Rossetto on the Death of the Mega-State and the Digital Revolution

“We came out and said there was a digital revolution happening
and it was going to change everything,” says Louis Rossetto, who
co-founded Wired magazine 20 years ago in 1993. “And
[that] it wasn’t the priests, the pundits, the politicians, and the
generals who were creating positive change.”

Rossetto was no stranger to bold predictions. In 1971, he
co-authored a
cover story
in the New York Times
Magazine
 announcing that libertarianism was the next
great transformative ideology and that young people were rejecting
the played-out politics of the right and the left. After editing a
publication called Electric Word in the late 1980s,
he
 and Jane Metcalfe launched Wired, the
publication that not revolutionized magazine design but chronicled,
critiqued, and in many ways created the Internet Age
. The
concept was to cover the real change makers, far from the
halls of power in Washington or established business capitals such
as New York, who were ushering in a new digital era that would
transform society. “That meta-story,” says Rossetto, “was
absolutely spot on.”

View this article.

from Hit & Run http://reason.com/blog/2013/11/22/wireds-louis-rossetto-on-the-death-of-t
via IFTTT

Wired’s Louis Rossetto on the Death of the Mega-State and the Digital Revolution

“We came out and said there was a digital revolution happening
and it was going to change everything,” says Louis Rossetto, who
co-founded Wired magazine 20 years ago in 1993. “And
[that] it wasn’t the priests, the pundits, the politicians, and the
generals who were creating positive change.”

Rossetto was no stranger to bold predictions. In 1971, he
co-authored a
cover story
in the New York Times
Magazine
 announcing that libertarianism was the next
great transformative ideology and that young people were rejecting
the played-out politics of the right and the left. After editing a
publication called Electric Word in the late 1980s,
he
 and Jane Metcalfe launched Wired, the
publication that not revolutionized magazine design but chronicled,
critiqued, and in many ways created the Internet Age
. The
concept was to cover the real change makers, far from the
halls of power in Washington or established business capitals such
as New York, who were ushering in a new digital era that would
transform society. “That meta-story,” says Rossetto, “was
absolutely spot on.”

View this article.

from Hit & Run http://reason.com/blog/2013/11/22/wireds-louis-rossetto-on-the-death-of-t
via IFTTT

Circular Bubble Logic

Some have suggested that the surge in "bubble-talk" implies there can be no popping of the bubble, Pater Tenebrarum has a different perspective…

Submitted by Pater Tenebrarum of Acting-Man blog,

Interest In Bubbles Makes them Disappear – Like Magic

There comes a time in every bubble's life when participants who have a stake in its continuation have to employ ever more tortured logic to justify sticking with it. We have come across an especially amusing example of this recently. “Good news!” blares a headline at CNBC “Bubble concern is at a 5-year high”. Ironically, since at least 1999 if not earlier, the source of this headline has been referred to as 'bubble-vision' by cynical observers (or alternatively as 'hee-haw'). Let us take a look at what is behind this 'good news' announcement:

“People are more interested in the concept of a "stock bubble" than they've been at any time since the housing bubble collapsed. But ironically, that very concern could be what prevents another bubble from forming anytime soon.

According to Google Trends, worldwide search interest in the term "stock bubble" is higher in November 2013 than in any month since October 2008. The rise in interest is even more pronounced in the United States, where in data going back to 2004, the volume of searches for the term is the highest it's ever been (with the exception of the bubble-period around November 2007.)


Paradoxically, many market participants say this should actually calm those who fret that equities are currently in a bubble. "That means, conclusively, that there is no stock bubble," Jim Iuorio of TJM Institutional Services told CNBC.com. "It means that people aren't caught up in the hysteria of being deluded that there is no bubble, which is the only way that a bubble can exist."


Mark Dow, a former hedge fund manager who writes at the Behavioral Macro Blog, diagnoses investors with a bad case of "disaster myopia."


"If you went through an earthquake, or were mugged, or whatever traumatic event it might be, you overestimate the probability of that event occurring again," Dow said. "It's because we just went through a bubble that everyone's looking for them. Generals always fight the last war, and firemen fight the last fire." Dow similarly believes that the tremendous deal of concern about a bubble will "probably prevent it," at least for a little while.


"It's never obvious, by definition, or you wouldn't get the bubble," he said.

(emphasis added)

At that point we really had to laugh out loud. There is no bubble because people search for the term on Google? Their act of searching for the term will 'prevent a bubble' from forming? Really? No-one seems to have noticed that the 'record high in bubble searches in November 2007 in the US' definitely did not indicate that one shouldn't be concerned.

Before we look at some empirical evidence that immediately blows these notions out of the water, let us briefly look at the basis of such claims. The idea that a 'bubble is never obvious' is obviously wrong, because as a matter of fact, all bubbles are 'obvious' to varying degrees to a great many people. Participants are just never sure how big they will become and all of them are hoping that they will correctly guess when the moment to jump off has arrived. In fact, this article itself – which denies the existence of a bubble – is a perfect example of the rationalizations people use to talk themselves into remaining  enmeshed and invested in the bubble. Note that no-one mentions valuations, monetary policy, or any of the other yardsticks or forces that may be relevant. Instead, the argument is solely based on search trends on Google!

We already briefly discussed behaviorism in a critical appraisement of Robert Shiller's article on economic science (see: “Economics Is a Science”). It is of course true that quite a bit of the decision making on the part of investors and speculators becomes increasingly irrational as an asset bubble progresses. The rationalizations tend to become ever more absurd once it becomes difficult to come up with tenable, rational arguments for remaining invested. It is definitely worth studying these phenomena and being aware of them as an investor.

However, what we must also ask is: are there fundamental economic causes for the formation of bubbles? The Mises Institute recently published an article by Frank Shostak that also takes a critical look at Robert Shiller's theories (we encourage readers to read Mr. Shostak's article in its entirety. Similar to the point we made in our article, he argues that behaviorism is definitely not economics. It belongs to the realm of psychology). A few excerpts:

“[…] at the World Economic Forum in Davos, Switzerland on January 27, 2010, Nobel Laureate in Economics Robert Shiller argued that bubbles could be diagnosed using the same methodology psychologists use to diagnose mental illness. Shiller is of the view that a bubble is a form of psychological malfunction. Hence, the solution could be to prepare a checklist similar to what psychologists do to determine if someone is suffering from, say, depression.


1. Sharp increase in the price of an asset.

2. Great public excitement about these price increases.

3. An accompanying media frenzy.

4. Stories of people earning a lot of money, causing envy among people who aren’t.

5. Growing interest in the asset class among the general public.

6. New era “theories” to justify unprecedented price increases.

7. A decline in lending standards.


What Shiller outlines here are various factors that he holds are observed during the formation of bubbles. To describe a thing is, however, not always sufficient to understand the key causes that caused its emergence. In order to understand the causes one needs to establish a proper definition of the object in question. The purpose of a definition is to present the essence, the distinguishing characteristic of the object we are trying to identify. On this, the seven points outlined by Shiller tell us nothing about the origins of a typical bubble. All that these points do is to provide a possible description of a bubble. To describe an event, however, is not the same thing as to explain it.”

(emphasis added)

This is a key point. Bubbles don't just drop out of the sky because a critical mass of people begins to display symptoms of a kind of mental illness. There is a causative force at work, something that actually enables bubble formation. So what actuates financial asset bubbles? For asset prices to rise sharply, there is a sine qua non, and that is an expansion of the money supply.

As Shostak points out, an expanding money supply diverts resources from wealth-generating activities to activities that end up consuming wealth, as it enables exchanges of nothing (money from thin air) for something (real resources). Monetary pumping by the central bank and credit expansion by fractionally reserved commercial banks are therefore at the root of bubbles from an economic standpoint.

We recently showed this chart of the broad US money supply TMS-2. Take a close look at the period from 2008 to today specifically. We would argue this is prima facie evidence that a bubble is indeed underway.


The History of Google Searches on Bubbles

When reading the CNBC article discussed above, we dimly remembered that Robert Prechter once mentioned that (paraphrasing) “as a bubble matures, there is increasing evidence of bubble talk”.

This is actually to be expected, as asset bubbles tend to exhibit certain repetitive patterns. As they move toward their final stage, corrections as a rule become ever smaller, and the ascent of prices steepens (see this discussion of the 'Sornette bubble model' by John Hussman).  In short, it becomes obvious that something unusual is going on. Those who argue that prices cannot be justified by the fundamental data tend to become more vocal as prices continue to rise above what they regard as fair value and public debate intensifies.

In order to find out if there is any correlation between price peaks and Google searches for the term 'bubble' in the context of specific assets, we decided to take a look for ourselves. The results are surprising.

It seems that peaks in 'bubble searches' slightly precede peaks in the prices of the assets concerned. In other words, a strong surge in 'bubble searches' is definitely not a reason to be complacent. On the contrary, it is a warning sign that a major price peak could be imminent. In the case of stocks, the correlation between 'bubble search' peaks and price peaks is a bit less precise than in the other assets we have looked at, but it is still noteworthy.

Below are several charts illustrating the situation:


Bubble search-oil

Google searches for 'oil bubble' rose strongly as oil approached its 2008 top and peaked exactly one month before the oil price did – click to enlarge.


Bubble search-silver1

The peak of searches for the term 'silver bubble' occurred in April of 2011. The Silver price peaked on the last trading day of April – click to enlarge.


Bubble sea
rch - gold

Searches for 'gold bubble' peaked in August 2011. The gold price peaked in early September – click to enlarge.


Bubble search-stocks

Searches for 'stock market bubble' peaked in May of 2007. The S&P 500 made an initial peak in July, then rose one more time to a slightly higher high in October. Currently searches for 'stock market bubble' are in a strong uptrend, but still remain below previous highs. As this chart shows, the rise into 'search peaks' often happens in a very short period of time, so this bears watching – click to enlarge.


Conclusion:

It definitely cannot hurt to be aware of market psychology and sentiment. However, the argument that a surge in searches for the term 'bubble' on Google can be interpreted as an 'all clear' for a bubble's continuation seems to have things exactly the wrong way around. Moreover, it certainly can neither show that there 'is no bubble', nor can it prevent one, as the economic cause for bubble conditions is money supply growth. One must therefore consider what is happening in the monetary realm when trying to ascertain whether a bubble exists. The misguided behavior of financial market participants that can be observed during bubbles is merely mirroring the clusters of entrepreneurial error monetary pumping brings about.


Addendum: Retail Euphoria

Incidentally, retail investors have recently become quite euphoric. We have  discussed this phenomenon previously, and shown that equity fund flows are usually strongly positively correlated with prices (sell low, buy high is the motto). In the meantime the news has found its way to Bloomberg as well. There is not much that is new here of course, aside from the information on allocation percentages which we found quite interesting: 

“Investors are pouring more money into stock mutual funds in the U.S. than they have in 13 years, attracted by a market near record highs and stung by bond losses that would deepen if interest rates keep rising.


Stock funds won $172 billion in the year’s first 10 months, the largest amount since they got $272 billion in all of 2000, according to Morningstar Inc. estimates. Even with most of the cash going to international funds, domestic equity deposits are the highest since 2004.”


[…]


The market run-up has left investors as a group with an unusually high allocation to equities, at 57 percent, said Francis Kinniry, a principal at Valley Forge, Pennsylvania-based Vanguard Group Inc., the world’s largest mutual-fund company.

Equity allocations were higher only twice in the past 20 years, Kinniry said: in the late 1990s leading up to the technology stock crash of 2000, and prior to the 2007-2009 global financial crisis. He based his calculations on the total amounts of money in mutual funds and exchange-traded funds across asset classes at U.S. Firms.”

(emphasis added)

We hasten to add that the information on recent fund flows should not be regarded as a market timing aid. As we have often pointed out, such information is best characterized as a 'heads-up', a sign that one must pay attention to the fact that risk is on the rise.


via Zero Hedge http://feedproxy.google.com/~r/zerohedge/feed/~3/njvf-sZ9088/story01.htm Tyler Durden

Regulators Watch Porn and Literally Sleep with Industry They’re Supposed to Rein In … Instead of Protecting the Public

The Washington Times reported yesterday that Nuclear Regulatory Commission workers watch porn instead of cracking down on unsafe conditions at nuclear plants.

That’s not an isolated problem …

We noted last year:

Investigators from the Treasury’s Office of the Inspector General found that some of the regulator’s employees surfed erotic websites, hired prostitutes and accepted gifts from bank executives … instead of actually working to help the economy.


Likewise, senior SEC employees spent up to 8 hours a day surfing porn sites instead of cracking down on financial crimes.


The Minerals Management Service – the regulator charged with overseeing BP and other oil companies to ensure that oil spills don’t occur – was riddled with “a culture of substance abuse and promiscuity”, which included “sex with industry contacts.

The biggest companies own the D.C. politicians.  Indeed, the head of the economics department at George Mason University has pointed out that it is unfair to call politicians “prostitutes”.  They are in fact pimps … selling out the American people for a price.


via Zero Hedge http://feedproxy.google.com/~r/zerohedge/feed/~3/GqVXyT-uJBU/story01.htm George Washington

Which Is It? According To The BLS, The Average Monthly Job Gain In 2013 Is Either 184K Or 20% Lower

Back in September in “This Is What Happens When The Bureau Of Labor Statistics Is Caught In A Lie” (a topic that has gained substantial prominence recently), we concluded our series exposing BLS data “massaging”, when as we predicted the monthly JOLTS survey, which had been trending at an implied monthly job gain of 140K and diverging massively from the NFP average of 198K, as can be seen on the chart below…


… finally caught up with reality, resulting in the single biggest monthly outlier in the data stream in the history of the survey.

To be sure, we explicitly warned ahead of time that a massive data revision was imminent as never before had two congruent series diverged so spectacularly. Specifically we said “This means that either the JOLTS survey is substantially under-representing the net turnover of workers, or that once the part-time frenzy in the NFP data normalizes, the monthly job gains will plunge to just over 100K per month to “normalize” for what has been a very peculiar upward “drift” in the NFP “data.”

Even Bill Gross read our prior post on the topic from August and tweeted his personal observations:

Of course, now that this record outlier is in the history books, it is in the BLS’ interest to slowly but surely “massage” it out with historical revisions. And following today’s just released most recent JOLTS report, the BLS has started to make sure that its own two key job datasets no longer diverge so much as to make a completely mockery of its “data” collection and analysis. This is shown in the chart below.

We are confident that with every passing month, silent revisionist history will allow the BLS to smooth out all the prior “data” until the July “sore thumb” outlier is perfectly subsumed in the trailing average. Which is why will keep the original data as long as needed to keep reminding the BLS that someone keeps watch.

But while the above is indicative of BLS data manipulation, both concurrent and historic, a bigger issue is that even with the adjusted data, there is still a rather notable problem when it comes to reports of the US employment.

The reason is that as we have been explaining for the greater part of 2013, the data sets showing NFP job gains and the Net turnover from JOLTS (hires less separations) has to by definition match. And for the most part it has as can be seen in the chart from the start of 2011:

What is not evident on the chart above is what happens when one zooms in only on the data in 2013, and specifically what the average monthly job gain is per the BLS’ nonfarm payrolls report on one hand – perhaps the most watched number in history now that the Fed’s tapering and perhaps QE-ending decisions all are “data dependent” just on this series – and what the JOLTS Net Turnover series shows.

It shows the following:

In short: from January to September (we exclude the October 204K print as there is no matching JOLTS number yet) the average monthly jobs gain per the Non-farm Payrolls report is 184K. However, when looking at the implied job gains per the JOLTS Net Turnover, this number is a far more disturbing 150K, some 20% lower.

Keep in mind this is using the adjusted, post-revision data, prior to which JOLTS suggested an average monthly gain as low as 125K.

This is a crucial difference and one which may be very critical in the eyes of the Fed when deciding on whether or not to taper in December, or March. Because now that we have entered a period in which the Fed itself is talking down the impact of “overoptimistic” jobs data in an attempt to delay tapering as much as possible, even invoking the labor force participation rate as a mitigating factor in the unemployment rate drop, what Bernanke and soon Yellen need, is another core data series showing the reality is actually worse than is being represented.

And what better source than the BLS’ own “secondary” survey of jobs?

Finally, one wonders: why does the NFP report so persistently over-represent jobs and under-represent employment? Because if the only purpose of US economic data is to serve a political agenda, one can see why the only variable that matters in the New Normal is the Fed.


via Zero Hedge http://feedproxy.google.com/~r/zerohedge/feed/~3/lJh7AMf-rPg/story01.htm Tyler Durden

Science Supports Using Video Games as a Babysitter*

And it might save money on driving lessons. Think about it!The latest research into the
impact of video games on children’s minds comes from studying the
behavior of more than 11,000 children between the ages of 5 and 7
across the United Kingdom. That’s a pretty big pool. Their
conclusion: No correlation between playing video games and any sort
of conduct problems whatsoever. The study also focused on
television viewing and determined that kids who watch lots of
television but don’t play video games were more likely to have
conduct problems than those who do play video games.

The study from the University of Glasgow is available
here
(pdf) and is a fairly easy read. As with any mass study
like this, there are some gaps. Because of the voluntary scope of
participation, the sampling isn’t fully representative and depended
on the accuracy of information reported by the children’s mothers.
They separated children by gender and by how much time they spent
each day playing video games or watching television. They evaluated
the “psychosocial adjustment” of participants in several categories
to determine emotional or conduct problems after they reached 7
years. They really did not find that much, but they did note:
“Children playing no games were more likely to show increased
problems (except peer problems) compared with playing [less than
one hour] daily.” The only statistically significant association
they discovered was among children who watched three or more hours
of television a day. They showed more conduct problems, but even
then the number was low. And they didn’t notice any difference
based on gender.

Still though, the total gaming exposure of these young kids is
pretty low – less than four percent reported playing video games
for more than three hours per weekday. The game panic these days is
focused on teens who go on marathon Call of Duty binges
for hours on end. I don’t see this study taking the wind out of
that argument, but it could come a as a relief to parents who feel
judged by those media nannies suggesting that their little loved
ones are being turned into monsters by their Nintendo Wii.

* No, of course it doesn’t.

from Hit & Run http://reason.com/blog/2013/11/22/science-supports-using-video-games-as-a
via IFTTT

Dollar's 30 Year Slide May Be Gold's New Life: 2014 Outlook

Today’s AM fix was USD 1,241.75, EUR 918.59 and GBP 766.75 per ounce.
Yesterday’s AM fix was USD 1,248.50, EUR 929.64 and GBP 775.76 per ounce.

Gold fell $1.50 or 0.12% yesterday, closing at $1,243.20/oz. Silver climbed $0.14 or 0.71% closing at $19.99/oz. Platinum rose $4.60 or 033% to $1,389.50/oz, while palladium climbed $3.78 or 0.53% to $714.75/oz.

Download here: Talking Real Money: Barter v Bitcoin

Many traders and investors are still scratching their heads at the peculiar gold trading Wednesday which pushed gold below the important technical level of $1,250/oz. Support at $1,250/oz has been breached and gold is vulnerable of a fall to test support at $1,200/oz and the June 28th low of $1,180/oz (see charts below).


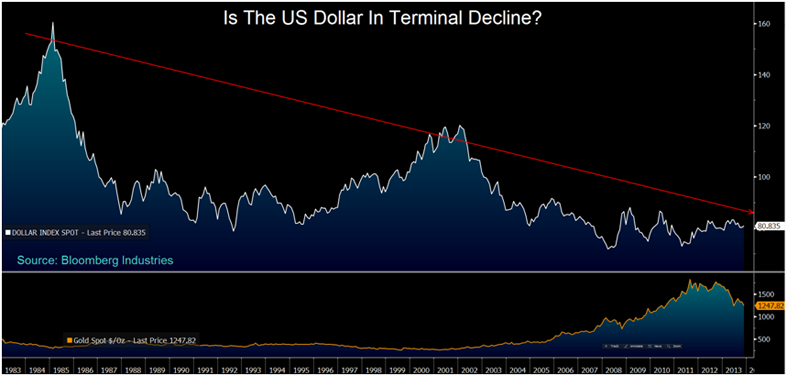
US Dollar Index – 1983 to Today (Bloomberg Industries)
 
And yet gold still seems to be stuck in a downtrend. This week’s sell off may have been due to trading shenanigans on the COMEX and many, including the UK Financial Regulator are asking questions as to whether gold price rigging is taking place.

Gold’s falls come despite there being many compelling reasons for gold to rally. These include uber dove Yellen at the Fed’s helm, the near certainty that the Eurozone debt crisis will erupt early in the New Year, signs ETF outflows are stabilizing and China picking up the slack with regard to physical demand, after India’s demand fell from near record levels.


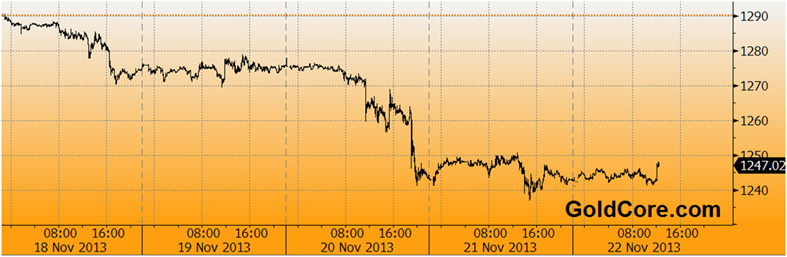
Gold in U.S. Dollars, 5 Days – (Bloomberg)

THE U.S. DOLLAR has been on a 30 year slide versus other competing paper currencies, in particular the Chinese yuan. If the dollar’s decline, as measured by the DXY Index continues, gold may be the main beneficiary.

The dollar may be printed in unlimited quantities, though the global stock of gold increases by just 2% to 2.5% annually. Irrespective, of the huge increase in money supplies globally today. Indeed, should gold prices fall more, gold production is likely to begin falling.

This is seemingly lost on Janet Yellen and central banks, who continue to print money at record rates.

The smart money who understand gold’s importance as a diversification continue to accumulate gold.

The very poor state of the U.S. economy bodes badly for the U.S. dollar in 2014 which should help gold resume its multi year bull market.


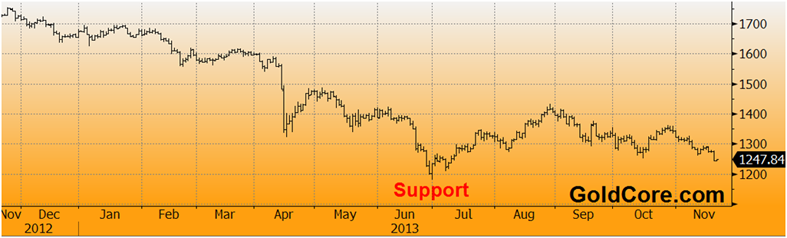
Gold in U.S. Dollars, 1 Year – (Bloomberg)

DATA FROM THE INTERNATIONAL MONETARY FUND today shows that central banks continued to diversify into gold in October.

Turkey’s holdings rose the most, with the central bank adding a large 12.994 tonnes – 16.18 million oz vs. 15.762 million oz.  Kazakhstan’s gold reserves rose 2.4 tons and Azerbaijan’s gold reserves increased 2 tonnes last month.

Germany, the world’s second biggest holder of gold reserves, cut its bullion holdings by a tiny amount in October for the second time in five months.  Germany’s gold holdings dropped to 108.9 million ounces from 109.01 million ounces in September. The reduction was likely for domestic gold coin sales.


Gold in U.S. Dollars  and Suspensions Of COMEX Gold Trading – 3 Month (Bloomberg)

GOLDMAN SACHS Inc. has come out with another of their widely covered market predictions.

Gold, iron ore, soybeans and copper will probably drop at least 15% next year as commodities face increased downside risks even as economic growth in the U.S. accelerates, according to Goldman.

As we noted before, Goldman’s gold calls and crystal gazing have been poor at best. Indeed, some suspect that while Goldman is advising clients to sell, they may be on the other side of the the trade going long.

News This Week
* China to Start Interbank Gold Swap Trading November 25
China, on track to overtake India as the world’s largest gold consumer this year, will start interbank swaps trading next week in a move to further open up the domestic precious metals market. China gold swaps to trade on China Foreign Exchange Trade System, according to a statement on CFETS website yesterday. Gold swaps to settle and deliver via Shanghai Gold Exchange.
(Bloomberg)

* China’s planned crude oil futures may be priced in yuan 
 The Shanghai Futures Exchange (SHFE) may price its crude oil futures contract in yuan and use medium sour crude as its benchmark, its chairman said on Thursday, adding that the bourse is speeding up preparatory work to secure regulatory approvals.

China, which overtook the United States as the world’s top oil importer in September, hopes the contract will become a benchmark in Asia and has said it would allow foreign investors to trade in the contract without setting up a local subsidiary.
(Reuters)

* Germany Lowers Gold Reserves in October, IMF Data Show
Holdings drop to 108.9 Million ounces vs. 109.01 Million ounces in September., data on IMF website show. (Note: Likely for domestic gold coin sales)
(Bloomberg)

* Gold-Put Options Surge as Futures Slump to Lowest in Four Months
Put options on gold, giving the owners the right to sell Dec. futures at $1,200/oz and $1,250/oz, more than tripled on the Comex in New York after the metal slumped to a four-month low.
Puts giving the owner the right to sell at $1,200 rose to $2.30 from 70c on estimated volume of 1,259 contracts, the third most-active option.

Puts giving the owner the right to sell at $1,250 jumped to $15.10, the highest in a month, on estimated volume of 2,206 contracts, the most-active option
Futures for Dec. delivery fell as much as 2.6% to $1,240.20/oz, the lowest since July 9
(Bloomberg)

* China Oct. Silver Imports 230.8 Tons, Customs Says
Silver imports by China were 230.8 tons in Oct., compared with 243 tons in Sept., according to data released by customs agency today
(Bloomberg)

* UBS Estimates 36% of South Africa Gold Industry is Losing Money
Estimate based on spot price of $1,260/oz, UBS says in report dated yday.
In 3Q, 28% of SA gold industry was loss-making, based on gold price of $1,330/oz
Sector lowered 3Q all-in costs by 20% q/q to $1,138/oz
“Further unit cost reductions will be challenging to deliver”
(Bloomberg)

* CME Lowers Gold and Silver Margins
CME lowers Comex 100 Gold futures (GC) initial margins for specs by 9.4 percent to $7,975 per contract from $8,800
CME lowers Comex 5000 Silver futures (SI) initial margins for specs by 11.1 percent to $11,000 per contract from $12,375
(Reuters)

Conclusion
There is likely a floor under gold prices at the $1,200 level and that should again provide strong support. There are no guarantees regarding price ever – particularly in the short term. However, gold production may fall at prices below $1,200 as it becomes uneconomical for man
y gold mines to operate profitably.

In South Africa, no longer the world’s largest producer, (which is now China) but still a major producer, there are estimates that 36% of the South African gold industry are loss making even at today’s spot prices – $1,250/oz. In 3Q, 28% of the South African gold industry was loss making, based on a gold price of $1,330/oz.

The short term technicals remain poor and the trend remains lower so we remain bearish for next week despite the strong seasonals. November, December and January are traditionally strong months for gold due to year end fund allocation and in recent years Chinese New Year demand.

It remains prudent to ignore short term noise and day to day price movements. Instead focus on physical gold’s importance, either in your possession or in allocated gold accounts, as financial insurance and as a vital diversification for investors and savers today.

Download here: Talking Real Money: Barter v Bitcoin

Click Gold News For This Week’s Breaking Gold And Silver News
Click Gold and Silver Commentary For This Week’s Leading Gold, Silver Opinion
Like Our Facebook Page For Interesting Insights, Blogs, Prizes and Special Offers


via Zero Hedge http://feedproxy.google.com/~r/zerohedge/feed/~3/60xAd5YJI10/story01.htm GoldCore