The "Oh Crap" Moment For Housing Is Now In The Can

Real estate guru Mark Hanson updates his housing view following this week’s dismal housing industry data: 

  • Sept. Pending Sales… the largest MoM drop since Sept 2001… not 2011… yes, 2001.

Don’t let them tell you ‘this is normal for Sept’. The ‘oh-crap’ moment is now in the can. Going forward, “Existing Sales” volume will disappoint on a YoY basis for several quarters. There is no way around it…


Fool me once, shame on you; fool me twice, shame on me; fool me thrice, shame on the Fed…


Via Mark Hanson,

Existing Sales is terribly backward looking and you can’t change history no matter how hard certain parties try.

‘House Prices’ have already fallen sharply post-surge and continue to weaken — prices are set at contract but not recorded until “closing” — simply awaiting printing by lagging surveys.

Contrary to ‘New’ Home Sales, Existing Sales are where the Fed’s go-go juice really showed up thanks to the Twist/QE 3, 4 increase in “purchasing power” beginning in Q4 2011 and the new-era “investor” rush to market in mid-2012. This is evident in the demand divergence between the two series. As such, the “post-surge” housing market “demand collapse” will be much more evident in this series than it was by the 27% MoM drop in New Home Sales in July. 

In short, over the next few months we will see the two series quickly “converge” — Existing Sales weaken considerably to be more in-line with the weak builder demand — reflecting conditions more akin to the “hangover” period following the sunset of the Homebuyer Tax Credit

Along with this comes lower YoY Existing and New Sales volume along with down trending MoM house prices as far out as July 2014, at which point house prices have a good shot at being negative YoY as well.

Sept Pending Home Sales Low-lights

1) US Pendings Fell 21.1% MoM on an NSA basis (down more not including last month’s revision), the most on record for any Sept since Sept 2001…that’s a terrible period to comp against. 

2) On a YoY basis Pendings were down 4.3% on a daily basis (Sept 2013 had 1 extra business day YoY). And remember, in Sept demand was still being pulled forward due to rates and fear of Gov’t shutdown.

3) Levels of Sept Pendings virtually ensure Oct through April Existing Sales” are lower YoY. A year ago volume outperformed (muted seasonality) in winter & spring, as new-era “investors” all dove in at the same time. This year the market will underperform (heavier than normal seasonality) due to the stimulus “hangover”. This delta will produce meaningful YoY Existing Sales declines especially through April 2014.

4) Leading indicating Western region absolute Pending Sales lowest since 2007. 

5) Heavily weighted, leading-indicating Northeast & West Sept Pendings down 31% & 20% MoM NSA respectively, also 12-year record drops.

6) YoY, Northeast & West Pendings down YoY by 3.1% and 5.2% respectively…the first YoY drop since after the 2010 sunset of the Homebuyer Tax Credit.

7) MoM, Sept national Pendings dropped 54% and 40% more than the 10-year average and post housing market crash avg Sept respective seasonal drops.

**note, items 5 & 6 were straight from NAR and not normalized for more business days this Sept than last. In short, the YoY drop is larger than reflected in 5 & 6.


via Zero Hedge http://feedproxy.google.com/~r/zerohedge/feed/~3/pEjnFO5MFc8/story01.htm Tyler Durden

The “Oh Crap” Moment For Housing Is Now In The Can

Real estate guru Mark Hanson updates his housing view following this week’s dismal housing industry data: 

  • Sept. Pending Sales… the largest MoM drop since Sept 2001… not 2011… yes, 2001.

Don’t let them tell you ‘this is normal for Sept’. The ‘oh-crap’ moment is now in the can. Going forward, “Existing Sales” volume will disappoint on a YoY basis for several quarters. There is no way around it…


Fool me once, shame on you; fool me twice, shame on me; fool me thrice, shame on the Fed…


Via Mark Hanson,

Existing Sales is terribly backward looking and you can’t change history no matter how hard certain parties try.

‘House Prices’ have already fallen sharply post-surge and continue to weaken — prices are set at contract but not recorded until “closing” — simply awaiting printing by lagging surveys.

Contrary to ‘New’ Home Sales, Existing Sales are where the Fed’s go-go juice really showed up thanks to the Twist/QE 3, 4 increase in “purchasing power” beginning in Q4 2011 and the new-era “investor” rush to market in mid-2012. This is evident in the demand divergence between the two series. As such, the “post-surge” housing market “demand collapse” will be much more evident in this series than it was by the 27% MoM drop in New Home Sales in July. 

In short, over the next few months we will see the two series quickly “converge” — Existing Sales weaken considerably to be more in-line with the weak builder demand — reflecting conditions more akin to the “hangover” period following the sunset of the Homebuyer Tax Credit

Along with this comes lower YoY Existing and New Sales volume along with down trending MoM house prices as far out as July 2014, at which point house prices have a good shot at being negative YoY as well.

Sept Pending Home Sales Low-lights

1) US Pendings Fell 21.1% MoM on an NSA basis (down more not including last month’s revision), the most on record for any Sept since Sept 2001…that’s a terrible period to comp against. 

2) On a YoY basis Pendings were down 4.3% on a daily basis (Sept 2013 had 1 extra business day YoY). And remember, in Sept demand was still being pulled forward due to rates and fear of Gov’t shutdown.

3) Levels of Sept Pendings virtually ensure Oct through April Existing Sales” are lower YoY. A year ago volume outperformed (muted seasonality) in winter & spring, as new-era “investors” all dove in at the same time. This year the market will underperform (heavier than normal seasonality) due to the stimulus “hangover”. This delta will produce meaningful YoY Existing Sales declines especially through April 2014.

4) Leading indicating Western region absolute Pending Sales lowest since 2007. 

5) Heavily weighted, leading-indicating Northeast & West Sept Pendings down 31% & 20% MoM NSA respectively, also 12-year record drops.

6) YoY, Northeast & West Pendings down YoY by 3.1% and 5.2% respectively…the first YoY drop since after the 2010 sunset of the Homebuyer Tax Credit.

7) MoM, Sept national Pendings dropped 54% and 40% more than the 10-year average and post housing market crash avg Sept respective seasonal drops.

**note, items 5 & 6 were straight from NAR and not normalized for more business days this Sept than last. In short, the YoY drop is larger than reflected in 5 & 6.


via Zero Hedge http://feedproxy.google.com/~r/zerohedge/feed/~3/pEjnFO5MFc8/story01.htm Tyler Durden

Indian Inflation: Out of Control?

Click here to follow ZeroHedge in Real-time on FinancialJuice

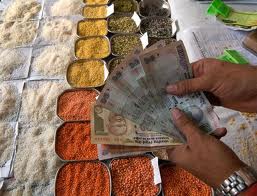
While some harp on about the growing dangers of yet another housing bubble in the western world, there are other more important things perhaps that are going on in other countries in the world. But, they are of little interest since we are not directly concerned by them. How is it that we only care about what’s actually happening in the back yard while someone round the block might be doing something or on the receiving end of something pretty bad and yet we don’t give a damn about what happens to them? While we are concerned with our bubbles, there are people in India that are suffering from the rise in prices that is drastically changing the way they live.

Over the past year inflation has been driven up by food prices. In September alone food prices were at their highest level for the past seven months and it seems that India is now going through the worst financial crisis that it has ever experienced since 1991.

  • The Indian wholesale price index (WPI) rose by 6.46% in September.
  • This was largely due to the fact that food prices have increased beyond control.
  • Since the start of this year onions have increased by 322%, for example.
  • Food prices have increased by an annual rate of 18.4% so far according to data released by the Indian government on Monday this week.

Food prices have been increasing due to supply shortages in India which were brought about to climatic conditions and rain. Today the price of a kilogram of onions amounts to 75 rupees today (or $1.22). One third of the Indian population still earns less than $1.25 per day in the country and that means that buying basic foodstuffs is pretty much out of their price range today. Food prices have hit the political agenda as a result and have been made a key issue in the run-up to the general elections that are going to take place within the next 7-month period.

Food Inflation in India

Food Inflation in India

Traders and shop owners are reaping the rewards of a rapid rise in prices today. But, the shopkeepers will not be able to keep hiking prices to recoup on the price increases as the people will run out of money. The real people are at the short end of the stick and suffering from the consequences of the hike that is almost daily now.

India is not the only one suffering from high inflation today in the world. Other emerging countries have also recently seen highs in their own rates. China had a consumer-inflation rate that hit3.1% in September. That was also the highest it had been for the past seven months. Food prices in China have increased by6.1% so far this year. However, in comparison with Indian data, that seems as if it is insignificant.

  • India is having immense difficulty increasing economic growth in the country and it has a 5%-growth rate that hasn’t been seen for the past decade.
  • The rupee has already hit lows that have rarely been seen before (it has lost 10% since the start of the year against the dollar) and inflation looks as if it will be fuelled by the interest rates that have been increased by theReserve Bank of India.
  • There has been a general outflow of capital from India since the start of this year due to the slow-down in the economy.
  • Inflation stood at 2.1% in September for India and it’s that which is the most worrying element perhaps today (at least for the population).

While India has problems with its economy and price stability, it’s the people that will be suffering the most. When food prices increase and they get out of control, it’s the third of the population that is living with just over a dollar a day that will have trouble making ends meet more than they already did in the past.

Originally posted: Indian Inflation: Out of Control?

You might also enjoy: Greenspan Maps a Territory Gold Rush or Just a Streak? | Obama’s Obamacare: Double Jinx | Financial Markets: Negating the Laws of Gravity  |Blatant Housing-Bubble: Stating the Obvious | Let’s Downgrade S&P, Moody’s and Fitch For Once | US Still Living on Borrowed Time | (In)Direct Slavery: We’re All Guilty | The Nobel Prize: Do We Have to Agree? | Revolution Costs | Petrol Increase because Traders Can’t Read | Darfur: The Land of Gold(s) | Obamacare: I’ve Started So I’ll Finish | USA: Uncle Sam is Dead | Where Washington Should Go for Money: Havens | Sugar Rush is on | Human Capital: Switzerland or Yemen? |

Technical Analysis: Bear Expanding Triangle | Bull Expanding Triangle | Bull Falling Wedge Bear Rising Wedge High & Tight Flag


via Zero Hedge http://feedproxy.google.com/~r/zerohedge/feed/~3/Im1dVrndkFE/story01.htm Pivotfarm

Guest Post: Should Extremist Parties Be Banned?

Following the slaying of two members of Greece’s far-rght Golden-Dawn party (and wounding of a third) on Friday evening, the Greek government’s crackdown on the country’s ‘extremist’ party has revived a vexing question that seemed to have disappeared with the Cold War’s end: Is there a place within liberal democracies for apparently anti-democratic parties?


Via AP,

Police investigating the slaying of two members of the far-right Golden Dawn party and the wounding of a third say the gun used in the Friday evening attack had not been used in previous terrorist attacks.


The assailant fired 12 rounds from a Zastava Tokarev type semi-auto pistol, police say.


A police source, speaking on condition of anonymity because officers were not authorized to comment on the ongoing investigation, said Saturday that a video from a nearby security camera confirmed accounts from Golden Dawn lawmakers that the assailant started firing from 15 meters (yards) away and finished off his victims from point-blank range. The gunman fired at a fourth Golden Dawn member, who managed to enter a building unharmed.

One can’t help but get the sense their is a growing ‘instigation’ of more killing in Greece, which got us thinking of the following discussion…


Authored by Jan-Werner Mueller, originally posted at Project Syndicate,

Should Extremist Parties Be Banned?

To be sure, liberal democracies have felt threatened since communism collapsed in 1989 – but mostly by foreign terrorists, who tend not to form political parties and sit in these countries’ parliaments. So, should extremist parties that seek to compete within the democratic framework be outlawed, or would such a restriction on freedom of speech and association itself undermine this framework?

Above all, it is crucial that such decisions be entrusted to non-partisan institutions such as constitutional courts, not other political parties, whose leaders will always be tempted to ban their competitors. Unfortunately, the moves against Golden Dawn are mostly identified with the government’s interests, rather than being perceived as the result of careful, independent judgment.

On the face of it, democratic self-defense seems a legitimate goal. As US Supreme Court Justice Robert Jackson (who was also the chief US prosecutor at Nuremburg) put it, the constitution is not “a suicide pact” – a sentiment echoed by the Israeli jurist Aharon Barak, who emphasized that “civil rights are not an altar for national destruction.”

But too much democratic self-defense can ultimately leave no democracy to defend. If the people really want to be done with democracy, who is to stop them? As another US Supreme Court justice, Oliver Wendell Holmes, put it, “if my fellow citizens want to go to Hell, I will help them. It’s my job.”

So it seems that democracies are damned if they ban and damned if they do not ban. Or, in the more elevated language of the twentieth century’s most influential liberal philosopher, John Rawls, this appears to be a “practical dilemma which philosophy alone cannot resolve.”

History offers no clear lessons, though many people like to think otherwise. In retrospect, it appears obvious that the Weimar Republic might have been saved had the Nazi Party been banned in time. Joseph Goebbels, Hitler’s propaganda minister, famously gloated after the Nazis’ legal Machtergreifung (seizure of power): “It will always remain one of the best jokes of democracy that it provided its mortal enemies with the means through which it was annihilated.”

But a ban might not have halted the German people’s general disenchantment with liberal democracy, and an authoritarian regime still might have followed. Indeed, whereas West Germany banned a neo-Nazi party and the Communist Party in the 1950’s, some countries –particularly in Southern and Eastern Europe, where dictatorship came to be associated with the suppression of pluralism – have drawn precisely the opposite lesson about preventing authoritarianism. That is one reason why Greece, for example, has no legal provisions for banning parties.

The fact that Greece nonetheless is effectively trying to destroy Golden Dawn – the parliament just voted to freeze the party’s state funding – suggests that, in the end, most democracies will want to draw the line somewhere. But just where, exactly, should it be drawn?

For starters, it is important to recognize that the line needs to be clearly visible before extremist parties even arise. If the rule of law is to be upheld, democratic self-defense must not appear ad hoc or arbitrary. Thus the criteria for bans should be spelled out in advance.

One criterion that seems universally accepted is a party’s use, encouragement, or at least condoning of violence – as was evidently the case with Golden Dawn’s role in attacks on immigrants in Athens. There is less consensus about parties that incite hatred and are committed to destroying core democratic principles – especially because many extremist parties in Europe go out of their way to emphasize that they are not against democracy; on the contrary, they are fighting for “the people.”

But parties that seek to exclude or subordinate a part of “the people” – for example, legal immigrants and their descendants – are violating core democratic principles. Even if Golden Dawn – a neo-Nazi party in appearance and content – had not engaged in violence, its extreme anti-immigrant stance and its incitement of hatred at a moment of great social and economic turmoil would have made it a plausible candidate for a ban.

Critics warn of a slippery slope. Any disagreement with a government’s immigration policy, for example, might eventually be deemed “racist,” resulting in curtailment of freedom of speech. Something like the classic American standard – the speech in question must pose a “clear and present danger” of violence – is therefore essential. Marginal parties that are not connected to political violence and do not incite hatred should probably be left in peace – distasteful as their rhetoric may be.

But parties that are closer to assuming power are a different matter, even if banning them might automatically appear undemocratic (after all, they will already have deputies in parliaments). In one famous case, the European Court of Human Rights agreed with the banning of Turkey’s Welfare Party while it was the senior member of a governing coalition.

It is a myth that bans turn leaders of extremist parties into martyrs. Very few people can remember who led the postwar German neo-Nazis and Communists. Nor is it always the case that mainstream parties can cut off support for extremists by selectively coopting their complaints and demands. Sometimes this approach works, and sometimes it does not; but it always amounts to playing with fire.

Banning parties does not have to mean silencing citizens who are tempted to vote for extremists. Their concerns should be heard and debated; and sometimes banning is best combined with renewed efforts at civic education, emphasizing, for example, that immigrants did not cause Greece’s woes. True, such measures mi
ght come across as patronizing – but such forms of public engagement are the only way to avoid making anti-extremism look like extremism itself.


via Zero Hedge http://feedproxy.google.com/~r/zerohedge/feed/~3/IBAM8Vhz6G8/story01.htm Tyler Durden

The Fallacies Of Forward Guidance

With the recent adoption of explicit forward guidance as a stimulative policy tool by the major European central banks, virtually every major central bank is now using the tool in some form. The potential benefits and dangers of such policies as central bank communications have evolved are unclear as "the form of guidance" matters. As Robin Brooks notes, and is so well illusrated below in the example of the Riksbank's and Norges Bank's 'failures', "[In terms of implications for rates] the jury is still out on how well forward guidance works. What is clear, though, is that markets prefer 'deeds' to 'words'."

Forward Guidance has become extremely important

As Central bank communications (whether at extremes of policy or not) have evolved dramatically over the past 20 years…

(click image for massive legible version)

Especially intriguing is Janet Yellen's note:

As recently as two decades ago, most central banks actively avoided communicating about monetary policy. According to Janet Yellen, the current Vice Chair of the Federal Reserve who was recently nominated to succeed Chairman Bernanke: “Montagu Norman, governor of the Bank of England in the early 20th century, reputedly lived by the motto “never explain, never excuse”.


The conventional wisdom among central bankers was that transparency was of little benefit for monetary policy and, in some cases, could cause problems that would make policy less effective.

Source: Janet Yellen, Speech: “Communication in Monetary Policy”,
April 4, 2013.

We have little historical precedent for judging the efficacy if explicit forward guidance. However, as Goldman Sachs notes, Norway’s Norges Bank introduced a form of forward guidance in 2005, while Sweden’s Riksbank followed soon after in 2007; and so we look to how well their "guidance" has fit reality (or shaped markets at the time)…

Lessons From Forward Guidance Pioneers

Forward guidance is not a policy reserved for only extreme situations. Indeed, well ahead of the global financial crisis and before the “zero lower bound” of policy rates motivated some central banks to explore the role of communication tools to achieve further easing,

Explicit but conservative

The Scandinavian central banks’ form of forward guidance is among the most explicit in nature: both Norges Bank and the Riksbank publish a “policy rate path” several times a year detailing the level of the policy rate expected by the (majority) of the Executive Board of the central bank over their forecast horizon (around three years). In addition, the Scandinavian central banks publish a range of economic forecasts, such as growth, inflation, the output gap and the unemployment rate.

Although the form of forward guidance may be one of the most explicit currently in place, the nature is more conservative: the “policy rate path” is a conditional estimate of future policy rates – based on the economy and market conditions – not a commitment.

With no intention of attempting to “tie their hands” in the way that Fed-style forward guidance aims to do by promising to keep rates “lower for longer” than would normally be the case, Norges Bank and the Riksbank maintain full discretion at all times. Forward guidance in Scandinavia is therefore a pure communication tool rather than an innovation in monetary policy strategy.

Relevant for the ECB?

Scandinavian central banks’ lengthy experience with forward guidance may be more relevant for the ECB’s nascent forward guidance than what one might immediately think. While the ECB’s style of forward guidance is rather vague, stating only that policy rates will remain at current or lower levels for an “extended period of time”, compared to the Scandinavian central banks’ detailed policy rate paths, both the ECB and Norges Bank/the Riksbank maintain full discretion of their policy rates at all times.

This is a crucial similarity. And with a shared fundamental underpinning of forward guidance, the Scandinavian experience may shed light on whether a more explicit form of forward guidance by the ECB, while maintaining full discretion, might help the ECB more effectively influence Euro area money market rates.

Gains from transparency despite discretion

A look at how past shifts in the Riksbank’s published policy rate path have impacted market pricing suggests that changes to the policy rate path can be just as important to shaping forward market pricing as changes to actual policy rates. Because the form of communication at the Riksbank is so explicit, this experience provides a likely upper bound to what can be achieved (e.g., by the ECB) with a fully transparent form of forward guidance that still allows for full discretion.


While we do not expect the ECB to adopt much more explicit forward guidance, let alone to actually publish a policy rate path any time soon, the Riksbank experience suggests that the ECB’s impact on market rates may be enhanced by increasing the information available to the market regarding the ECB’s view of future likely policy developments. This could take the form of increasing the length of the ECB’s forecast horizon (currently only between 1 to 2 years) or providing a greater account of the Governing Council’s deliberations.


[ZH: While the result is still out, one thing seems very clear from the two charts above… Central bank "forward guidance" appears always and forever overly-confident of their ability (or willingness) to tighten…]


  &nbsp
; 


via Zero Hedge http://feedproxy.google.com/~r/zerohedge/feed/~3/QC8qjWwfvyU/story01.htm Tyler Durden

Top Obama Donor Gets Paid To Fix Obamacare Website After Blowing It Up

The ironically-named Quality Software Services Inc (QSSI) responsible for the SNAFU that is the Obamacare website’s data hub has, incredibly, been named the new general contractor in charge off repairing the glitch-plagued HealthCare.gov. As The NY Post reports, as if the $150 million so far paid to this UnitedHealth subsidiary for its farcically bad implementation was not enough, the executive vuce president of the firm (Anthony Welters) and his wife were among Obama’s largest personal campaign contributors during the 2008 election cycle (and the firm has spent millions “lobbying” for Obamacare). The cronyism runs deep as the Post also notes, visitor logs show at least a dozen visits between the two by the end of 2012, the most recent information available.


The man at the center of the “cronyism”… Anthony Welters


Via NY Post,

A tech firm linked to a campaign-donor crony of President Obama not only got the job to help build the federal health-insurance Web site — but also is getting paid to fix it.


Anthony Welters, a top campaign bundler for Obama and frequent White House guest, is the executive vice president of UnitedHealth Group, which owns the software company now at the center of the ObamaCare Web-site fiasco.


UnitedHealth Group subsidiary Quality Software Services Inc. (QSSI), which built the data hub for the ObamaCare system, has been named the new general contractor in charge of repairing the glitch-plagued HealthCare.gov.


Welters and his wife, Beatrice, have shoveled piles of cash into Obama’s campaign coffers and ­apparently reaped the rewards.


The couple have been frequent guests at the White House.


Visitors logs show at least a dozen visits between the two by the end of 2012, the most recent information available.


The entire Welters family has gotten into the donation game.


The Welters, along with their sons, Andrew and Bryant, have contributed more than $258,000 to mostly Democratic candidates and committees since 2007.


What’s more, UnitedHealth Group is one of the largest health-insurance companies in the country and spent millions lobbying for ObamaCare.


The insurance giant’s purchase of QSSI in 2012 raised eyebrows on Capitol Hill, but the tech firm nevertheless kept the job of building the data hub for the ObamaCare Web site where consumers buy the new mandatory health- ­insurance plans.


QSSI has been paid an estimated $150 million so far, but officials couldn’t say how much more the company might collect on the ­repair contract.


via Zero Hedge http://feedproxy.google.com/~r/zerohedge/feed/~3/h3KZCM_am7w/story01.htm Tyler Durden

China's Gold Hoarding Continues: Over 2,200 Tons Imported In Two Years

Paper gold in the developed world may trade based on the whims of marginal momentum chasers, and of course, the daytrading mood of the BIS gold and FX trading desk, but when it comes to physical gold and China’s appetite for it, one word explains it best: unstoppable.

After rising to a gross 131 tons imported from Hong Kong alone in August, which was the second highest ever monthly import tally, September saw a modest decline to “only” 116 tons: “only” because it is still 67% more than the amount imported a year earlier. 

The total gross imports since September 2011 is now a whopping 2232 tons. Why September? Because that is when we posted: “Wikileaks Discloses The Reason(s) Behind China’s Shadow Gold Buying Spree.” The chart below confirms precisely said reason.

The gross imports year to date are now over 1,113 tons, 91.3% more than the amount of gold imported through September of 2012.

Netting out exports to Hong Kong, September was virtually unchanged from August, at 109 metric tons vs 110 a month earlier. In other words, September was tied for the third highest net import month in Chinese history.

And yes, we realize that to western thinking buying more when the price is dropping in explicable: ironically even the vast majority of gold bugs are merely interested in a momentum conversion in and out of fiat, thus treating gold as an investable, fiat-denominated asset and not as a currency. China, on the other hand, continues to show that when one’s only intention is to purchase as much gold as possible to preserve wealth and purchasing power and/or unleash the gold standard back on the world (either alone or jointly with Russia and/or Germany), dropping or plunging gold prices are merely the icing on the cake.


via Zero Hedge http://feedproxy.google.com/~r/zerohedge/feed/~3/VCKePCkQ6D0/story01.htm Tyler Durden

China’s Gold Hoarding Continues: Over 2,200 Tons Imported In Two Years

Paper gold in the developed world may trade based on the whims of marginal momentum chasers, and of course, the daytrading mood of the BIS gold and FX trading desk, but when it comes to physical gold and China’s appetite for it, one word explains it best: unstoppable.

After rising to a gross 131 tons imported from Hong Kong alone in August, which was the second highest ever monthly import tally, September saw a modest decline to “only” 116 tons: “only” because it is still 67% more than the amount imported a year earlier. 

The total gross imports since September 2011 is now a whopping 2232 tons. Why September? Because that is when we posted: “Wikileaks Discloses The Reason(s) Behind China’s Shadow Gold Buying Spree.” The chart below confirms precisely said reason.

The gross imports year to date are now over 1,113 tons, 91.3% more than the amount of gold imported through September of 2012.

Netting out exports to Hong Kong, September was virtually unchanged from August, at 109 metric tons vs 110 a month earlier. In other words, September was tied for the third highest net import month in Chinese history.

And yes, we realize that to western thinking buying more when the price is dropping in explicable: ironically even the vast majority of gold bugs are merely interested in a momentum conversion in and out of fiat, thus treating gold as an investable, fiat-denominated asset and not as a currency. China, on the other hand, continues to show that when one’s only intention is to purchase as much gold as possible to preserve wealth and purchasing power and/or unleash the gold standard back on the world (either alone or jointly with Russia and/or Germany), dropping or plunging gold prices are merely the icing on the cake.


via Zero Hedge http://feedproxy.google.com/~r/zerohedge/feed/~3/VCKePCkQ6D0/story01.htm Tyler Durden

4 Things To Ponder This Weekend

Submitted by Lance Roberts of STA Wealth Management,

As we enter into the two final months of the year, it is also the beginning of the seasonally strong period for the stock market.  It has already been a phenomenal year for asset prices as the Federal Reserve's ongoing liquidity programs have seemingly trumped every potential headwind imaginable from Washington scandals, potential invasions, government shutdowns and threats of default.  This leaves us with four things to ponder this weekend revolving around a central question:  "Does the Fed's Q.E. programs actually work as intended and what are the potential consequences?"

1) Three Questions For Ben Bernanke (via ZeroHedge)

David Einhorn of Greenlight Capital turns his attention to Ben Bernanke with three primary questions:

"We maintain that excessively easy monetary policy is actually thwarting the recovery. But even if there is some trivial short-term benefit to QE, policy makers should be focusing on the longerterm perils of QE that are likely far more important. Here are some questions that come to mind:


How much does QE contribute to the growing inequality of wealth in this country and what are the risks this creates?


How much systemic risk does the Fed create by becoming what Warren Buffett termed 'the greatest hedge fund in history'?


How might the Fed's expanded balance sheet and its failure to even begin to 'normalize' monetary policy four years into the recovery limit its flexibility to deal with the next recession or crisis?"

2) Heal Thy Economy Or Fuel The Next Crisis  (Project Syndicate)

Nouriel Roubini, a professor at NYU's Stern School of Business, plays tag team with David Einhorn questioning the policies and programs of not only the Federal Reserve but of all global central banks.

"As below-trend GDP growth and high unemployment continue to afflict most advanced economies, their central banks have resorted to increasingly unconventional monetary policy. An alphabet soup of measures has been served up: ZIRP (zero-interest-rate policy); QE (quantitative easing, or purchases of government bonds to reduce long-term rates when short-term policy rates are zero); CE (credit easing, or purchases of private assets aimed at lowering the private sector's cost of capital); and FG (forward guidance, or the commitment to maintain QE or ZIRP until, say, the unemployment rate reaches a certain target). Some have gone as far as proposing NIPR (negative-interest-rate policy).

And yet, through it all, growth rates have remained stubbornly low and unemployment rates unacceptably high, partly because the increase in money supply following QE has not led to credit creation to finance private consumption or investment. Instead, banks have hoarded the increase in the monetary base in the form of idle excess reserves. There is a credit crunch, as banks with insufficient capital do not want to lend to risky borrowers, while slow growth and high levels of household debt have also depressed credit demand.

As a result, all of this excess liquidity is flowing to the financial sector rather than the real economy. Near-zero policy rates encourage "carry trades" – debt-financed investment in higher-yielding risky assets such as longer-term government and private bonds, equities, commodities and currencies of countries with high interest rates. The result has been frothy financial markets that could eventually turn bubbly."

 Nouriel's comments touch on a topic that has become much more "mainstream" as of late which questions whether asset prices have once again began to over inflate.

3) 5 Signs The Stock Market Is In A Bubble (CBS Moneywatch)

Larry Fink, CEO of giant money manager BlackRock, clearly thinks the market is frothy.

"We've seen real bubble-like markets again," he said at a panel discussion this week, according to theBloomberg news agency. "We've had a huge increase in the equity markets."


Fink and many others are concerned about the impact of the Federal Reserve's "quantitative easing" program, under which the central bank is buying $85 billion a month in government bonds and mortgage securities in hopes of stimulating economic growth. These assets have vastly expanded the Fed's balance sheet, including recently. Since Sept. 4 alone, those balance sheets have increased 4.3 percent, while the S&P 500 has increased 4.9 percent.

In other words, investors are doubling down to capitalize on the cheap money that continues to flood the market."

The financial markets have long been seen as a gauge of future economic activity.   As the stock market rises the economy has also risen.  However, that has not been the case over the last several years with the economy stuck at a sub-par rate of growth.  Today, with the high degree of correlation between the Fed's balance sheet and the financial markets, it is getting increasingly difficult to make the case that the markets are reflecting anything but themselves.

Fed-Balance-Sheet-VS-SP500-101613


4) Why The Fed Can't Taper (Via Pragmatic Capitalist)

Fraces Coppola, proprietor of the Coppola Comment, recently discussed the issues behind the Fed's inability to "taper" its current Q.E. program.

"Tapering is removing central bank support of asset prices. Unless not just the US economy but the GLOBAL economy is "on the up" at the time that tap
ering commences, the result of tapering will be a global fall in asset prices. That isn't going to cause hyperinflation, as the Austrian school thinks, but it would cause a global recession.


I'm afraid it is not US fundamentals, but global fundamentals that will determine the Fed's ability to taper. If the Fed tapers when the global economy is already in the doldrums, as it is at the moment, the recessionary rebound to the US economy would be considerable.


Because of the US dollar's pre-eminence (and the pre-eminence of USTs, too – we don't talk about that enough), the Fed is effectively the world's central bank. It is high time that the US accepted that its monetary (and fiscal) policies must be driven by the needs of the global economy, not just the US. The 'exorbitant privilege' is an exorbitant responsibility, too."

QE Doesn't Do Much

As I discussed this past week the reality is that the Fed is now caught in a "liquidity trap."  If they begin to remove its liquidity support the markets, and the economy, roll over.  The results would like be quite devastating for investors.   However, continuing to push asset prices higher also will eventually end badly.  It is quite the conundrum for the Federal Reserve and for investors.

While the Federal Reserve continues to push its liquidity programs, the reality is that it does little for economic growth.  Nobel Prize winner Eugene Fama discussed with Rick Santelli how the only thing that really benefits from QE programs, other than asset prices, are the "expectations" of benefits on the economy.  He explains, in the following CNBC interview, that there is really no reason why QE programs would have much economic impact at all.


How we got here is one thing.  Apparently, getting out will be quite another.  John Hussman summed this all up well:

"In regard to what is demonstrably true, it can easily be shown that unemployment has a significant inverse relationship with real, after-inflation wage growth. This is the true Phillips Curve, but reflects a simple scarcity relationship between available labor and its real price, but this relationship can't be manipulated to create jobs (see Will the Real Phillips Curve Please Stand Up). It's also true that changes in stock prices are mildly correlated with subsequent reductions in the unemployment rate and higher GDP growth. But the effect sizes are strikingly weak. A 1% increase in stock prices correlates with a transitory increase of only 0.03-0.05% in subsequent GDP, and a decline of only about 0.02% in the unemployment rate. So to use the stock market as a policy instrument, the Fed would have to move the stock market about 70% above fair value just to get 2.8% in transitory GDP growth, and a 1.4% decline in the unemployment rate. Guess what? The Fed has done exactly that. The scale of present financial distortion is enormous, and further distortions rely on the permanent belief that there is actually a mechanistic link between monetary policy and stock prices.


We know very well the mechanisms and actual historical relationships between monetary policy and financial markets, and doubt that any amount of quantitative easing will prevent a market slaughter in any environment where investors find short-term liquidity desirable (QE only “works” to the extent that zero-interest liquidity is treated as an undesirable “hot potato”). Still, the novelty of quantitative easing, and the misattributed belief that monetary policy ended the banking crisis, has created financial distortions where perception-is-reality, at least for now. We believe that the modifier “for now” will prove no more durable than it was during the tech bubble or the housing bubble."

It is something to ponder over the weekend.


via Zero Hedge http://feedproxy.google.com/~r/zerohedge/feed/~3/z3oFuW4ocXw/story01.htm Tyler Durden

Goldman Now Pitching Most Shorted Stocks

For over a year we have discussed that in Bernanke’s centrally-planned markets, in which the risk-return formula is now wholly absent the former, the best source of “alpha” (purely in the context of recognizing that the market has become a complete and total joke) for over a year has been going long the most shorted companies. And as we reminded just over a month ago, the most shorted stocks have returned double the broader market in the past year alone. Which is why we were not surprised to see that none other than Goldman yesterday, issued research formalizing none other than going long the most shorted stocks in a piece titled “Investors focused on the results of high short interest stocks.” Since Goldman is legendary for flipping at inflection points, especially with a 1+ year delay after the strategy has been working flawlessly, this probably means that going long the most shorted stocks is no longer a viable source of “alpha.”

From Goldman:


Short interest as a percent of S&P 500 market cap is currently 2.1%, in line with the average over the past year. While the share of market cap held short stayed flat, the short interest ratio (days to cover) has risen steadily since April 2012 as volumes remained low.


This week, investors focused on how stocks with high short interest as a share of market cap are trading this earnings season. Of the top 50 reported S&P 500 companies ranked by short interest, short interest ranges from 6% to 31% of market cap. Short interest for the median S&P 500 stock is 2.1% of float cap.


High short interest stocks reported a similar frequency of earnings beats and misses. Revenue results skewed more positive. 26% of S&P 500 companies beat revenue expectations while 36% of high short interest stocks exceeded consensus expectations by one standard deviation or more.


High short interest stocks were more likely to outperform the market on the next trading day than the typical S&P 500 stock indicating that there may be short covering post-earnings results. 58% of the high short interest names outperformed the S&P 500 one day after reporting results versus 47% for all reported S&P 500 companies.


However, performance of the median high short interest stock is similar to the median S&P 500 stock since the start of earnings season. Since October 4, the median high short interest stock returned 4.6% while median S&P 500 stock returned 4.1%.


Next week, six stocks with over 10% of float share held short are expected to report: Frontier Communications (FTR), IntercontinentalExchange (ICE), Windstream Holdings (WIN), Chesapeake Energy (CHK), Dun & Bradstreet (DNB), and Cablevision Systems (CVC).


Of course, if indeed this means that buying the most shorted stocks is no longer a “sustainable” strategy, that would be ok as it implies one small step toward returning to a normal, credible, non-manipulated market: something that both we and David Einhorn openly lament. Recall from David Einhorn’s Advice On How To Trade This Equity Bubble:

Finally, there are the market participants whose investment process appears to be “bet on whatever has made money most recently.” They’ve noticed that stocks with large short-interest ratios have materially outperformed over the last year and they continue to invest accordingly. When “high short interest” becomes a viable stock-picking strategy and conventional valuation methods no longer apply for many stocks, we can’t help but feel a sense of déjà vu. We never expected to find ourselves in an environment like this again, given the savings that were lost when the internet bubble popped.

Alas, we are smack in the middle of the same bubble once again, and will be until the Chairman keeps playing the musical chairs dance ever faster and faster until finally everyone drops dead.


via Zero Hedge http://feedproxy.google.com/~r/zerohedge/feed/~3/y0v1kmZLu7w/story01.htm Tyler Durden