Goldman On The Biggest Story In The Markets Right Now And 9 Other Observations
By Tony Pasqsuariello, Goldman Sachs’ head of Hedge Fund Sales in US Equity Derivatives,
The key story over recent weeks has been a nascent return of the reflation theme. To be sure, price action across the macro complex hasn’t been subtle — be it higher rates, another charge higher in commodities or the searing outperformance of cyclicals over growth stocks — yet, this is a different scene from the high velocity days of November through March.
Whereas the franchise dialogue then was characterized by hopes for unbounded fiscal spending, a sincere Fed commitment to the AIT framework and blockbuster payrolls prints … the recent story line has centered more on the FOMC taking their first clear step towards normalizing policy, energy markets contending with some very serious supply-and-demand issues and positioning/mis-positioning.
That said, where you can find common ground between the two episodes is around the biggest fundamental variable in the markets: the interplay between COVID and global economic activity.
Amidst all the noise and cross-currents and debate around first derivatives vs second derivatives, the fact is this: the global economy is firing on more cylinders today than at any point in the COVID era.
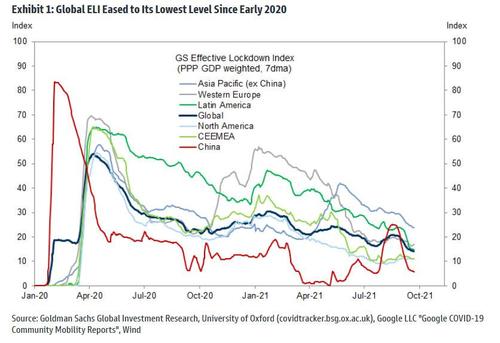
For example, witness the GS Effective Lockdown Index, which trends in the right direction and clearly identifies a recent inflection from the Delta impingement — taking the index to its easiest level since the early days of the pandemic.
Here’s another framing from long-time colleague Dominic Wilson: “for me the big difference is that last year it was about large, new positives — now it’s about removal of some downside stuff against a slowing trend so it’s all a bit more tactical. and, the upside tails aren’t really being restored.”
Looking ahead, here’s where I come out, taker of feedback:
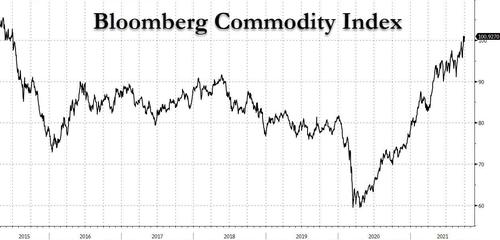
- Point-to-point, there’s been no better horse in the reflation race than commodities — and, if the first point in the section below is correct, for medium-term investors, that could well remain the case.
- It’s not totally obvious to this stock operator where the bond market goes from here. given the inflation debate, I do think the asymmetry is skewed towards higher rates than lower rates. the house view continues to be 1.60% on 10-year notes at year end, with an ultimate path to 2.50% (link).
- Given that point on rates, it’s also not clear to me that you’re supposed to be sliding all of your chips from secular winners to cyclicals; I’d prefer to keep an ongoing balance there, while overtly avoiding the bond proxies. said another way: cyclicals-over-defensives is a clearer axis to me than value-over-growth.
- On S&P more broadly, as we approach a very strong seasonal period, I continue to believe the path of least resistance is higher. at the same time, I also suspect we’ll be living with a higher base level of volatility for a while — with that comes a choppier trading environment where the bulls get paid by adding exposure on dips.
- If global central banks are getting out of the bond buying business, one can expect it will happen at different speeds and with different exit strategies. as a crafty client suggested, from a very boring starting point, this should open the door to a better opportunity set in FX trading. note, quietly, DXY has made YTD highs.
Several other quick points, charts:
1. Commodities: another week, another higher high in BCOM, with an eye-popping sequence in the European power markets. In the GIR upgrade to our oil forecast, I found it a little interesting they touched up YE’21 Brent from 80 to 90 … I found it more interesting that the 2023 bogey moved from 65 to 85 (link).
2. The Fed: from an arguably absurd starting point, last week marked the first step towards a glide path — if a very long path — to something resembling policy normalization. I looked back at the ’04-’06 analog: the Fed hiked rates 17 times, they were most perfectly predictable in doing so, and market volatility collapsed along the way. while I imagine they’d be happy with a similar outcome, again my instinct is that analog may not apply all over again.
3. Japan: it’s a big week for the ever pivotal Japanese election cycle, with an outcome that skews as generically market friendly. coupled with a much better outlook for COVID and the reset in global interest rate curves, the bullish house call for Japanese equities still aligns with my instincts: link.
4. China: GIR published an eye opening note on their property market (link). at 20% of GDP and 62% of household wealth, thus totaling $60tr, one can argue it’s the largest asset class in the world (btw, am I the only person who didn’t realize that).
5. From the 2017 market journal, when S&P never traded negative at any point in the year en route to a 22% total return and a 3 Sharpe:
- i. “maybe someday we’ll look back and be astounded that central banks bought $14tr bonds. or, maybe, they will still be buying.” note that since last March, the big four central banks have bought another ~ $5.5tr.
- ii. with updates: “in the 20th century, the Dow went from 66 to 11,497 (a gain of 17,320%). in the 21st century, the index is up a further 402%.”
- iii. with updates: “total returns since the ’04 IPO: Alphabet/Google + 6,312% … Domino’s Pizza + 7,148%.”
- iv. “remember, 10% of cumulative alpha per year breaks down to … 4 bps per trading day.”
- v. while not for deployment in this email, “data shows there’s a positive correlation between swearing and perceptions of honesty.”
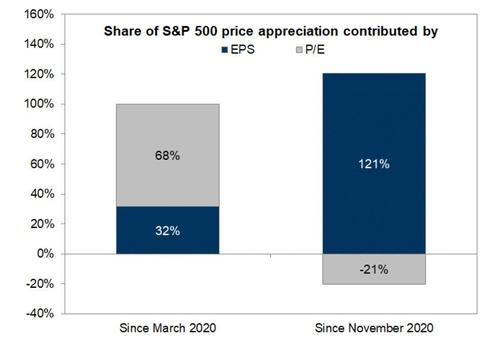
6. When the market is trading at multiples not seen outside of the tech bubble, it’s fair to wonder if one of the big challenges is priced-to-perfection risk? I asked Ben Snider in GIR to zoom in a bit on valuation in the context of the COVID era. the sequence has been interesting: since the market bottomed last March, only 32% of the rally has been driven by earnings … the balance of 68% was re-rating of the multiple. that said, since the vaccine announcements last November, the entirety of the rally has been driven by earnings:
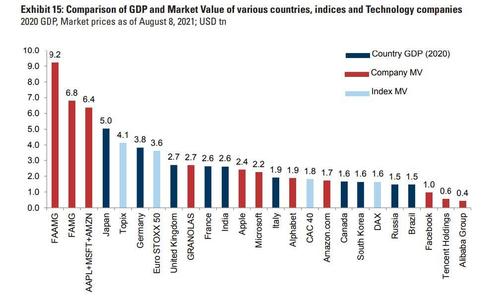
7. This is one of those big picture charts that doesn’t inform your risk taking in the short-term, but perhaps says a lot about the world in a broader sense. With credit to Peter Oppenheimer and team in GIR, this contextualizes just how big US mega cap tech companies are relative to the GDP of various large countries and indices:
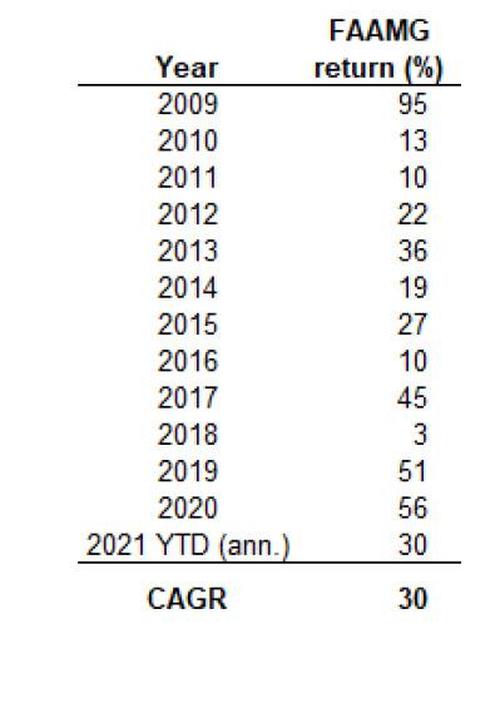
8. Following on from there … again with credit to Ben Snider … this a very simple snapshot of annual total returns in the FAAMG complex post-GFC … for all of the local turbulence of recent weeks, I still think there’s a lot to like here long-term:
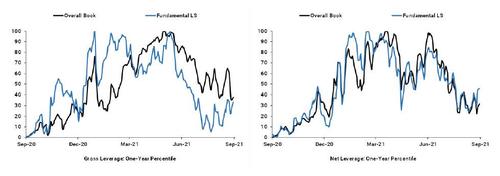
9. To level set positioning in the hedge fund community, this lays out the recent history in both gross exposure (left side) and net exposure (right side). While I am very aware that US households have gone whole-hog into stock market, the professional trading community is, by contrast, relatively sober in current risk taking. As someone put it to me: there’s lots of optimism, but lots of cash … That’s not how bull markets usually end.
Tyler Durden
Sun, 10/03/2021 – 16:55
via ZeroHedge News https://ift.tt/3B8GrvS Tyler Durden
