Is Credit Whispering, Or Screaming?

Is Credit Whispering, Or Screaming?

By Peter Tchir of Academy Securities

Is Credit Whispering? Or Screaming?

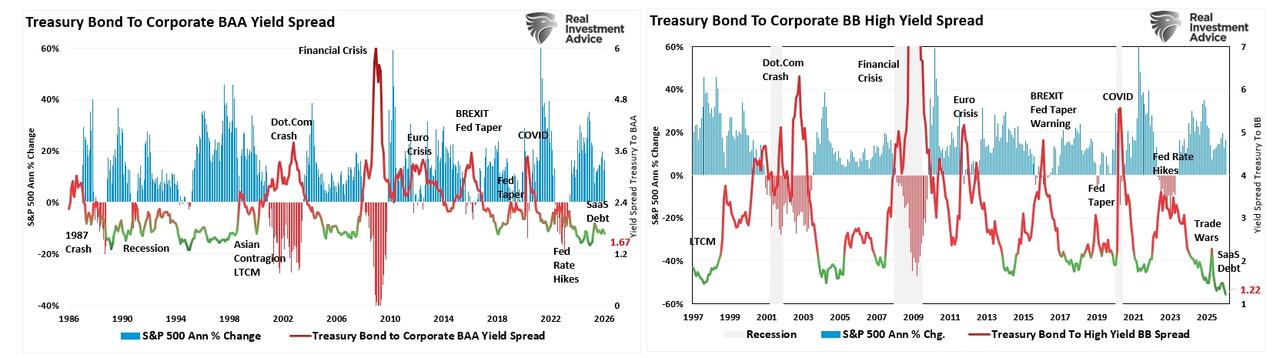
For the past couple of years, it has been relatively safe to assume credit is well behaved and relatively range bound. It is unclear if that remains the case.

We may be in a situation where the AI spend, the AI displacement, and the Working Poor are forming a storm of some sort. How severe remains to be seen, but for the first time in a while it is a real concern for me. My inclination has been to “fade” any concerns and “buy the dip.” That is still my “gut,” but I don’t think we should trust that “gut” feeling here.

Bank Debt

We are going to start with bank debt today. Senior secured leveraged loans (as opposed to debt issued by banks).

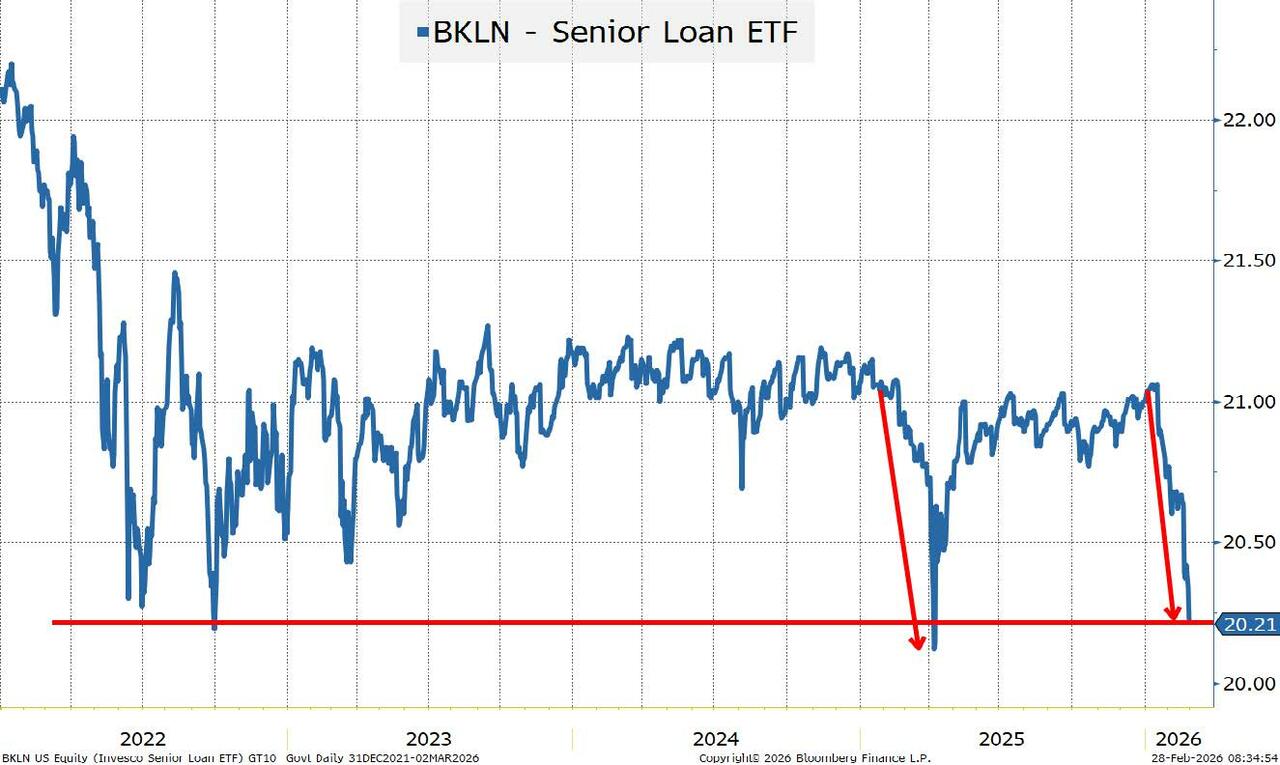
There are a few reasons to start with the leveraged loan (or bank debt) market and this ETF in particular:

  • It is senior secured, so in theory is at the “top” of the capital structure (loan only issuers as well as covenant-lite deals have made that less of a truism than it once was).
  • Our longstanding view is that “financial” bubbles always start with “credit” bubbles, which start with a “safe” asset no longer being safe.
    • To say the leveraged loan market was viewed as “safe” is a stretch, but could we argue that private credit took on an aura of “safeness?”
  • The nature of this ETF creates more risk of an ETF Spiral™ than we see in some other credit ETFs, where that risk is also present.

This ETF is almost back to its Liberation Day lows in price terms.

One “excuse” for this has come up in some conversations:

  • We’ve had 3 rate cuts and anticipate more, making floating rate products less interesting.
    • FLOT, an investment grade, floating rate bond ETF, has not sold off at all. This isn’t just about rates. In fact, it isn’t about credit “generically,” it is about specific aspects of the credit market.

The ETF mechanics are important here as well.

  • BKLN is $6.4 billion, so it is relatively small, which is good. By comparison, HY ETFs like HYG at $16.6 billion and JNK at $7.8 billion are larger, and have potentially more impact.
  • The flipside of that is the leveraged loan market is less liquid (on many metrics) than the high yield bond market. The settlement process is different as well. So “price discovery” may be more impacted by flows into or out of this ETF, versus corresponding flows into or out of HY ETFs.
    • BKLN does not do “like for like” creates or redeems. This is important.
    • Shares of ETFs like HYG and JNK can be created, or redeemed (destroyed) via an exchange of a pool of bonds. So, someone who wants to redeem a large amount of one of these ETFs may be delivered a portfolio of bonds. This creates a “balance” of sorts, in that the “price discovery” mechanism is in the exchange.
    • Due to the nature of loans, this mechanism does not exist (or certainly is not the primary mechanism) for loan-based ETFs and they rely on create/redeem versus cash. A large redemption would cause the manager of the ETF to go to the market to sell loans. I have always believed that in times of stress (of which there have been a few), this leaves the leveraged loan market more exposed to flows from the ETFs than other credit markets.
    • So far, the ETF has been trading “close” to NAV. This is where the ETF Spiral risk comes into play. When an ETF trades at a discount to NAV, it creates an “arbitrage” opportunity, where someone sells or shorts the underlying portfolio (or a subset of it) and buys the ETF. While on the surface that is “risk neutral,” but we have seen time and again that it tends to amplify moves to the downside. The “new” owners of the underlying credit instruments are more fearful than the seller of the ETF. All it takes is a few buyers of the bonds or loans to get nervous and sell, and the spiral can renew itself. Even worse, some traders, at the end of the day, will hedge themselves by shorting the relevant ETF, perpetuating the spiral.
    • We are NOT seeing evidence of this, but it is on my radar screen and wanted to try to explain why in case it does start.

Boring……

Yes, it has taken us two pages to set the table a bit, but now we can get to the more “interesting” parts.

Selling What You Need Meets Selling What You Can

Now, maybe we can get to understanding why we started today’s T-Report with a relatively small ETF and went at lengths to highlight some liquidity issues on that ETF and the underlying asset class.

There is often a battle of selling what you need to sell. These are the assets that are at the root of your concern. The ones you need to reduce exposure to, because your exposure is now too large, relative to your risk tolerance.

Selling what you can sell is what occurs when either you cannot sell what you need to, or the price has dropped so much on what you “need” to sell, that you sell some of the closest “proxies” to get overall exposure down.

I often “joke” that 9 of 10 high yield selloffs were sparked by emerging market selloffs. Not because they had much to do with each other, but they were often treated as the same “pool of capital” and once EM bonds were down 10%, someone would decide it is better to sell a high yield bond down 2% than hitting another “lowball” bid in EM.

What Portfolio Managers “Need” to Sell. Not every portfolio manager is in the same condition. Not all have reached similar conclusions. This is meant to be a “generality,” but a generality that is real and has potential ramifications.

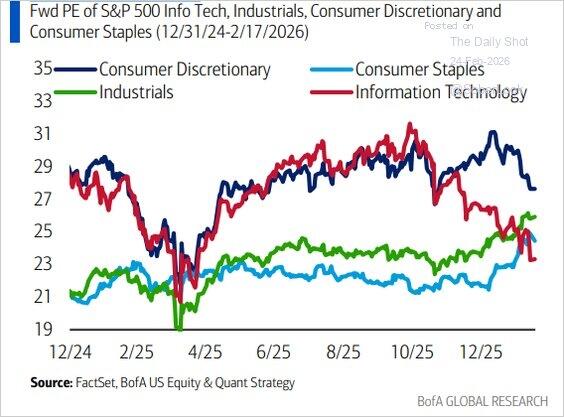
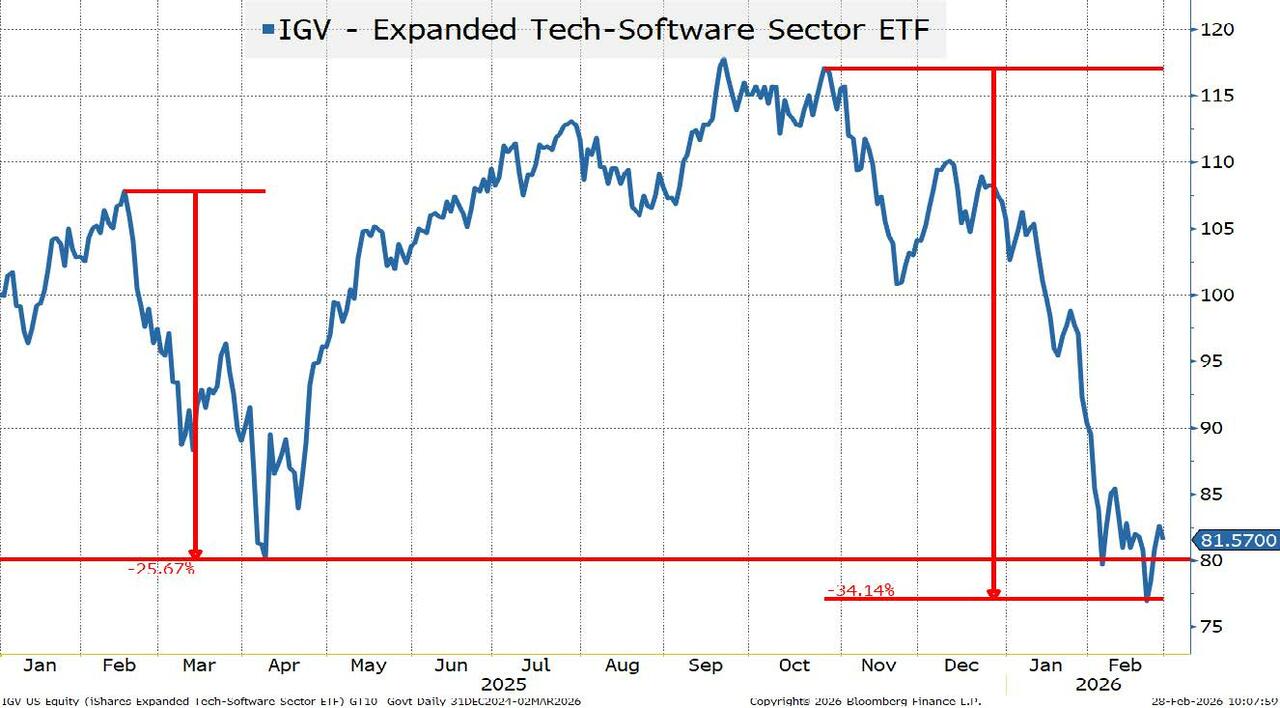
  • Exposure to software services. This is clearly the new bogeyman in the room.  

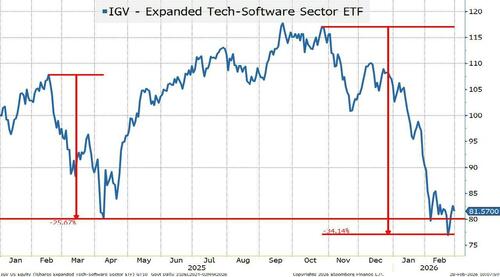
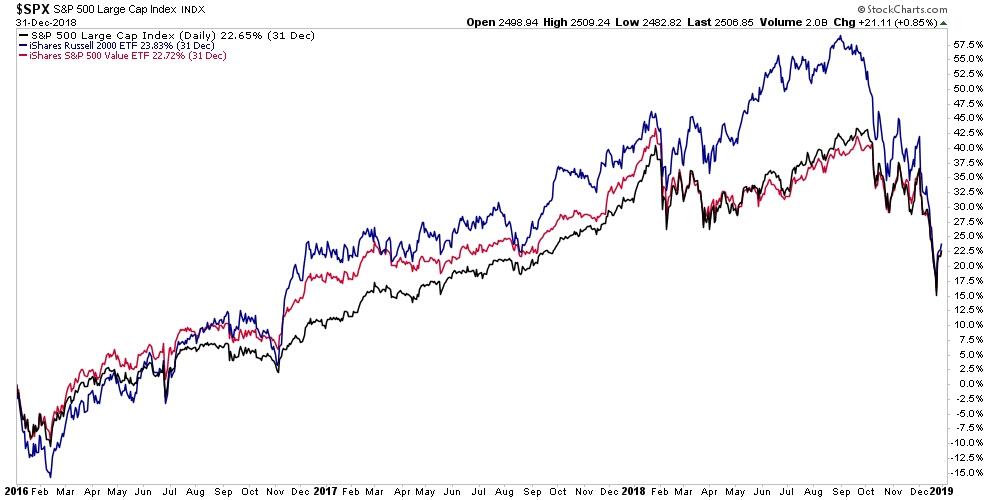
    Anything below Liberation Day levels warrants extra attention. Liberation Day was a largely “self-inflicted surprise” that ultimately the admin largely backed away from. This is a bit more worrisome. The sell-off started in Q4, but only now appears to be “rattling” credit markets (BKLN didn’t start selling off until the middle of January). My argument would be that the first part of the “correction” was a valuation adjustment. It is exactly why we had more concerns about stocks than credit. Equity valuations were so strong in some sectors that you could have equities come under pressure, without corresponding pressure on credit. But as that “valuation buffer” erodes, credit and equities will move more in line.

    We won’t discuss how much of this pressure is warranted or not. The view we discussed a couple of weeks ago remains my base case – this will largely be about margin compression. I find it hard to believe that this “conversation” isn’t occurring at some level. 

    C-Suite Executive. Get purchasing on the line and find out how much we are spending on software services. 

    Purchasing Manager. How much are we spending on software services? What is our budget for this year? Do you need to spend all of that? 

    Purchaser. Yeah, I’ve seen the reports. Yeah, we’ve played around with AI. None of it comes close to delivering what we get from providers. The providers have worked with us for years and not only have we customized the system, but it has also become integrated into so many things that we do, so we would be hard pressed to even think about changing, let alone change. 

    Purchasing Manager. Yes, but how much are we spending and do we need to spend it? 

    Purchaser. Ummmh, I thought I answered that. it is an integral part of our company at this point, I don’t see how, or why we’d change current spending.

    Purchasing Manager to Purchaser. Ok, don’t do anything stupid and see what you can do to get costs down. 

    Purchasing Manager to C-Suite Executive. All under control. We are examining what we can do to keep costs down and explore new technology. 

    If I’m correct and this is the “conversation” that is taking place, it supports margin pressure, rather than something more dire. Discounts can be offered. Maybe “add-ons” for free, but possibly discounts. More resources can be provided to keep clients committed. 

    Equities lead credit lower, but is credit now dragging equities lower? That is potentially the case, which would explain the “need” to reduce exposure to this area. 
     

  • Exposure to hyperscalers and the data center/AI industry. This was an issue that was first brought to light in Q4 last year. I will use ORCL CDS as a proxy since it seems to be the easiest single thing to point to. There were some isolated concerns, and you saw some spreads widen a bit, but the investment grade bond market had no problem digesting some large new issues in 2026. It was a bit of a concern, but away from a few specific credits, it didn’t seem to illicit much action. I’m not sure it is still high on anyone’s “action” list, but people are likely revisiting exposure in this area.
     
  • We could explore other areas or sectors that “need” to be sold, but let’s just use these two areas as the starting point. 

Selling What “Needs” To Be Sold

Let’s assume for the moment that the market is now trying to sell these types of risks. Where are those risks?

  • The leveraged loan market.  

    We already discussed the loans themselves and the ETF. You can sell the loans, but you cannot perfect a security interest in the loans, so if you want to “short” as a hedge (or a trade) you wind up needing to use a proxy (short interest in BKLN is growing). But that is not the only place these sorts of loans are making an appearance.

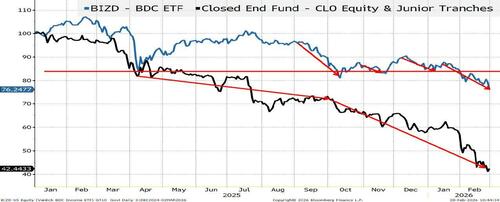
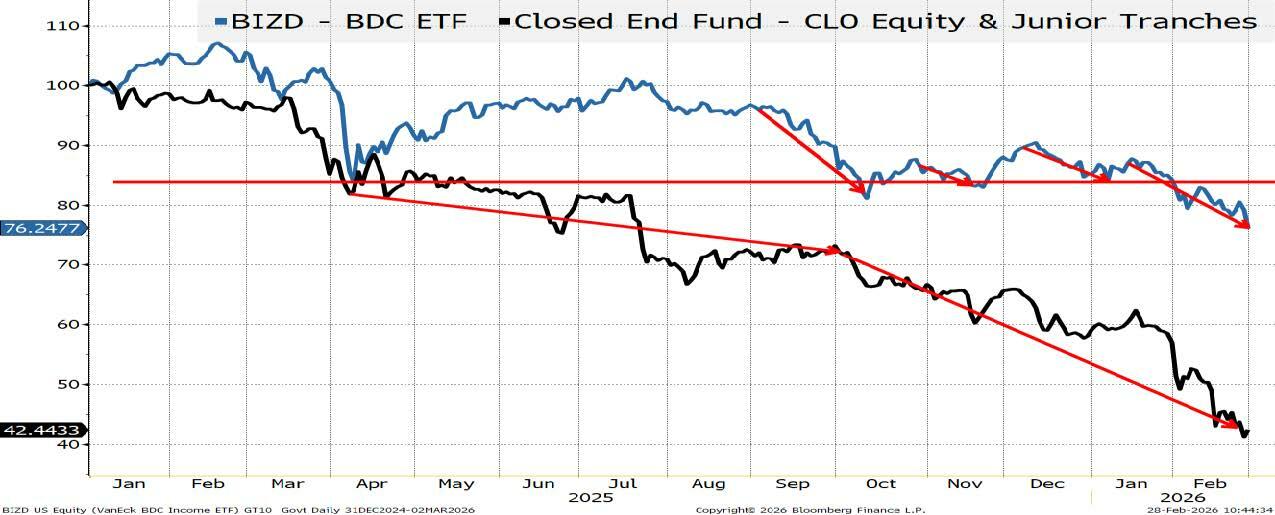
    Business Development Corporations have leveraged exposure to the leveraged loan market (not exactly accurate, but close enough). This was one of the first asset classes to retest the Liberation Day lows. It has now broken through. 

    I was very reluctant to include the second chart here. 
     
    It is a closed end fund and quite small, making me question the pricing and understanding. Having said that, I did not have access to a CLO equity index that I could share. I would have preferred a CLO equity index, so I went with this closed end fund to illustrate a point, knowing that point was exaggerated. I honestly couldn’t figure out whether it was better to leave out (and not make a point about CLO equity) or include (and risk making the CLO equity issue a bigger deal than it really is). So, I erred on the side of leaving it in, as it makes the next chart more relevant.  

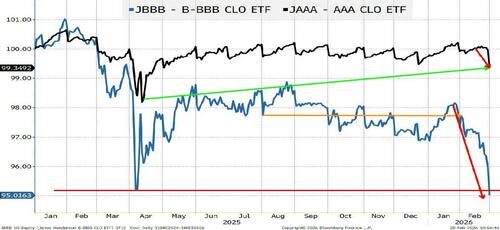
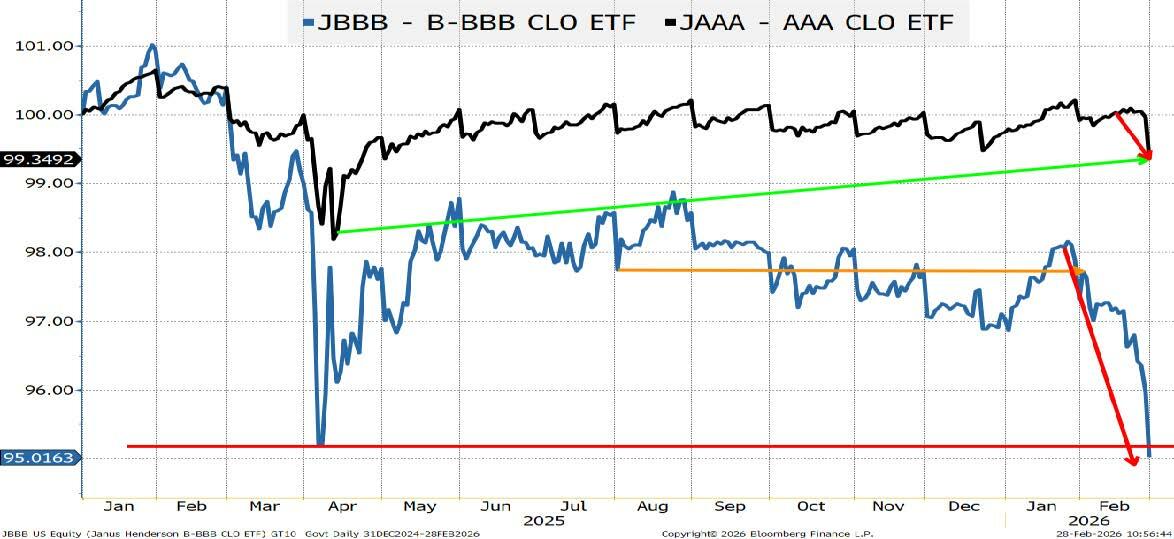
    You are now seeing the markets impact more senior tranches. As the equity buffer in the CLOs declines, more of the price action in the underlying asset class needs to be absorbed by more senior tranches. 

    The “good” news is that JAAA, a fund that invests in AAA CLO paper, has not moved much and is well above the Liberation Day lows. The “bad” news is that may be changing as risk gets pushed up the spectrum. The AAA CLO does fit my definition of a “safe” asset. I believe that it is more difficult to have a credit loss in the AAA tranche of a cash flow (not market value) CLO than it is to pick a perfect bracket in the NCAA March Madness tourney pool. The deals done in the “old days” with fewer protections didn’t trigger at the investment grade level for any tranche, and the structures are even more difficult to break now. That does not preclude selling. 

    Let’s never forget, far more money is lost in credit by being “forced” to sell (leverage, fear, overexposure, downgrades, etc.) than is lost from defaults. 

    JAAA at $27 billion is large in its own right, but is just one of many very successful AAA CLO ETFs. Again, the “safe” money aspect trickles in here. I was mildly surprised that JAAA has had inflows this year. 

    While I am not at all concerned about credit risk as this level, I am concerned about potential selling. My guess is if the selling occurs, it would be via misunderstanding by investors who have allocated to such ETFs. 

    While pricing pressure can be brought to bear on the more senior tranches, any sort of selling that sucks up the liquidity for senior tranches can impact the entire underlying asset class. CLO equity is the tail that is wagged by the dog (the leverage loan market). The CLO AAA tranche is the  dog that wags the tail (the leveraged loan market).

So far, we have remained in the realm of being able to sell what you want or think you need to sell.

Private Credit

What part of the credit world seems to own a lot of what “needs to be sold”? Private Credit.

Again, we are not arguing that what “needs to be sold” really needs to be sold, but that is the current market sentiment, and that sentiment seems to be increasing. Part of why it may be increasing is because of the inability to reduce your exposure if you allocated to private credit.

There is always an element of “cohort” investing in credit. CLOs created around the same time tend to own a lot of the same loans. Often those loans are similar. It is the nature of the beast. 

CLOs are designed to be ramped up and fully funded, so that you can move on to the next CLO.

The easiest way (and often the only way in a “hot” market) to ramp up quickly is to buy the new issues. So, there is a tendency for CLOs of a similar vintage to own the same loans – the new issues of the time.

There are times when you get a widely diversified batch of new issues. Ratings could be across the board. Industries across the board. There are times when there is a “flavor of the day” type of concentration in the new issue calendar.

We haven’t done the work of detailing this, but from conversations, there have been periods in the past few years, where there has been a focus on software and data centers, etc., in the loan market, creating concentration risk.

Everything we just described applies equally to “serial private credit funds.” Where a fund raises money, invests it, and raises a new fund.

The Biggest Risk to Public Credit is the “Need” to Hedge Private Credit

We are getting this nasty little intersection of leveraged loans, CLOs, BDCs, and Private Credit.

Is it overdone? Possibly, but the narratives seem to be gaining traction. The selling has only started and seems to have just started to “spread” and contaminate other markets.

We have seen bank stocks come off recent highs (looking at KRE – Regional Bank ETF). Is that directly related to anything we’ve been discussing today?

Bank CDS spreads are widening a bit, both here and abroad. Just inching higher, from very tight levels and nowhere near their Liberation Day levels, but something to keep an eye on.

Ignoring…

We didn’t even address the recent default in Europe that raised more questions about fraud and risks in the private credit market.

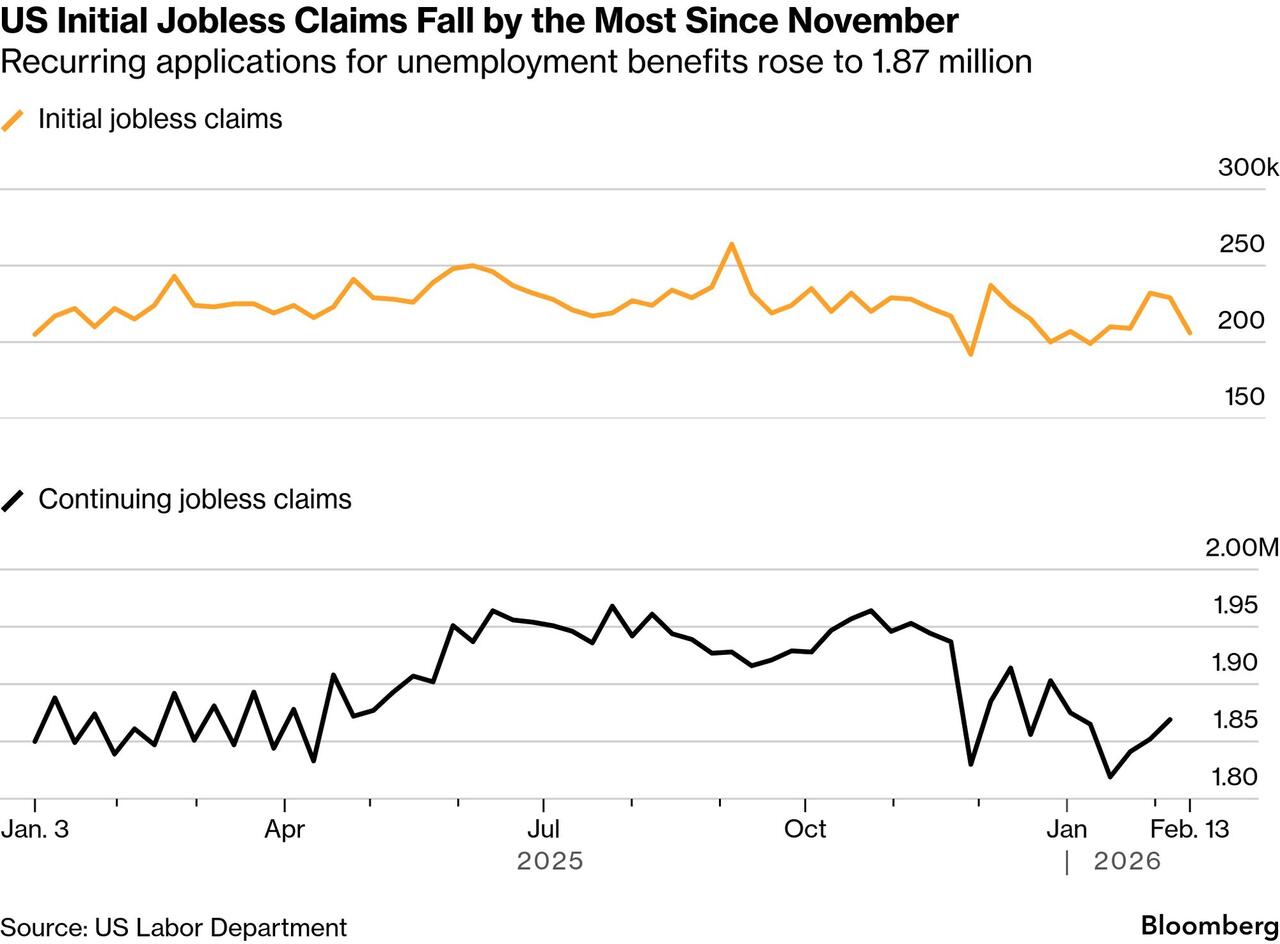
We didn’t touch on potential risk to various parts of the credit market from the “working poor.”

We didn’t spend a minute dwelling on the risk of losing more jobs from “efficiency” more quickly than alternative employment can be found.

We didn’t address the positives either and why this may already be overdone.

Bottom Line

I want to “buy the dip” in credit. I don’t think I can.

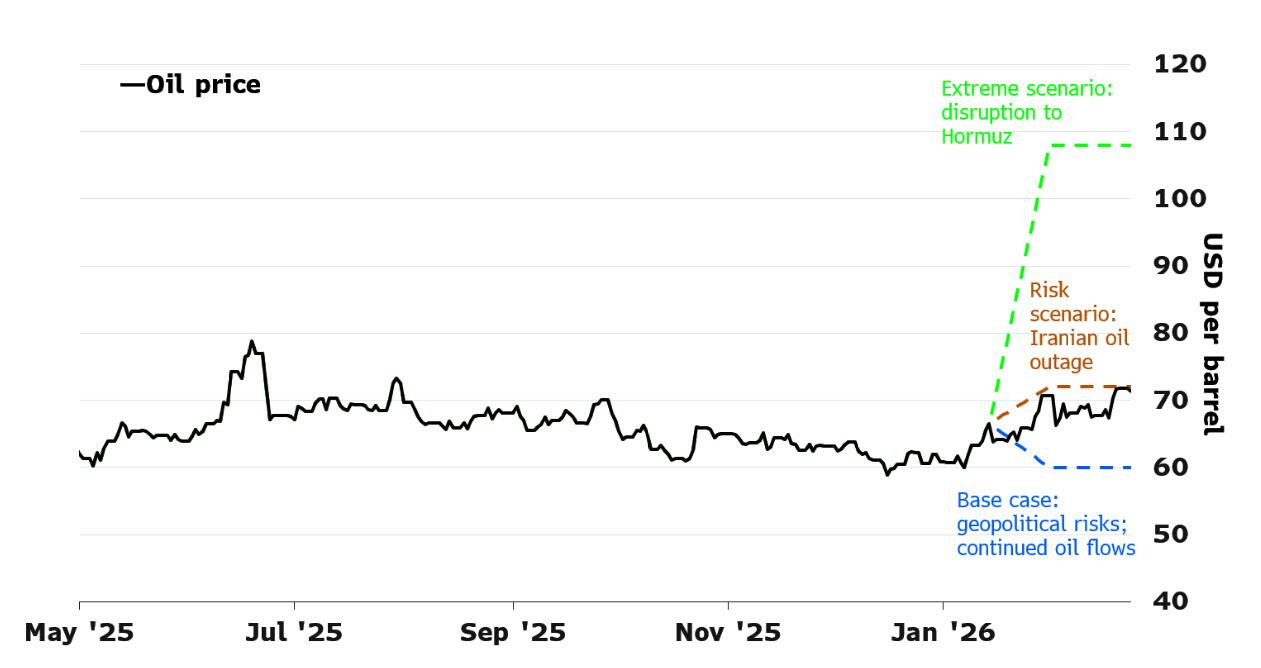
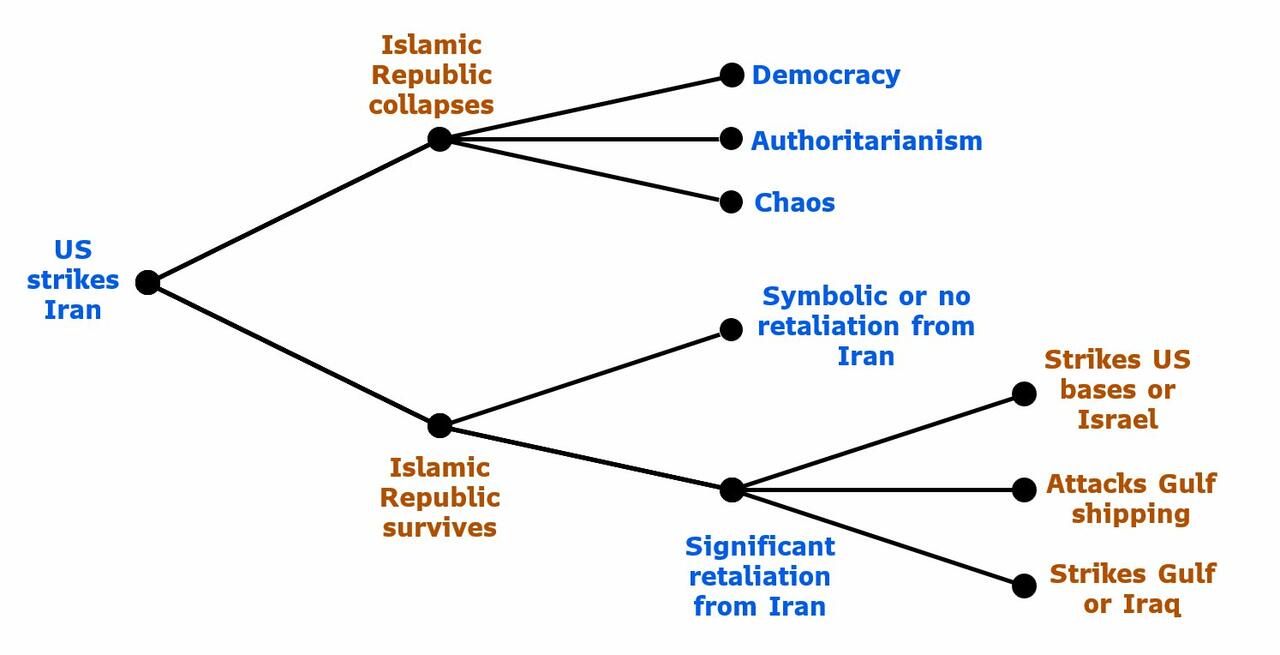
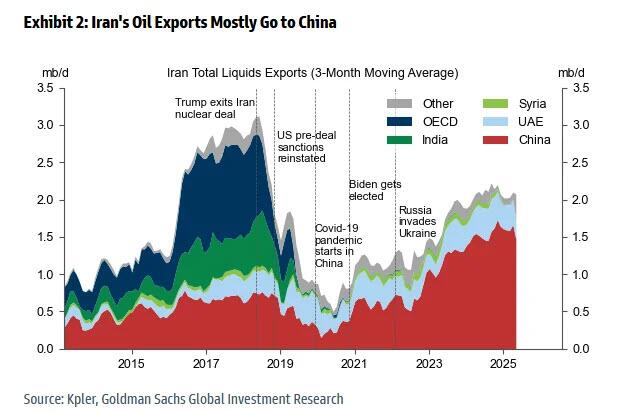
We might get a nice bounce in risk assets this week if the attacks in Iran lead to a deal rapidly, without disrupting the flow of oil.

There is a confluence of events and I really want to see stabilization before I can be really comfortable.

This interconnectivity, the perception of relative “safety,” and the lack of liquidity in both the underlying assets, but more importantly, the vehicles through which those underlying assets are owned, are concerning.

We’ve been pounding the table on a rotation to foreign stock markets, but think we need to be more cautious across the board.

When credit talks, all markets should listen. So far, credit is only “whispering” to equities, but if they decide to get louder, it will not be good for risk assets.

On rates, price in 3 cuts by the end of the September meeting and I’m kind of “indifferent” at 10s below 4%, but given everything we just wrote, it probably makes sense to stay long rates for a bit longer, even out the curve.

We can only hope that the events in the Middle East lead to a peaceful resolution, putting the Iranian people on a better path to prosperity and freedom, while minimizing the loss of life for everyone in the region.

Tyler Durden
Sun, 03/01/2026 – 16:41

via ZeroHedge News https://ift.tt/ki96xSq Tyler Durden

DOJ Charges 30 More People For Minnesota Church Invasion

DOJ Charges 30 More People For Minnesota Church Invasion

Via Headline USA,

Attorney General Pam Bondi announced charges Friday against 30 more people who are accused of civil rights violations in a January protest inside a Minnesota church where a pastor works for Immigration and Customs Enforcement.

Bondi said on social media that 25 people were in custody and more arrests would follow.

The new indictment comes a month after independent journalists Don Lemon and Georgia Fort and prominent local activist Nekima Levy Armstrong were charged for their alleged roles in the protest at Cities Church in St. Paul, Minnesota.

“YOU CANNOT ATTACK A HOUSE OF WORSHIP. If you do so, you cannot hide from us — we will find you, arrest you, and prosecute you,” Bondi wrote in the post.

“This Department of Justice STANDS for Christians and all Americans of faith.”

In total, 39 people now face charges of conspiracy against religious freedom and interfering with the right of religious freedom.

The new defendants will have an initial court appearance and a magistrate judge will set conditions for their likely release. Lemon and Fort said they were at the church as journalists covering news. Levy Armstrong was the subject of a doctored photo posted by the White House showing her crying during her arrest. The three have pleaded not guilty.

Protesters descended on Cities Church on Jan. 18 after learning that one of the church’s pastors also serves as an ICE official. The protest drew swift condemnation from Trump administration officials and conservative leaders for disrupting a Sunday service.

The indictment says the “agitators” entered the church in a “coordinated takeover-style attack” and engaged in acts of intimidation and obstruction.

“Young children were left to wonder, as one child put it, if their parents were going to die,” the indictment says.

A lawyer for the church praised the Justice Department for charging more people.

“The First Amendment does not give anyone — regardless of profession, prominence, or politics — license to storm a church and intimidate, threaten, and terrorize families and children worshipping inside,” Doug Wardlow said in a statement.

The revised indictment adds new allegations when compared to the original filed in January.

It says two people “conducted reconnaissance” outside the church a day before the protest and recorded their visit on video, with one saying, “My thoughts are to be able to close up this whole alleyway right here.”

The court filing quotes one protester as chanting in the church, “This ain’t God’s house. This is the house of the devil.”

Separately, a woman who was at the church service has filed a lawsuit against some people who were charged, alleging emotional trauma and an inability to exercise her religion that day.

The protest came at a tense time in Minnesota, where the Trump administration sent thousands of federal officers for Operation Metro Surge after a series of public fraud cases where the majority of defendants had Somali roots. Officers frequently deployed tear gas for crowd control in neighborhood clashes with residents, often detaining them along with immigrants.

On Jan. 7, a federal officer fatally shot Renee Good, 37, in Minneapolis. In another fatal shooting a week after the church protest, a federal officer killed 37-year-old nurse Alex Pretti.

Nationwide demonstrations erupted in response, followed by a change in Operation Metro Surge’s leadership and the eventual wind-down of the immigration enforcement operation. Roughly 400 ICE officers and Homeland Security agents were expected to remain in Minneapolis by early March, down from roughly 3,000 at the peak, according to a court filing.

Since then, the Twin Cities have grappled with the impact to communities and the local economy. The city of Minneapolis said it suffered an impact of $203.1 million due to the operation, with tens of thousands of residents in need of urgent relief assistance.

Tyler Durden
Sun, 03/01/2026 – 16:20

via ZeroHedge News https://ift.tt/VtBeaHS Tyler Durden

Joe Biden Makes Insane Claim That He Reduced Illegal Immigration

Joe Biden Makes Insane Claim That He Reduced Illegal Immigration

It’s time for a fact check.  Former President Joe Biden is back after a year largely absent from the public eye, and he’s just as incoherent as ever.  Biden left the White House in disgrace after a dismal first term when his own party supplanted him as the primary candidate for the 2024 elections against Donald Trump. 

His cognitive decline became obvious after his debate performance and questions remain if he was actually aware of the majority of his own executive orders and pardons, or if these were signed illegally by one of his staff with an autopen.  Furthermore, he left the nation is a state of complete chaos, but in a recent speech at a South Carolina Democratic Party event in Columbia, he claims he actually did a bang-up job. 

Biden took to the podium, slurring and stuttering, but did manage to rewrite history when he argued that:

“Despite the fact that Covid drove migration to record levels all around the world, the day I left office, border crossings in the United States were lower than the day that I entered the office I inherited from Trump. That’s just a fact.”

Biden also asserted that he left Trump with the “strongest economy in the world” when he exited office.  Truly, a mind boggling version of events. 

It should be noted that it’s highly unlikely that Joe wrote these statements himself or that he is fully aware of what he is saying (like most of his presidency).  However, if this is the DNC’s fantastical historical revision then it needs to be addressed.

As soon as Joe Biden was “elected” in November of 2020, illegal immigration began to surge.  With Trump on the way out the signal had been sent to begin flooding the southern border.  Efforts among globalist NGOs and the UN to fund and equip migrant caravans started well in advance of the election.  Once in office, the Biden Administration oversaw the worst immigrant invasion in US history.

Apprehensions, catch and release, amnesty claims and unchecked crossings skyrocketed. 

Biden certainly did not leave office with less illegal immigration than when he entered.  His claim that crossings were in decline at the end of his term is technically true, but this was not because of any policy his administration enforced.  It was, in fact, the state of Texas and their “Operation Lone Star” designed to lock down their vast border. This project resulted in a 74% decline in crossings in 2024.

Measures included cargo containers and razor wire as deterrents to illegal migrants, as well as increased border patrols.  The Democrats consistently interfered in these efforts, using a temporary Supreme Court ruling to justify tearing down razor wire and actively allow migrants to pass in direct violation of the constitutional mandate to protect US states from foreign invasion.  

The argument that the pandemic triggered the border surge is nonsensical.  Covid restrictions under Trump that ended asylum claims (Title 42) initially slowed the already low crossing numbers to a crawl.  The explosion in crossings occurred after Biden’s election.   

Almost immediately upon Biden’s exit and Trump’s return, a handful of policy changes resulted in a 95% drop in illegal border crossing.  Not only that, but migrant camps in Mexican towns just across the southern border disappeared.  Meaning, all the Democrat claims that these migrants were “fleeing poverty, war and persecution” were completely fabricated.  If that had been true, then the migrants would have stayed at the border because they would have had nowhere else to go.

The shut down of the Democrat’s CBP One mobile application (which streamlined asylum claims) was the final nail in the coffin for their immigration agenda.  Illegal crossings are now at lows not seen since 1970, and a new border wall was not even necessary. 

Sadly, the US is still dealing with the aftermath of Democrat control and the migrant invasion. An estimated 10 million illegals entered the country on Biden’s watch, adding to already high numbers of illegals over the course of the past 20 years.  Democrats continue to misrepresent the history of these events, just as they continue to obstruct any attempts to deport the foreigners they allowed in. 

Tyler Durden
Sun, 03/01/2026 – 15:45

via ZeroHedge News https://ift.tt/f9yBcgY Tyler Durden

The Trump Administration Ditches Another Rogue DOJ Official

The Trump Administration Ditches Another Rogue DOJ Official

Authored by Tudor Dixon via American Greatness,

The second Trump administration is very different from the first. As 45th president, Donald Trump was saddled with disloyal officials who constantly undermined his agenda. The Ukraine impeachment scandal, among other events, was the result of this internal subversion.

But the second term sets a new standard for loyalty.

The administration will no longer tolerate rogue officials making their own policy.

This was made clear last week when the administration pushed out Gail Slater, the Justice Department’s antitrust chief.

Slater made a name for herself by going against administration policy and insisting on her personal priorities. While some misguided conservatives praised Slater as a “MAGA patriot,” her record reveals a very different streak. She was weak on China, weak on defending free speech, and weak on combating woke corporations.

Her departure signals that the second Trump administration is serious about ensuring officials are committed to the president’s agenda.

Slater ran afoul of the administration in her incorrigible opposition to the HPE-Juniper merger. The merger was supported by national security experts in the administration as necessary to counter the growing menace of Chinese tech dominance. The merger would allow American companies to coalesce resources to take on Huawei on the world stage. 

One official told Axios last year that blocking the deal would have “hindered American companies and empowered” Chinese entities. But Slater was resolutely opposed to it, in spite of the national security claims raised. The administration overruled her objections and approved the deal anyway. “Competition is global, and a combined HPE-Juniper is a stronger bulwark against that, against Huawei,” a government source told Fortune on why the administration approved the merger. “It will be the only U.S.-based company that provides the entire technology stack that Huawei does.”

It should be noted that one of Slater’s deputies who oversaw this matter was a Chinese sympathizer. Roger Alford was one of Slater’s key allies in the DOJ’s Antitrust Division before he was forced out last year. He boasts a record of praising China since the early 2010s and once even criticized Trump to a Chinese audience over his desire to reform the trade imbalance between the two countries.

Slater has a dubious record on free speech. In 2020, she signed on as a member of a project dedicated to formulating a framework for “moderating speech online.” The report, in which her name appears as an endorsee, praised social media companies for suppressing “misinformation” about COVID-19 and “hate speech.” The study also urged governments to take a proactive stance on “moderating” online content to ensure that liberal standards are enforced.

While Slater and her allies like to proclaim her as a bold populist standing up against corporate power, she approved one of the more concerning business moves in recent history. Disney, which stands as one of the wokest companies in the country, was able to add important NFL media assets to its empire. The deal raised eyebrows for giving the NFL partial ownership of ESPN, which is supposed to be an independent body covering the league, as well as for allowing Disney to grow even larger in the market. Experts warned the deal could result in price hikes for consumers and violate the spirit of antitrust laws. But Slater seemed unmoved by these arguments and approved the deal before departing from the DOJ.

It’s unclear how it serves the nation to defend the interests of Huawei and Disney, but Slater made a point to do so in her role at the DOJ.

If we want to make America great again, Trump needs reliable team players to enact his agenda. Slater did not fit the bill. She had her own agenda that did not fit with the MAGA one. That’s why she’s out of office.

Tyler Durden
Sun, 03/01/2026 – 15:10

via ZeroHedge News https://ift.tt/Qy4ZS3h Tyler Durden

Oil Soars Over 10% In OTC Trading, Whether That Sticks Depends On How Long The War Lasts

Oil Soars Over 10% In OTC Trading, Whether That Sticks Depends On How Long The War Lasts

With war in the middle east raging, and the world’s most important oil transit choke point – the Straits of Hormuz which accounts for 20% of daily global oil transit – “effectively” halted after at least three ships were attacked in the vicinity of the waterway – even as Iran’s Foreign Minister Abbas Araghchi told Al Jazeera TV his country has no intention to close the Strait of Hormuz and has kept it open so far, markets have just one question: where does oil open when futures resume trading in a few hours. 

Well, we can tell you: according to the IG Weekend Market, an OTC market that reflects prices across over the counter exchanges, oil is set to open more than 10% higher, with spot WTI trading around $75 and Brent set to rise over $80.

Source: IG

That’s not the question: the question is where does oil trade in a week, a month, a year, and – tied to that – what happens to the oil price curve.

The price spike comes despite OPEC+’s announced modest supply hike. But for such gains will sustain, or extend, investors will need to decide that the conflict is going to drag on. Indeed, this new wave of war is bigger, broader and messier than last June’s fighting. The gap between attacks and retaliation has narrowed: In previous waves it took days, but now it’s hours.

As Bloomberg’s Garfield Reynolds reminds us, during the 2003 invasion of Iraq by US-led forces, crude actually tumbled at the start of hostilities, on speculation the US would achieve a rapid victory. It ended up rebounding from an April trough to enter a long uptrend as it became clearer that there would be no straightforward resolution. 

The stakes are higher for oil this time. Iran’s output accounts for more than Iraq’s did in 2003, and Iraq had much less capacity to threaten the Strait of Hormuz. Iran has said it doesn’t plan to close the key shipping channel, but there have already been signs that the conflict is halting tanker traffic.

“Tankers are starting to build by the Strait of Hormuz, but nothing seems to be going through at the moment – tankers are definitely spooked,” said Matt Smith, oil analyst at energy consulting firm Kpler.

That means any lack of clarity on the endgame increases the potential for sustained advances in crude over the coming weeks. Any signs of a prolonged and drawn-out struggle boost the likelihood of crude reaching $80 a barrel and beyond, with Bloomberg Economics outlining a scenario that sees oil spiking above $100 in an extreme disruption scenario.

Sure enough, Middle East leaders have warned Washington that a war on Iran could lead to oil prices jumping to over $100 per barrel, said veteran OPEC analyst Helima Croft from RBC. Analysts from Barclays also said prices could rise to $100.

Other analysts see a more modest jump depending on how the conflict develops. Prices should rise by at least $3 to $5 per barrel when trading starts, said Andy Lipow, president of Lipow Oil Associates. 

The worst-case scenario is an attack by Iran on Saudi oil infrastrucure followed by a complete closure of the Strait, Lipow said Sunday. Oil prices would jump by $10 to $20 in this scenario, the analyst said, which he put at a 33% likelihood. 

And so, while the world waits to see next steps, it’s buying oil and asking questions later. The attacks already are much wider in scope than last June. Iran’s response already has gone beyond the retaliation it offered in the opening stages of June’s war.

For its part, Bloomberg’s economists thing Iran’s response will continue to escalate. While it can’t match the US’ military superiority, Iran can impose significant costs and seek to bog the US down in the region. Iran’s targets already include US bases in the region and Israel. Tehran could expand to energy infrastructure and regional shipping routes, either directly or through its partners in the region. That includes the Houthis in Yemen, who’ve said they’ll resume their disruption of shipping in regional waters. The possible outcomes are laid out in the chart below.

Source: Bloomberg

The price of oil will ultimately be determined by where the war finds its equilibrium point. 

In a possible indication that the oil price spike will be brief, Trump said Sunday that Iran wants to talk and he has agreed to do so, leaving open the possibility that there might be a path to de-escalation that avoids a big, prolonged disruption.

“They want to talk, and I have agreed to talk, so I will be talking to them,” Trump told The Atlantic on Sunday. The president told CNBC that U.S. military operations in Iran are “ahead of schedule.”

Tyler Durden
Sun, 03/01/2026 – 14:31

via ZeroHedge News https://ift.tt/VL4e1lE Tyler Durden

Robert De Niro Could Face 5 Years In Prison Over Trump “Get Rid Of Him” Threats

Robert De Niro Could Face 5 Years In Prison Over Trump “Get Rid Of Him” Threats

Authored by Steve Watson via Modernity.news,

Bill O’Reilly has called for the Secret Service to haul in Robert De Niro for an “intensive interrogation” following the actor’s repeated threats against President Trump, warning that De Niro could face up to five years behind bars if convicted under federal law.

The demand comes amid growing scrutiny of De Niro’s unhinged anti-Trump rants, which have exposed the depths of Trump Derangement Syndrome among leftists desperate to undermine America First leadership.

O’Reilly zeroed in on De Niro’s recent MSNBC interview where the actor repeatedly declared “we got to get rid of him” in reference to Trump.

“Now, he said the words, ‘we got to get rid of him’ three times,” O’Reilly stated.

He slammed MSNBC host Nicolle Wallace for failing to challenge De Niro on the spot.

“Any interviewer other than Nicole Wallace would have said, ‘what do you mean by that? He’s elected. 77 million people voted for him,’” O’Reilly noted.

“What’s ‘we got to get rid of him?’ Are you talking about impeachment? What are you talking about?” he added.

O’Reilly then put himself in the shoes of the Secret Service director, emphasizing the gravity of such statements given the recent assassination attempts on Trump.

“So, I’m watching this and I’m the head of the Secret Service,” O’Reilly said.

“USC, US code 871, it is a crime to threaten not only the president of the United States but the vice president and everybody else in succession,” he added.

“And with Donald Trump and the assassination attempts, this goes WAY up,” the host stressed.

“Okay, so I’m the Secret Service director and I’m seeing this three times, ‘we got to get rid of him’ — I got agents pulling De Niro in for a Q&A and he better have a lawyer,” O’Reilly asserted.

He warned that De Niro’s responses during questioning could lead to charges, noting “Now, you could charge him based upon his answers to the interrogation.”

“If he takes the fifth, a refused answer on the grounds, right? You could charge him. And if he were convicted, he’d get 5 years in prison under this code,” O’Reilly urged.

As we previously reported, De Niro broke down in tears during that same MSNBC appearance, sobbing over Trump’s supposed “division” while claiming the President is “attempting to destroy this country.”

In the interview, De Niro spluttered, “You have to lift people up. You can’t divide people… this thing (Trump) they’re destroying, attempting to destroy this country and maybe not even understanding why. It’s up to us to protect the country.”

He also ranted about Trump refusing to leave the White House, stating, “We see it we see it we see it all the time, he will not want to leave.”

De Niro has previously labeled Trump advisor Stephen Miller a “Nazi,” adding, “He’s a Nazi. Yes, he is, and he’s Jewish and he should be ashamed of himself.”

“Everything, the point is we have to keep fighting and pushing until he is out, period. There’s no other way. He’s not going to want to leave the White House,” De Niro has insisted.

O’Reilly’s analysis highlights how Hollywood’s unchecked hatred is now crossing into potential legal territory, especially as Trump’s policies expose the failures of leftist agendas.

Your support is crucial in helping us defeat mass censorship. Please consider donating via Locals or check out our unique merch. Follow us on X @ModernityNews.

Tyler Durden
Sun, 03/01/2026 – 14:00

via ZeroHedge News https://ift.tt/T584tvd Tyler Durden

OPEC+ Agrees To Boost Oil Output As US War On Iran Disrupts Shipments

OPEC+ Agrees To Boost Oil Output As US War On Iran Disrupts Shipments

On Sunday, OPEC+ agreed to boost oil output by 206,000 barrels per day for April just as the U.S.-Israeli war on Iran and Tehran’s retaliation disrupted oil flows from key members of the producer group in the Middle East.

It had debated options ranging from 137,000 bpd to 548,000 bpd, according to five sources. The agreed increase, which brings an end to a three-month pause in production hikes, represents less than 0.2% of global supply.

The meeting on Sunday involved only eight members of OPEC+ – Saudi Arabia, Russia, the UAE, Kazakhstan, Kuwait, Iraq, Algeria and Oman. OPEC+ groups the Organization of the Petroleum Exporting Countries and allies like Russia but most production changes in the past years have been done by the eight members. Iran, perhaps understandably, was missing. The eight members raised production quotas by about 2.9 million bpd from April through December 2025, roughly 3% of global demand, before pausing increases for January to March 2026 due to seasonal weakness.

OPEC+ has traditionally raised oil output to cushion disruptions but analysts quoted by Reuters, said the group currently has little spare capacity to add to supply, except for its leader Saudi Arabia and the United Arab Emirates, which will also struggle to export oil until navigation in the Gulf returns to normal.

Riyadh has been increasing oil production and exports in recent weeks by around 500,000 bpd in preparation for US strikes on OPEC+ member Iran, sources also told Reuters.

The near-term impact on oil prices remains unclear: oil, gas and other shipments from the Middle East via the Strait of Hormuz have come to a halt since Saturday after shipowners received a warning from Iran saying the area was effectively closed for navigation. There was confusion later in the day, when Iran’s Foreign Minister Abbas Araghchi told Al Jazeera TV his country has no intention to close the Strait of Hormuz and has kept it open so far. 

Hundreds of ships dropped anchor and were not moving on Sunday and several ships came under attack, as reported earlier. Hormuz is the world’s most important oil route accounting for over 20% of global oil transit.

Despite fears of a glut that would weigh on prices, global benchmark Brent crude has rallied this year and jumped on Friday to $73 per barrel, the highest level since July, on fears of a wider conflict in the Middle East. In other words, as nat gas trading legend John Arnold (first at Enron then at Centaurus) much of the conflict is already in the prices, although what happens next depends on how long any Hormuz closure lasts. As Arnold also explains, while the market was somewhat hopeful a war could be avoided, Iran’s response thus far suggests a below expectations ability to materially disrupt supply which would suggest any oil price spike is temporary.

While oil may be volatile in the near-term, there is less doubt what happens to shipping charters in coming days: they will soar. As the FT reported, insurers told ship owners on Saturday they would cancel policies and raise coverage prices for vessels traveling through the Gulf and Strait of Hormuz after the US and Israel attacked Iran.

War risk insurers on Saturday submitted cancellation notices for policies covering ships moving through the key oil chokepoint, brokers told the FT, with prices set to rise as much as 50% in the coming days. The unusual move to submit these notices before trading resumes on Monday underscores the pace of escalation after Iran launched retaliatory strikes against US bases across the Middle East. 

Insurance prices for ships travelling through the Gulf had been about 0.25 per cent of the replacement cost of a vessel. They could now jump by as much as half, Dylan Mortimer, marine hull UK war leader at broker Marsh, told the FT.

For a $100mn vessel, this would mean an increase from $250,000 to $375,000 per voyage.

Of course, the greatest concern among underwriters is whether Iran would close the Strait of Hormuz: Insurers were also pricing in expectations that Iranian proxies may attempt to board and seize vessels, he added.

“If Israel and US are continuing to strike Iran . . . it’s more likely that Iran will start trying to leverage their control via the manipulation of shipping in the region,” Mortimer said.

As a result of the regional war, some ship owners are now fully turning away from the Strait of Hormuz, through which about a fifth of the world’s crude oil flows. On Saturday at least three ships turned away from the strait, rather than pass through it, as shipowners assessed the risk of being attacked in the narrow waterway.

Yet the probability of a long-term Straits shutdown will be mitigated by an unlikely source: some 80% of Iran’s oil exports, about 1.6 million barrels per day, go to China, and Beijing will do everything in its power to preserve this lifeline and remove any Hormuz blockage…

… as will Iran because after a few days of zero revenue, the regime – which is being bombed constantly by the US and Israel – will be in desperate need of cash to keep the military happy. 

Going back to OPEC+ output increase, Jorge Leon, a former OPEC official who now works as head of geopolitical analysis at Rystad Energy said it is unlikely to calm markets. Indeed, Brent traded 8%-10% up around $80 per barrel over the counter on Sunday, traders said.

“Prices will respond to developments in the Gulf and the status of shipping flows, not to a relatively small increase in output.”

Middle East leaders have warned Washington that a war on Iran could lead to oil prices jumping to over $100 per barrel, said veteran OPEC analyst Helima Croft from RBC. Analysts from Barclays also said prices could rise to $100.

Croft said the market impact from any OPEC output increase will be limited due to a lack of production capabilities outside Saudi Arabia.

“A tighter market in the first quarter allows the group to continue increasing the quota, however real barrels being added to the market will be a fraction of it,” said Giovanni Staunovo, an oil analyst at UBS. OPEC+’s declining level of spare capacity might have been a factor behind the decision not to opt for a larger boost, he said.

Tyler Durden
Sun, 03/01/2026 – 13:45

via ZeroHedge News https://ift.tt/M2VtCGL Tyler Durden

CNN Forced To Admit Dems Are Tanking On Immigration Despite Anti-ICE Propaganda

CNN Forced To Admit Dems Are Tanking On Immigration Despite Anti-ICE Propaganda

Authored by Steve Watson via Modernity.news,

Fresh analysis lays bare the Democrats’ crumbling position on immigration, with voters trusting Republicans more than ever to handle border security—even as radicals ramp up their attacks on ICE and deportations.

CNN data analyst Harry Enten highlighted the stark shift during a recent segment, noting that despite the barrage of anti-ICE rhetoric, Democrats are faring worse now than during Trump’s first term.

“Despite EVERYTHING that’s been going on, Democrats in a WORSE position than Trump’s 1st term!” Enten said.

He pointed to polling data showing voters believe “They think Democrats will do a WORSE JOB on immigration than Republicans.”

On border security specifically, Enten added: “Border security? HELLO! 2018, Republicans up 13. The advantage is a little LARGER NOW, up 15 points!”

Dismissing any notion that Democrats could capitalize on the issue, he concluded: “The idea Democrats can take the ball and run away on it? Polling says NO, NO, NO.”

This comes amid a wider hardening of public attitudes toward immigration enforcement. Republicans now hold a five-point lead on who Americans trust more on immigration—a complete reversal from Democrats’ six-point edge in 2018.

The propaganda stemming from places like Minnesota against ICE has clearly failed, as Enten’s breakdown confirms.

These developments build on the groundswell of support for deportations. As detailed in our earlier report on overwhelming American demand for deporting illegals and full ICE cooperation, polls from outlets like Cygnal and Harvard Harris showed 73% agreeing illegal entry is a crime, 61% backing deportations, and 67% insisting on local officials working with federal authorities.

Multiple surveys reinforced this, with 55% to 64% favoring mass deportations across sources like the New York Times, Marquette, CBS News, and ABC News. Enten himself previously noted this “uniformity across four pollsters” as a “majority view,” with 63% supporting deporting recent arrivals and 87% for those with criminal records.

The leftist frenzy only amplifies this backlash. Incidents like this Minnesota woman stalking and abusing ICE agents tracking a child rapist murderer illegal, showcase the radicals’ dangerous obstruction. 

Her chilling admission that she “doesn’t care” about victims underscores the extremism driving voters away.

From high school assaults on pro-ICE students to AOC’s “teach-ins” on interfering with operations, these tactics are fueling everyday Americans to rally behind Trump’s crackdown.

DHS reports spikes in threats and assaults on agents, yet the public tide turns harder against open borders. With 55% now wanting decreased immigration levels—the highest since post-9/11—globalist policies are being rejected outright.

As Enten’s latest numbers prove, the Radical Left’s sabotage is collapsing under its own weight. Trump’s push to secure borders and empower ICE isn’t just popular; it’s the mandate restoring sovereignty and safety to American streets.

Your support is crucial in helping us defeat mass censorship. Please consider donating via Locals or check out our unique merch. Follow us on X @ModernityNews.

Tyler Durden
Sun, 03/01/2026 – 12:50

via ZeroHedge News https://ift.tt/rVRZGWX Tyler Durden

Convicted Child Sex Offender To Run For Office In California

Convicted Child Sex Offender To Run For Office In California

You can already hear some liberals and left-leaning libertarians now:  “He paid for his crime, right?  So what’s the problem? What about the politicians mentioned in the Epstein files…?”

But “whataboutism” is not a valid argument for rationalizing societal decay.  And if America isn’t capable of applying the most basic standards at the lowest levels of government, then America is lost.

Rene Campos, a registered sex offender, is seeking elected office in California – launching a campaign for Fresno City Council amid fierce backlash and renewed questions about whether someone with his record should hold public office.

Campos was arrested in 2018 following a cyber tip to the Central California Internet Crimes Against Children Task Force.  He was found in possession of child sex abuse material, according to court records. In 2021 he entered a no-contest plea to a single misdemeanor charge of possessing and controlling child pornography/child sex abuse material (likely under California Penal Code § 311.11).  He served only one month in prison and a two year probation period.

Campos describes himself as a gay man who is running for office on the platform of “reduced crime and rehabilitation.”


Possession of child pornography is typically treated as a felony, even in a woke haven like California.  How the Fresno candidate was able to make a deal for a misdemeanor charge and spend only one month in prison is a mystery, but this does help to confirm ongoing suspicions that California’s legal system is falling into steep decline. 

California is notoriously soft on child sex abusers.  Recently, a Sacramento parole board released Daniel Allen Funston, who was convicted in 1999 of sixteen counts of kidnapping and child molestation after a horrific crime spree in Sacramento County, during which he kidnapped, raped, and beat eight children ages 3 to 7. 

Funston was originally sentenced to three consecutive life terms plus 20 years, but was set free at age 64 due to a California elderly inmate program (maybe he’ll run for office, too).  

Data from 2022 shows that the Golden State released over 7000 child sex offenders after less than one year of incarceration.  Interestingly, “digital blocks” were added to the Megan’s Law website that prevent more recent analysis. 

State Senator and LGBT activist Scott Weiner has supported multiple pieces of legislation that help to reduce punishments for sex offenders.  He authored a bill in 2017, signed into law, which created a three-tier sex offender registry system in California. It allows some “lower-risk” offenders (including those convicted of misdemeanor possession of child pornography) to petition for removal from the registry after 10-20 years (Tier 1 or 2), rather than lifetime registration. 

Perhaps the most disturbing factor is that in California a candidate like Campos actually has a good chance of winning.  He is a member of the LGBT community, a minority, and he appeals to the progressive desire to prove that laws are “artificial constructs” and that criminal convictions should not “define a person.”  In other words, Campos could win the election simply because he gives leftists an opportunity to prove that even the worst criminals are merely downtrodden victims who were never given a chance to succeed.   

Tyler Durden
Sun, 03/01/2026 – 12:15

via ZeroHedge News https://ift.tt/WVOzu8i Tyler Durden

Market Topping Process?

Market Topping Process?

Authored by Lance Roberts via RealInvestmentAdvice.com,

As we will discuss further in today’s commentary, the market remains stuck in a fairly narrow trading range. The week opened with a broad selloff after Anthropic’s expanded AI capabilities rattled software, cybersecurity, and financial stocks, with IBM suffering its worst session since 2000. CrowdStrike and Zscaler also dropped about 10% on the news. The financials sector fell more than 3% as American Express, Goldman Sachs, and Blackstone came under pressure on fears that AI could automate large portions of their businesses. A widely circulated Citrini Research piece warning of 10% AI-driven unemployment gave bears a macro narrative.

Yet the “AI kills everything” narrative ignores what the data actually shows: companies are integrating AI, not dying from it. McKinsey’s 2025 State of AI survey found 88% of firms already use AI in at least one business function, up from 78% a year prior, while by Q1 2026, that figure reached 78% of U.S. corporations scaling AI enterprise-wide, according to Netguru. Salesforce’s Q4 2026 earnings showed over 22,000 Agentforce deals closed in the quarter, with combined AI and Data Cloud ARR surging to $1.8 billion from $1.4 billion just three months earlier, proving enterprise buyers are choosing to buy AI tools from incumbents rather than be replaced by them.

Deloitte’s 2026 State of AI in the Enterprise report found that two-thirds of organizations already report productivity and efficiency gains, while a Harvard study showed that consultants using AI completed tasks 25% faster and at 40% higher quality, augmentation, not elimination. Goldman Sachs Research estimates AI-driven productivity could lift global GDP by 7% (roughly $7 trillion) and sees the next phase of the AI trade rotating precisely toward “productivity beneficiaries,” the non-tech companies that harness AI to widen margins.

Meanwhile, LPL Research notes that BLS data already shows real output rising 5.4% while hours worked grew just 0.5%, and that only 5.7% of U.S. job hours currently involve generative AI, meaning the largest productivity gains are still ahead, not behind us.

The crucial point to consider is that the IBM selloff and SaaS panic of this year may ultimately look less like the beginning of a displacement cycle and more like the kind of reflexive fear that preceded every prior wave of technological adoption. We have seen this same cycle, from ATMs (which reduced bank teller employment) to cloud computing (which expanded, not destroyed, enterprise software). Notably, the companies that adapt capture outsized value, and the ones that don’t were already failing for other reasons.

The main event came on Wednesday after the close. Nvidia reported fiscal Q4 revenue of $68.1 billion, beating the $65.9 billion consensus by 3.3%. Notably, it guided Q1 to $78 billion, well above the $72.8 billion estimate. Data center revenue totaled $62.3 billion, up 75% year over year. However, the stock still fell 5% on Thursday as investors flagged a lack of detail on lingering China uncertainty. However, Nvidia currently trades at a deep discount to the broad market index. While the S&P trades near 22x earnings, Nvidia’s forward PE is 17x with a 0.45 price-to-earnings-growth ratio. With EPS expected to grow by 39.2% over the next 5 years, the fundamentals are compelling. By focusing on a possible future event that may or may not occur, they may miss a fundamentally strong company trading at a discount.

The big risk worth watching is that tariff policy remains in legal limbo after the SCOTUS ruling. The AI disruption narrative is broadening beyond software into financials and logistics. And the extreme rotation into Energy, Materials, and Industrials (up 21%, 17% and 12% respectively) has left positioning dangerously one-sided against Technology.

Resilience is not the same as safety.

Which brings us to the market.

Market Topping Process? Yes or No.

The question facing equity investors in early 2026 is deceptively simple: Is the stock market topping? This was a topic we touched on in Wednesday’s #DailyMarketCommentary:

“Technically, the market looks weak, as shown in the chart below. Momentum continues to fade along with Relative Strength. Furthermore, the market has been making lower highs as of late and is threatening to break important support at the 100-day moving average.”

Greg Feirman also touched on this concern, noting:

“While the S&P is only about 2% off its all-time highs, beneath the surface the market is showing signs of a top. Warren Pies tweeted today that there have been only two other times when Consumer Staples and Energy were up more than 10% and Technology and Financials were negative over the previous 63 trading days: 1990 (Desert Storm) and 2000 – both of which were market tops. Health Care – another defensive sector – has also been outperforming the S&P of late.”

Another warning came from the recent triggering of a “Hindenburg Omen.” The last time we discussed this warning was in early November:

Bottom line: market breadth is horrendous and will likely lead to a rotation favoring out-of-favor sectors and stocks. Thus, it’s not surprising that the Hindenburg Omen was triggered. If we continue to see more of these Omens, the threat of a drawdown grows.

At the time, Mega-Cap stocks were grossly outperforming the market, while many sectors lagged the market. Since that Hindenburg Alarm, our expectations have come to fruition. We have, in fact, seen a rotation favoring out-of-favor sectors and stocks.” Over the last month, the Hindenburg Omen has sent 6 alarms. The last batch of Hindenburg alarms signaled drawdowns in the leaders and strong performance in the laggards.

Lastly, as discussed over the last few weeks, the problem with the potential market-topping process is the divergence between the defensive names, which are extremely overbought, and the growth names, which are extremely oversold. However, those growth names are where the earnings and revenue growth reside. With that in mind, the next rotation could be from defensive names back to growth names, which are now trading at significantly lower forward PEs. Such a rotation would be exactly what often happens, as no one currently expects it.

If it isn’t a market top, then is the recent rotation out of growth and into defensive sectors merely the kind of healthy digestion that precedes a further leg higher?

These are the questions we will dig into today.

The Case for a Top: What the Bears See

The S&P 500 has spent recent weeks grinding in a range that has tested the patience of both bulls and bears. More notable than the index’s headline price action has been the dramatic shift beneath the surface: utilities, healthcare, and consumer staples have led the tape, while the mega-cap technology stocks that powered the bulk of the post-2022 rally have stalled or retreated. The Nasdaq 100’s underperformance relative to the equal-weight S&P 500 has reached levels not seen since the first quarter of 2022, a period that, it bears noting, preceded a punishing bear market leg.

For market technicians, the pattern is uncomfortably familiar. Market-topping processes throughout history, from 2000 to 2007 to 2021, have been preceded by precisely this kind of internal deterioration: narrowing leadership, defensive outperformance, and a growing divergence between price-weighted and breadth-based indicators. The question is whether history is rhyming again, or whether the analogy is misleading.

The most compelling argument that equities are in a market-topping process begins with the market’s internal structure. When investors rotate aggressively into utilities, staples, and healthcare sectors prized for their dividend yields and earnings stability rather than their growth prospects, it is typically a signal that institutional capital is seeking shelter. Money doesn’t move into Procter & Gamble and Duke Energy because portfolio managers are feeling adventurous. It moves there because they are seeking relative safety.

The breadth picture reinforces this concern. The percentage of S&P 500 constituents trading above their 200-day moving average has been declining even as the index itself has held near its highs, a classic negative divergence. We also see the same negative divergence in the market’s relative strength measures. In past market-topping processes, such divergences have preceded meaningful corrections by 2 to 6 months.

Then there is the yield curve. After a prolonged inversion that began in 2022, the curve’s re-steepening in late 2024 and into 2025 prompted some relief among investors who viewed the normalization as a sign the recession everyone feared had been avoided. But historically, the most dangerous period for equities is not during the inversion itself; it is in the 12 to 18 months after the curve un-inverts. The logic is straightforward: the curve steepens because the Fed is cutting rates in response to slowing growth, and the lagged effects of prior tightening are still working through the economy. By the time the damage becomes visible in earnings, the market-topping process has likely been completed.

Lastly, credit markets, while not yet flashing red, are showing early signs of strain. Investment-grade and high-yield spreads have widened modestly from their tightest levels, and dispersion within the high-yield market, particularly in private credit, has increased. Historically, credit leads equities, and the subtle deterioration in risk appetite in fixed income is difficult for equity bulls to dismiss entirely.

But let’s also discuss the bull case.

The Case for a Base: What the Bulls See

The bull case is not built on dismissing the rotation into defensives but on reframing it. Proponents of the view that the market is building a base, rather than a market-topping process, and point out that leadership transitions within a bull market are not inherently bearish. In fact, some of the healthiest and most durable advances in market history have been accompanied by exactly the kind of broadening and rotation currently underway.

Consider the precedent of 2016. After a narrow, FANG-led rally in 2015, the market experienced a gut-wrenching correction in early 2016 driven by growth fears and an oil price collapse. What followed was not a bear market but a powerful rotation: value outperformed growth, small caps outperformed large caps, and the equal-weight index began to lead. As shown, that outperformance remained intact for nearly 36 months before it failed.

The key distinction, then, is between rotation that signals deterioration and rotation that signals broadening. The former typically occurs alongside falling earnings estimates and rising unemployment claims. The latter occurs when the economy is resilient enough to support a wider set of winners. On this score, the fundamental backdrop remains constructive. Aggregate S&P 500 earnings estimates for the forward twelve months have continued to grind higher, not lower, which is a crucial differentiator from the pre-recession environments of 2000 and 2007, when estimates were rolling over well before the index peaked.

The labor market, while cooling from its post-pandemic tightness, has avoided the kind of abrupt deterioration that typically precedes a recession. Initial jobless claims, perhaps the single most reliable real-time indicator of labor market health, have remained contained.

Monetary policy also supports the bullish interpretation. The Federal Reserve’s pivot toward accommodation, whether through actual rate reductions or a clear willingness to ease if conditions warrant, provides an important backstop. Historical analysis from Ned Davis Research shows that when the Fed eases into an environment of positive earnings growth, the S&P 500 has posted gains in more than 80% of the subsequent 12-month periods. The combination of falling rates and rising earnings is, statistically, one of the most favorable macro regimes for equities.

The technical picture, while mixed, is not uniformly bearish either. The S&P 500 remains above its rising 52-week (1-year) and 208-week (4-year) moving averages. That 52-week moving average has been a consistent bullish “line in the sand” that, when lost and confirmed, has historically been one of the most reliable signals that a cyclical bear market is underway. As long as that trend anchor holds, the benefit of the doubt arguably belongs to the bulls. The most important trend line is the 208-week moving average. If that fails, the bears will have control of the market.

Moreover, sentiment indicators have swung sharply toward pessimism during the recent rotation, with the AAII bull-bear spread, the put-call ratio, and the CNN Fear and Greed Index all at levels that historically don’t suggest a market-topping process is underway. Market-topping processes are generally built on euphoria, not rising levels of uncertainty.

There is also a structural argument. The ongoing buildout of artificial intelligence infrastructure, the reshoring of manufacturing supply chains, and the capital expenditure cycle across the energy transition represent multi-year tailwinds for corporate earnings that extend well beyond the mega-cap technology cohort. If the AI investment cycle is broadening from the hyperscalers to the enterprise software layer and the industrial economy, then the rotation could have further to go.

So, which side do you pick?

The Verdict: Healthy Skepticism, Not Conviction

Markets rarely announce their intentions clearly, and the current environment is no exception. The bearish case rests on pattern recognition, the eerie similarity between today’s internal deterioration and the breadth collapses that preceded the last three major market topping processes, and on the arithmetic of valuation, which suggests that the margin of safety for equity investors is thinner than it has been in over two decades.

The bullish case rests on fundamentals that remain, for now, constructive: earnings are growing, the Fed is friendly, the labor market is intact, and sentiment is depressed enough to provide contrarian fuel. History shows that expensive markets with rising earnings can stay expensive far longer than value-oriented bears expect, and that defensive rotations within a secular uptrend are more often buying opportunities than exit signals.

The honest answer is that the market is at an inflection point where the evidence supports both interpretations. What will resolve the debate is not opinion, but price. As such, investors should pay close attention to key market levels, as noted in the Technical Update above.

  • The 100-day moving average remains a key bullish trend support.

  • The 200-day moving average is a critical support level for markets during a corrective process.

If the market breaks below the 100-day moving average, the market-topping process will likely be confirmed. If that happens, the next question for the bulls will be whether the S&P 500 can hold its 200-day average. The bulls, on the other hand, will need to see the market eventually confirm all-time highs on broader participation. A bull market can not last without the major sectors of Financials, Technology, and Healthcare providing support.

Key Catalysts Next Week

Traders face a packed week of macro data and heavyweight earnings beginning Monday, March 2nd. On the macro side, the week is bookended by two critical reads on the economy. ISM Manufacturing PMI lands Monday morning, after January’s surprise jump to 52.6 (the first expansion in 12 months), markets will scrutinize whether that rebound was genuine or simply a post-holiday reorder effect distorted by tariff front-running. A print below 50 would revive contraction fears and likely pressure cyclicals and small caps; a firm reading above 52 would reinforce the reflation narrative that has lifted Energy, Materials, and Industrials.

Wednesday is the ADP Employment Report and ISM Services PMI. Services never entered contraction, and ADP has shown a recovery in employment as of late. Then on Friday, the February Employment Situation (Nonfarm Payrolls) caps the week and will set the tone heading into mid-March. The key number will be the wage growth component; if average hourly earnings accelerate, it could push out rate-cut expectations and weigh on rate-sensitive sectors.

Earnings will also move the market next week: CrowdStrike (CRWD) reports after the close on Tuesday — the cybersecurity bellwether will offer a key read on enterprise security spend and the penetration of its Falcon Flex model. The market has priced in roughly a ±10% earnings move, so guidance will be the real catalyst. On Wednesday, Broadcom (AVGO) reports its fiscal Q1 2026 results with consensus revenue estimates near $19.2 billion.

Focus will be squarely on AI semiconductor revenue (guided to $8.2B for the quarter), custom ASIC demand from hyperscalers, and infrastructure software margins. Given the recent selloff in semis, a strong guide-up could reignite the AI trade. Thursday is Costco (COST) and Marvell Technology (MRVL), both reporting after the bell. Costco’s comparable sales trends and membership fee income will set the tone for the consumer, while Marvell’s data center revenue trajectory and Celestial AI integration update will add another data point to the AI infrastructure narrative.

Bottom line:

The bull trend is intact, but the “easy money” phase appears mature. The intermediate-to-long-term structure remains constructive. The 200-DMA is rising, breadth is near record levels, and the rotation trade is broadening participation. However, short-term momentum has deteriorated notably. The index is below both its 20- and 50-DMAs, the MACD has crossed bearishly, and the RSI is declining. Layer in the midterm election year seasonal headwinds, hotter-than-expected inflation, and Iran-related geopolitical risk, and the path of least resistance in early March tilts toward further consolidation or a modest pullback before the seasonal tailwinds attempt to reassert themselves. I suspect we will get a better entry point for a rally as we move into March. However, use that opportunity to rebalance oversized winners, define risk levels, and avoid chasing strength. Don’t fight the trend, but protect gains if volatility inevitably returns.

There is currently no evidence to suggest that the current rotation is the opening act of a more ominous distribution phase. However, that does not mean the evidence won’t eventually manifest. Therefore, investors who position dogmatically for a specific outcome are taking a lower-probability bet than those who remain flexible, watch the key levels, and let the tape itself provide the answer.

As the old market adage goes: the trend is your friend until it bends. The trend has not yet broken. But it is bending.

Tyler Durden
Sun, 03/01/2026 – 11:40

via ZeroHedge News https://ift.tt/m8IyUkn Tyler Durden