Submitted by Charles Hugh-Smith of OfTwoMinds blog,
The question of "recovery" really boils down to this: how much longer can the top 10% prop up the expansion?
A flurry of recent media stories have addressed housing unaffordability, for example Why Middle-Class Americans Can't Afford to Live in Liberal Cities.
The topic of housing unaffordability crosses party lines: Housing Ownership Back to 1995 Levels (U.S. Census Bureau).
Other stories reflect an enduring interest in the questions, what is a living wage?and what is a middle-class income? These questions express the anxiety that naturally arises from the sense that we're sliding downhill in terms of our purchasing power–a reality that is confirmed by this chart:
Here's a recent story that delves into the question of "getting by" versus "middle class": How Much Money Does the Middle Class Need to Get By?


"Just getting by" in costly coastal cities requires an income in the top 20%: around $60,000 for individuals and $100,000 for households.
The article references MIT's Living Wage Calculator, which I found to be unrealistic in terms of the high-cost cities I know well (Honolulu and the San Francisco Bay Area). It appears the calculator data does not represent actual rents or food prices; the general estimates it uses woefully under-represent on-the-ground reality.
Current market rents in the S.F. Bay Area far exceed the estimated housing costs in this calculator, and that one line item pushes the living wage from $36,000 for two adults closer to $45,000 in my estimate–roughly the average wage in the U.S. (not the median wage, which is $28,000).
If you want to know where you stand income-wise, here is a handy calculator: What Is Your U.S. Income Percentile Ranking?
Here are the data sources:
Wage Statistics for 2013 (Social Security Administration)
2013 Household Income Data Tables (U.S. Census Bureau)
There are many complexities in these questions. For example, Social Security data does not include food stamps, housing and healthcare subsidies provided by the government, etc., so lower-income households' real (equivalent) income is much higher than the published data.
Then there are the regional differences, which are considerable; $50,000 in a Left or Right Coast city is "just getting by" but it buys much more in other less pricey regions.
As for what household income qualifies as "middle class"–it depends on your definition of middle class. In my view, the definition has been watered down to the point that "middle class" today is actually working class, if we list attributes of the "middle class" that were taken for granted in the postwar era of widespread prosperity circa the 1960s.
In What Does It Take To Be Middle Class? (December 5, 2013), I listed 10 basic "threshold" attributes and two higher qualifications for membership in the middle class. Please have a look if you're interested.
I came up with an annual income of $106,000 for two self-employed wage earners and the mid-$90,000 range for two employed wage earners, the difference being the self-employed couple have to pay 100% of their healthcare insurance, as there is no employer to cover that staggering expense.
$90,000 puts a household in the top 25%, and $101,000 places the household in the top 20%. $150,000 a year qualifies as a top 10% household income.
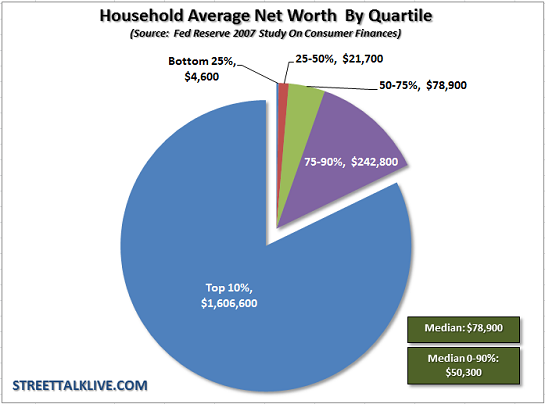
If we set aside income and consider net worth, net worth (i.e. ownership of assets and wealth) of most households is modest:
This shows the decline in household wealth since 2003:
Can an economy in which the majority of households are "just getting by" experience robust growth, i.e. "recovery"? If we discount the millions of households who are paying for today's consumption with tomorrow's earnings, i.e. credit cards, auto loans, student loans, etc., I think it's self-evident that only the top 20% (and perhaps really only the top 10%) have the income and net worth to expand a $16 trillion economy.
By definition, the top 10% cannot be "middle class." Yet it seems that these top 12 million households are propping up the "recovery"–dining out at pricey bistros, paying $200 a night for hotels, buying homes that cost $500,000 and up, paying slip fees for their boats, funding their children's college education with cash rather than loans, etc.
The question of "recovery" really boils down to this: how much longer can the increasing debt of the bottom 90% and the wealth of the top 10% prop up the expansion?
via Zero Hedge http://ift.tt/108iB14 Tyler Durden