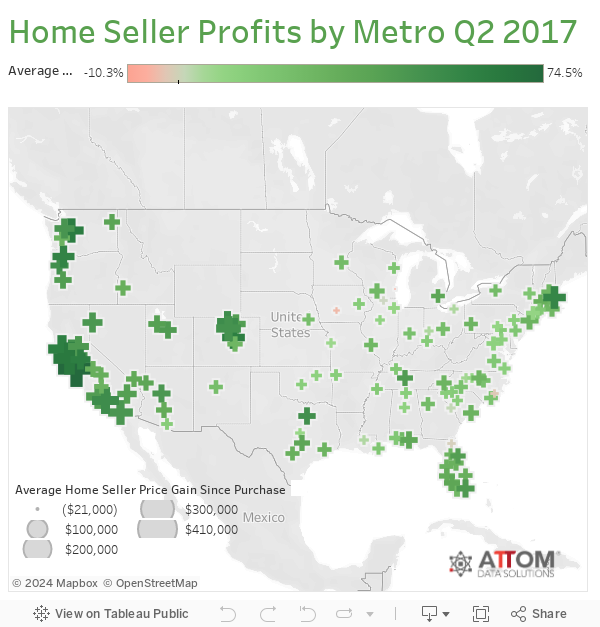
ATTOM Data Solutions released its Q2 2017 U.S. Home Sales Report, which shows that homeowners who sold in 2Q 2017 realized an average price gain of $51,000 since purchase. To put that in perspective, that is the highest average price gain for home sellers since Q2 2007, when it was $57,000 and the U.S. was in the midst of the biggest residential real estate bubble in history. Moreover, that average gain of $51,000 in Q2 2017 represented an average return of 26% on the original purchase price of the home, the highest average home seller return since Q3 2007, when it was 27%.
Here’s a great chart from ATTOM that breaks down the results by metro area. Not surprisingly, several northern California and Florida markets logged some of the biggest gains.
Of course, there is a slight catch. As RealtyTrac points out, while aggregate seller gains may be roughly the same as 2007, those gains are being spread over a much longer ownership period of roughly 8 years rather than 4 years. And while RealtyTrac attributes that longer ownership period to a tight housing market, we suspect it has something to do with the dichotomy of homeowners with those who purchased before the crash just now breaking even on their homes (no equity = hold longer) and those who purchased after the crash behaving more ‘normally.’
The report also shows that homeowners who sold in the second quarter had owned an average of 8.05 years, up from 7.85 years in the previous quarter and up from 7.59 years in Q2 2016 to the longest average homeownership tenure as far back as data is available, Q1 2000.
“Potential home sellers in today’s market are caught in a Catch-22. While it’s the most profitable time to sell in a decade, it’s also extremely difficult to find another home to purchase, which is helping to keep homeowners in their homes longer before selling,” said Daren Blomquist, senior vice president at ATTOM Data Solutions. “And the market is becoming even more competitive, with the share of cash buyers in the second quarter increasing annually for the first time in four years.”

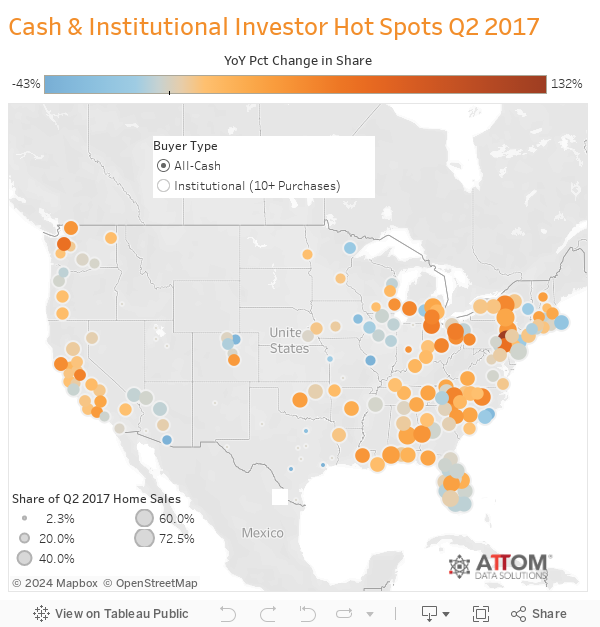
Meanwhile, institutional buyers continue to scoop up a record number of homes, particularly in the cheaper Southeast markets.
The share of U.S. single family home and condo sales sold to institutional investors (entities buying at least 10 properties in a calendar year) was 2.1 percent in the second quarter, up from 1.8 percent in the first quarter but down from 2.6 percent a year ago.
Among 73 metropolitan statistical areas with a population of at least 200,000 and at least 40 institutional investor sales in Q2 2017, those with the highest share of institutional investor sales in the second quarter were; Macon, Georgia (8.9 percent); Memphis, Tennessee (8.6 percent); Killeen-Temple, Texas (8.3 percent); Clarksville, Tennessee (7.8 percent); and Birmingham, Alabama (7.4 percent).
Counter to the national trend, 19 of the 73 metro areas (26 percent) posted year-over-year increases in the share of institutional investor purchases, including Memphis, Tennessee (up 6 percent); Charlotte, North Carolina (up 6 percent); Nashville, Tennessee (up 37 percent); Baltimore, Maryland (up 3 percent); and Raleigh, North Carolina (up 42 percent).
Of course, the problem with institutional buyers is that they tend to run in massive herds…and when the herd starts to sell…well, you can guess how that will play out.
via http://ift.tt/2v3poMn Tyler Durden