Authored by Gail Tverberg via Our Finite World blog,
Central bankers seem to think that adjusting interest rates is a nice little tool that they can easily handle. The problem is that higher interest rates affect the economy in many ways simultaneously. The lessons that seem to have been learned from past rate hikes may not be applicable today.
Furthermore, there can be quite a long time lag involved. Thus, by the time a central banker starts seeing an effect, it may be clear that the amount of the interest rate change is far too large.
A recent Zerohedge article seems to suggest that problems can arise with 10-year Treasury interest rates of less of than 3%. We may be facing a period of declining acceptable interest rates.

Figure 1. Chart from The Scariest Chart in the Market.
Let’s look at a few of the issues involved:
[1] The standard reason for raising interest rates seems to be concern about inflationary impacts occurring as a result of rising food and energy prices. In practice, the impact of such an interest rate change can be quite severe and quite delayed.
Figure 2 is an illustration from the Bureau of Labor Statistics website showing one of today’s concerns: rising energy costs. Food prices are not yet rising. Normally, however, if oil prices rise, the cost of producing food will also rise. This happens because modern agricultural methods and transportation to markets both require the use of petroleum products.

Figure 2. Figure created by the US Bureau of Labor Statistics showing percentage change in the Consumer Price Index between January 2017 and January 2018, for selected categories.
In fact, raising short-term interest rates seems to have been associated with trying to bring down rising food and energy costs, as early as the 1970s and early 1980s.
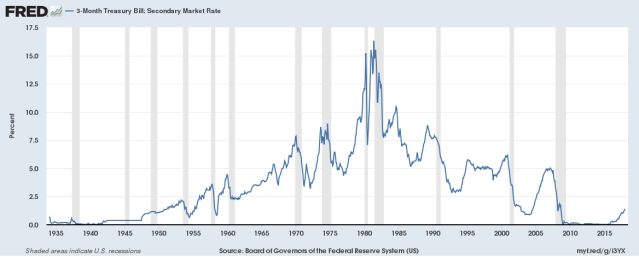
The reason why an increase in short-term interest rates is helpful is because it reliably induces a recession. A person can see the close connection between short-term interest rate increases and recessions (gray bars) in Figure 3. Recessions in turn damp down food and energy prices.
The reason why this damping down effect occurs is because when there is a recession, many people are laid off from work. These people purchase fewer goods and services. With people out of work, “demand” for goods and services falls. (Demand is very closely related to “amount affordable.”) We might think of demand for goods and services as helping to maintain the “production” of new homes, new cars, upscale food products, toys, and even consulting services.
When demand falls, fewer goods of practically every type are made. This indirectly leads to less need for commodities of many types, including oil, natural gas, metals, and food. Commodities have very long production cycles, and only modest storage facilities. When lower demand for a commodity such as oil occurs, prices tend to adjust sharply downward, in order to signal the need for lower production. Figure 4 shows that interest rate spikes corresponded to the 1973-1974 oil price spike, the 1979 oil price spike, the 2004-2008 price run-up, and perhaps to other shorter oil price spikes.

Figure 4. Annual averages of Brent oil prices (in 2016$) and 3-month average interest rates, based on data similar to that shown in Figure 3 from “FRED.”
The annual data in Figure 4 loses the detail of month-to-month variations. Because of this, it makes the impact of the Great Recession look much less severe than it really was. Figure 5, using monthly data for recent periods, shows more clearly the severe fall in oil prices following the run-up in short-term interest rates in the 2004-2007 period.
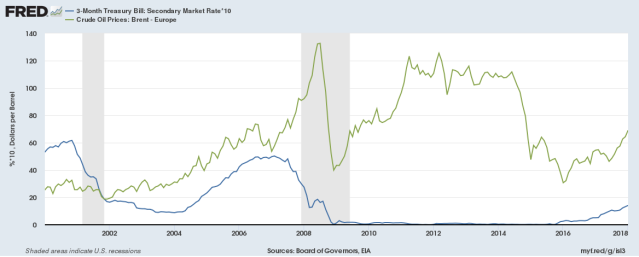
Figure 5. Three-month US Treasury interest rates and Brent oil prices, both on a monthly average basis. Graph by FRED.
If a person looks at the indirect impacts on the economy as a whole, it becomes clear that the rise in short-term interest rates was one of the proximate causes of the Great Recession of 2008-2009. I talk about this in Oil Supply Limits and the Continuing Financial Crisis. The minutes of the June 2004 Federal Reserve Open Market Committee indicate that the committee decided to start raising interest rates at a rate of 0.25% per quarter for the purpose of stopping the rise in energy and food prices.
The huge financial problems that indirectly resulted did not occur until four years later, in 2008. It is likely that most economists are unaware of the connection between the decision to raise rates back in 2004 and the Great Recession several years later.
[2] Higher energy prices squeeze a person’s “spendable income.” Higher interest rates have the same effect.
Economist James Hamilton showed that ten out of eleven recent recessions were associated with oil price shocks. We would argue that if an economy is subject to higher interest rates in addition to higher oil prices, the economy is doubly likely to go into recession. Figure 6 shows an illustration of the situation.
A wage earner’s pay does not normally increase as energy costs rise, or as interest costs rise. Even if energy and interest costs are well buried (in higher food costs, or in the higher cost of goods transported across the country, or in higher student loan payments) the amount of income that a person has available to spend on discretionary goods and services falls if energy and interest costs rise. Having both energy and interest costs take a bigger share of available income at the same time is especially a problem.
[3] Reduced interest rates can be used to conceal the adverse impact of rising energy prices.
This is another version of what we saw in Figure 6. If interest rates can be reduced, they can offset most of the bad impacts of higher energy prices. For example, if oil prices are higher, it helps if auto loans and mortgages loans are lower in cost.
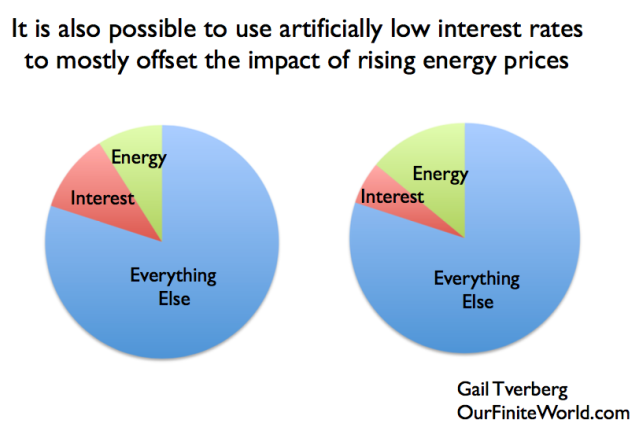
Figure 7. Image by author showing that artificially low interest rates can mostly offset the impact of rising energy costs.
Of course, central bankers don’t necessarily think this through. To what extent is today’s economy really dependent on very low interest rates?
[4] Falling interest rates have an almost magical impact on the economy. Rising interest rates reverse these magical impacts, and replace them with very negative impacts.
We saw in Figure 6 how falling interest rates could more or less conceal a rise in energy prices. The following are a few of the additional magical things that falling interest rates can do:
(a) Falling interest can raise asset prices of many kinds, including homes, stock prices, resale prices of bonds, and the price of land.
(b) Falling interest rates can raise commodity prices, making it possible to extract more fossil fuels and metals. Resources that previously did not look economic to extract, suddenly become economic to extract. This change occurs because with lower interest rates, more people can afford to purchase goods that use oil, such as cars and motorcycles. This tends to raise demand for oil products, and thus prices.
(c) Because higher-priced energy extraction becomes feasible at lower interest rates, more advanced technology, at higher prices, suddenly becomes feasible. Jobs open up in research areas that would not previously have made sense at lower energy prices.
(d) Falling interest rates can make the balance sheets of companies holding stocks and bonds as assets look better, because of their rising prices.
(e) Rising asset prices “feed back” into spendable income. People with homes that have risen in value can refinance, and use the proceeds to fix up their home (add an additional room or an updated kitchen, for example). Individual citizens and companies can sell shares of stock that have risen in value and use those proceeds to augment other income.
If interest rates rise rather than fall, the impacts can be expected to be extremely recessionary. The stock market may crash. Homes are likely to lose value because of a lack of buyers that can afford them. Energy resources that seemed to be available can suddenly seem not to be feasible because of low prices.
[5] The economy was able to reasonably tolerate the run-up in interest rates in the 1950 – 1980 period because the economy was growing very rapidly.
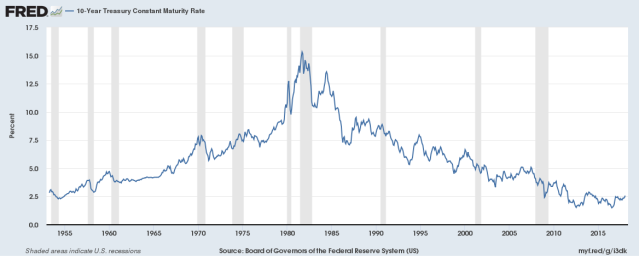
A person can see the pattern of short-term interest rates in Figure 3, above. Long-term (10-year) interest rates follow a somewhat similar, but smoother, pattern (Figure 8).
World per capita energy consumption was rising very rapidly in the 1950 to 1970 period. Even in the troubled 1970 to 1980 period, per capita energy consumption continued to rise, although not as quickly (Figure 9).
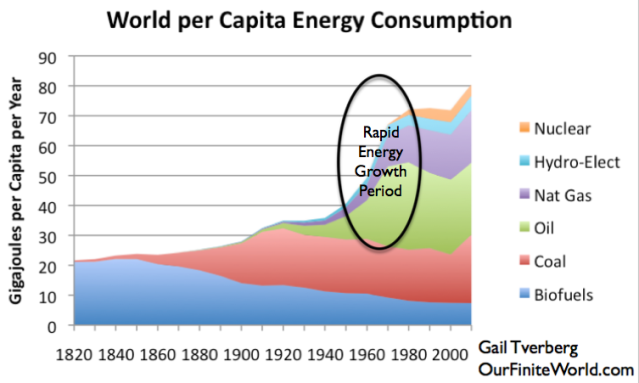
Figure 9. World per capita energy consumption, with 1950-1980 period of rapid growth highlighted. World Energy Consumption by Source, based on Vaclav Smil estimates from Energy Transitions: History, Requirements and Prospects (Appendix) together with BP Statistical Data for 1965 and subsequent, divided by population estimates by Angus Maddison.
When world per capita energy consumption is growing this rapidly, jobs tend to be plentiful and wages tend to rise faster than inflation. According to Figure 10, US wages rose more rapidly than inflation in the 1950 to 1970 period, without wage disparity becoming a problem. Even in the 1970 to 1980 period, when high oil prices were a problem, US wages were able to rise quickly enough to keep up with inflation. Rising wage disparity did not become a problem until after 1980.
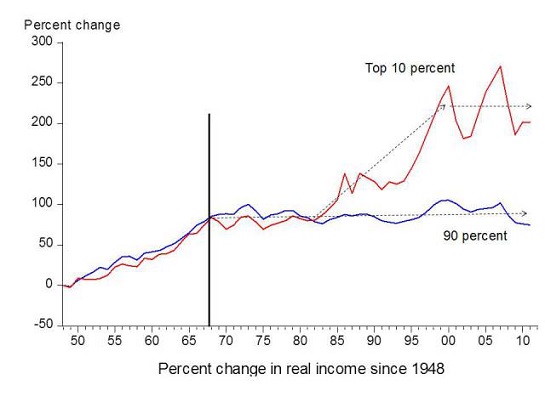
Figure 10. Chart comparing income gains by the top 10% to income gains by the bottom 90% by economist Emmanuel Saez. Amounts are inflation adjusted. Based on an analysis of IRS data, published in Forbes.
The share of US citizens in the workforce also rose during the period up to 1980, as an increasing percentage of women joined the workforce (Figure 11).

Figure 11. Employment as a percentage of the population, aged 25-54. Chart from FRED, using OECD amounts.
The thing that made the 1950-1970 period unusual was the growing availability of inexpensive fossil fuels. With fossil fuels, it was possible to add expressways where they had never been before. This allowed more interstate trade and improved the productivity of truck drivers. Labor saving devices allowed women to join the workforce. Farming continued to become more productive, with all of its labor saving equipment. Even as energy prices rose in the 1970 to 1980 period, citizens were able to continue to buy energy products because their wages were rising enough to keep up with inflation.
The growth in productivity was so great that wages plus government benefits (as measured by “Disposable Personal Income”) rose almost too fast. This added inflationary pressures to the economy. It is my opinion that these inflationary pressures contributed greatly to the oil price run-up in the 1973-1974 and the 1979-1981 periods.
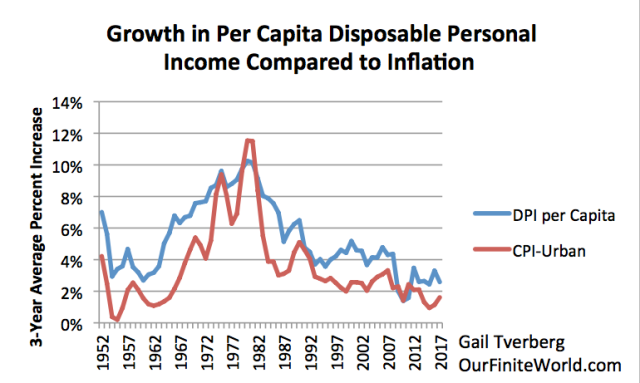
Figure 12. Three-year average growth in Disposable Personal Income compared to inflation as measured by CPI-Urban. DPI from US Bureau of Economic Analysis; CPI from Bureau of Labor Statistics. Per Capita Disposable Personal Income is calculated by dividing DPI by US population, also from the BEA.
The run-up in oil prices also to some extent reflected a scarcity problem; note the two spikes in CPI-Urban in the 1970s in Figure 12, which are higher than would be expected, if the problem were simply a problem caused by the very high per capita Disposable Personal Income growth.
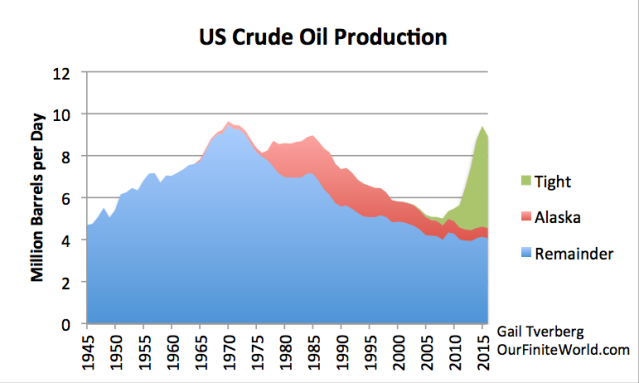
A major problem of the 1970s was a decline in US crude oil production for the area outside Alaska.
This scarcity problem was significantly mitigated by the development of oil fields in Alaska, Mexico, and the North Sea in the next few years.
One of the things that substantially helped fix the oil problems of the 1970s was the fact that the US, as well as other developed countries, was able to make changes that substantially reduced their oil consumption. These changes included:
- Moving to smaller, more fuel-efficient cars
- Finding fuel substitutes when oil was being used being burned to create electricity
- Changing oil-based home heating to approaches that used other fuels

Figure 14. Oil consumption by part of the world. Data from BP Statistical Report of World Energy 2017.
The combination of these approaches brought supply and demand more into balance. There was small dip in consumption in the 1973-1975 period, and a larger dip in the 1979 to 1984 period. In comparison, the Great Recession of 2008-2009 hardly made a dent.
An indirect impact of these changes was the fact that the US economy needed to become more integrated into the world market. The US started importing smaller, more fuel-efficient vehicles from Japan, since Japan was already making these cars. Japan started making other kinds of goods as well to sell to the US and other markets. The US and other countries built nuclear electric generation to replace some of the oil-fired electricity generation. These plants were capital intensive and required growing debt.
Especially after 1981, changes started to take place in the US economy, reflecting its changed role in the world. US companies grew in size, as they began to add overseas markets to their local markets. Wage disparity became more of an issue, as high tech operations required more specialized high-wage workers and fewer of those with only a general education. Increased competition for jobs with workers from lower-wage countries also tended to hold down wages of those without advanced training.
[6] The situation is very different now, compared to the 1970s. It is doubtful that today’s economy could tolerate a spike interest rates.
Today, we are not seeing rapid growth in per capita energy consumption, the way we were in the 1950 to 1980 period (Figure 9). In fact, world per capita energy consumption is almost flat (Figure 15), the way it was during the period of the Great Depression of the 1930s, and the way it was at the time of the collapse of the former Soviet Union in the 1990s (Figure 9).
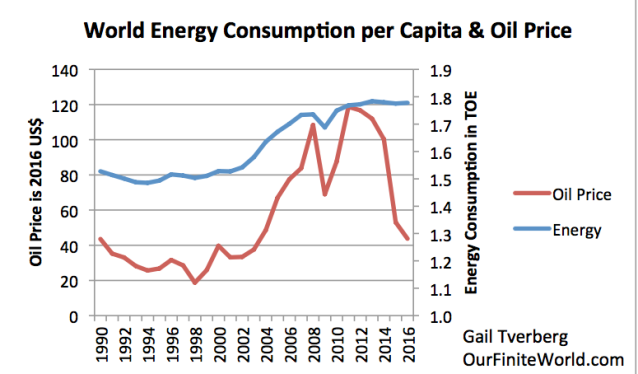
Figure 15. World energy per capita and world oil price in 2016 US$. Energy amounts from BP Statistical Review of World Energy, 2017. Population estimates from UN 2017 Population data and Medium Estimates.
There are other similarities to the 1930s period. Short-term interest rates are back to the low level they were in the 1930s (Figure 3). Growth in Disposable Personal Income per capita is persistently low (Figure 12). Wage disparity is at the high level experienced back in the 1930s (Figure 16).
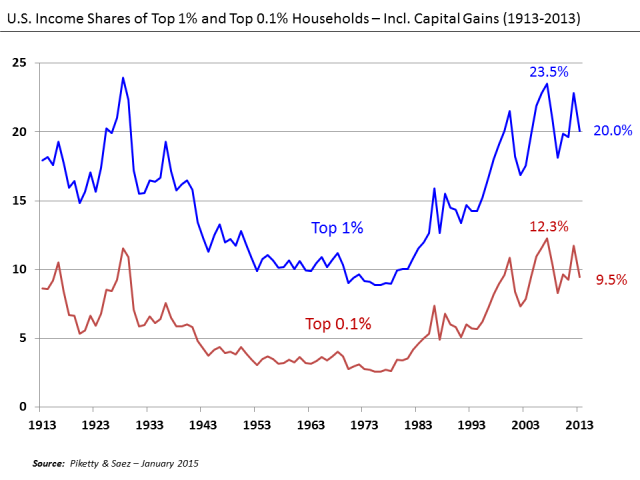
Figure 16. U. S. Income Shares of Top 1% and Top 0.1%, Wikipedia exhibit by Piketty and Saez.
It is probably because of this renewed wage disparity that we are having difficulty with oil gluts. Oil gluts were also experienced in the 1930s. People with inadequate wages cannot afford goods made with oil products. These gluts occur because of affordability problems–inadequate wages for part of the workforce.
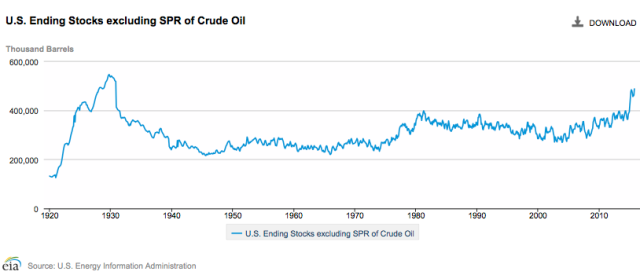
Figure 17. US ending stock of crude oil, excluding the strategic petroleum reserve. Figure produced by EIA. Figure by EIA.
Despite the spike in oil prices that central bankers are concerned about, oil prices are currently too low for producers. Oil exporting countries, such as Venezuela, Saudi Arabia, and Nigeria, depend on high oil prices so that they can collect high tax revenue. These countries are especially hurt by today’s low oil prices.
An increase in interest rates could very easily create a recession and drop oil prices even lower than they are today. Of course, that is precisely the intent of the central bankers. Our problem is that the economy cannot operate without energy products, particularly oil. The cost of producing oil is rising because of diminishing returns. It simply is not possible to drop its price as low as oil-importing countries would like it to be.
[7] Economists and central bankers think that they have good models of how the economy operates, but they really do not.
The economy is a self-organized system that is able to create goods and services using energy products. In fact, it cannot continue its existence, without continued very substantial energy consumption. The economy gradually builds itself up, with new businesses, new consumers, newly invented products, and with transportation and financial systems. I envision the economy as looking something like a child’s toy that is built from many pieces. If one or more pieces are removed, the system could collapse.

Figure 18. Dome constructed using Leonardo Sticks
The economy has been built based on the laws of physics. It requires sufficient energy. It is in many ways like a hurricane that loses power if it is forced to go over land for any distance. A hurricane gets extra strength if it is able to pass over very warm water, which provides the energy it needs. Right now, the world economy is showing signs that it does not have sufficient energy; the standard of living of young people around the world is falling. The return on energy investment is far too low.
While it may be true that the US economy looks like it is at full employment, based on the number of people looking for jobs, the percentage of people aged 25-54 with jobs tells a different story (Figure 11). This percentage has fallen since 2000, at least partly because of globalization.
Unfortunately, the approach that economists are taking to model the economy cannot provide a good representation of how the economy really works. A self-organized system has many feedback loops that are difficult to understand and model. One change leads to other changes that are hard to see in advance. The problem with current models is that they are likely to produce misleading indications.
[8] Conclusion
We have heard the saying, “That which does not kill you makes you stronger.” The theory behind raising interest rates seems to follow a similar line of reasoning. If central bankers can raise interest rates, economies will be stronger.
The catch is that we are too close to the “edge” to be testing an increase in interest rates. Economies, below a certain “stall speed,” cannot repay debt with interest, and cannot hope to provide entrepreneurs with an adequate return on investment. Our low rate of growth is already close to this stall speed.
Given where we are today, it would be quite possible to accidentally “kill” the economy with rising interest rates. This would be especially the case if short-term and longer-term interest rates rise at the same time. A budget with large deficits could cause longer-term interest rates to rise. So could selling large amounts of QE debt.
Also, feedbacks don’t come quickly enough to make necessary course corrections. This makes raising interest rates way too much like playing with physics reactions we don’t fully understand. Interest rate increases (like fission reactions) start chain reactions. In an open environment such as the world economy, we have limited understanding of the outcome of these chain reactions.
via Zero Hedge http://ift.tt/2FhHrl3 Tyler Durden
