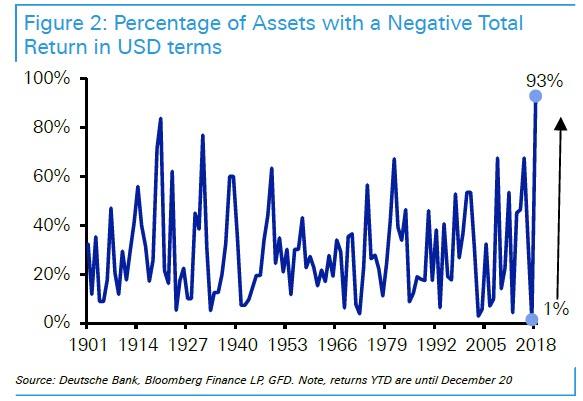
Late last year, Deutsche Bank published what may have been the iconic chart that captured the prevailing investing zeitgeist: it showed that 2018 was the worst year on record on terms of the percentage of global assets down on a dollar adjusted basis – with roughly 93% of all assets down for the year, worse even than the years of the Great Depression. Indeed, 2018 was the year when “nothing worked.”
But while December may have been the worst month since the Great Depression, Powell’s full dovish capitulation and loss of all credibility in January, resulted in a violent reversal for the S&P in January, which in turned was the best start to the year since 1987 (a year which is far better remember for another market event).
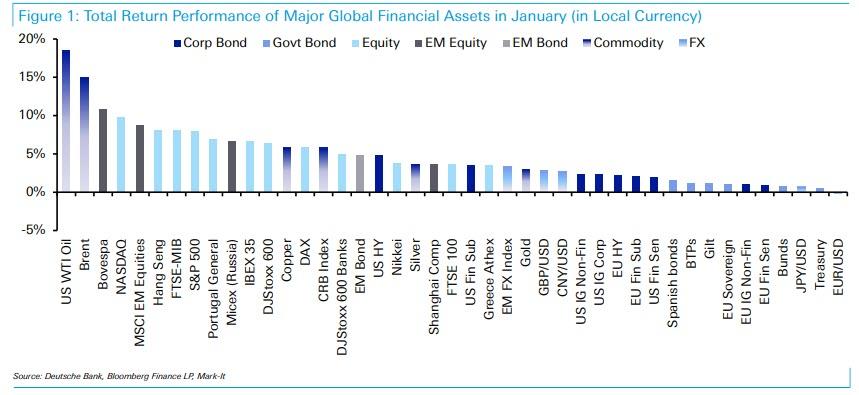
It also means that one can take the above chart and apply a mirror image to it to explain what has happened so far in 2019: as Deutsche Bank writes today, based on its usual sample of assets used for performance review, there has never been another month in which all 38 assets delivered a positive total return in local currency terms. In fact the next best was 36 assets
which happened in January 2012, September 2009, July 2009 and October 2007.
Amusingly, as Deutsche Bank strategist Craig Nicol writes, “as one would expect, it’s rare to have a month where risk assets and rates rally.” Actually, no: since this is what is known as the “QE trade”, when a dovish shock from the Fed leads to a surge in all assets coupled with a plunge in the dollar – precisely what we observed in January – it is not that rare to have a month like this in the new normal, when central bank intervention has been the primary source of equity upside in global markets. In fact, for an entire generation of traders, one could say that it is far more rare to see a month like December when the S&P dipped into a bear market for the first time in a decade… if only for a few seconds.
In any case, as Deutsche Bank adds, January “is the best broad-based month for performance in markets since we started collecting data nearly 12 years ago. For context, the average number of assets with a positive total return in any given month since the start of 2007 is 22.”
Deutsche Bank was not the only bank left scratching its head: following up to his note from Tuesday, SocGen’s Andrew Lapthorne writes that January is often a time for reversals and risk taking, and January 2019, helped by the Fed and coming off a very weak December, was no exception. But, as the SocGen strategist writes, and many others would agree with him, “the extent of the bounce back has taken many by surprise.”
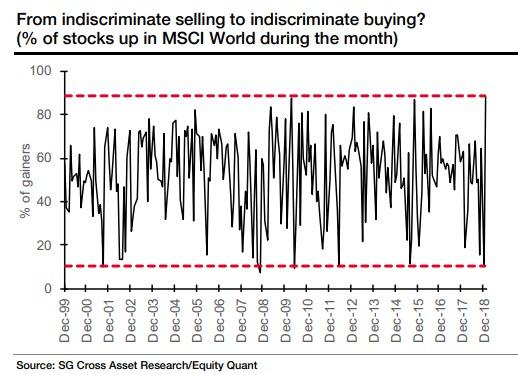
As Lapthorne show in the chart below – which is effectively the mirror image of the Deutsche Bank chart – while December 2018 saw 90% of MSCI World stocks fall, January 2019 has seen 88% of stocks go up, a 20-year record, or as SocGen calls it “from indiscriminate selling to indiscriminate buying.”
“What does all this mean”, Lapthorne asks rhetorically, and answer: “Well, from a prediction point of view, very little. A lack of discrimination in stock movements or strong price reversals over one month does not imply anything for the following month.” But while Lapthorne is right that one can’t derive any conclusions from the violent market reversal last month, what one can say that it is symptomatic of a confused market, “with the kind of performance we saw in price reversals last month in the US (+7.1%) only ever seen during periods of macro turmoil.“
Meanwhile, this being Lapthorne, the conclusion was hardly cheerful:
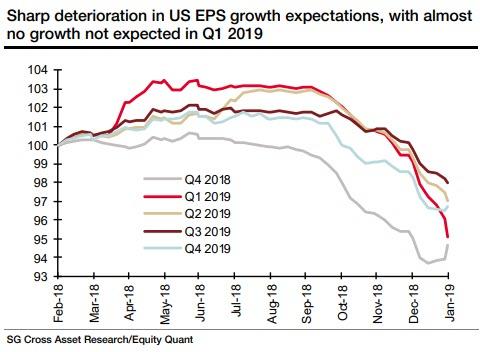
For all the exciting price action, the fact remains that US EPS estimates have slumped, with an 8% cut in 1Q19 S&P 500 EPS estimates over the last three months. There is almost no growth expected now in 1Q. Downgrades have been less harsh in Europe, with 2018 EPS estimate just 3% of their peak and 2019 4% off. However, Europe is less expert at pre-positioning estimates, so unlike the US which typically see an uplift in EPS during the reporting season, Europe has plenty of room for downgrades.
And visually:
via ZeroHedge News http://bit.ly/2Trk6ns Tyler Durden


