Authored by Hal Snarr via The Mises Institute,
The State of Oregon is on the precipice of “solving” its housing shortage with state-wide rent control . It would be the first state to do so. The policy is being sold as a way to make housing more affordable in a state where three of its cities, Eugene, Portland, and Salem, are ranked among the forty most expensive housing markets on the planet.
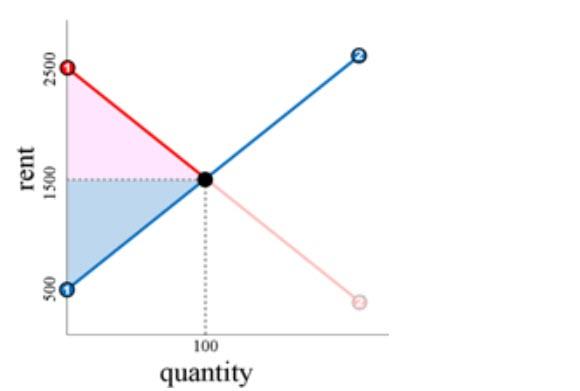
To understand how Oregon’s housing solution will harm those it hopes to help, consider the rental market modeled below. The State is not interfering in the voluntary transactions between landlords and tenants. Supply and demand efficiently allocate 100 rental units at $1500 per month.
The red line represents the demand for rentals. The height of point 1 gives the rent the richest renter is willing to pay ($2500). The height of point 2 gives the rent the poorest renter is willing to pay (under $500). The height of the equilibrium (black point) gives the rent a person of average income is willing to pay ($1500).
The blue line represents the supply of rentals. Since some landlords have mortgages and some do not, some units are in large complexes and some are single units, and some complexes have lots of amenities and some have few, this line represents a queue that sorts rentals from least to most expensive to finance and maintain. The rental at point 1 costs its landlord $500 to maintain and finance, while the unit at point 2 costs its landlord over $2500 to finance and maintain.
Regarding the first rental, its landlord and tenant both benefit from the transaction. The tenant thinks he got the better end of the deal because he is willing to pay $2500 but only pays $1500. The landlord thinks she got the better end of the deal because she is was willing to accept $500 but gets paid $1500. Both sign the lease because both parties are winners in trade.
All 100 rented units represent win-win transactions. The tenants were willing to pay rents in decreasing order from $2500 to $1500 but each only pays $1500 per month. Relative to the landlords, they all feel like they got the better end of these deals. The pink triangle measures this great feeling. On the other hand, landlords collect $1500 from each tenant but were willing to accept rents in increasing order from $500 to $1500. Relative to their tenants, they feel like they got the better end of these deals. The blue triangle measures this great feeling. Thus, all parties in these trades are winners.
Some renters have been priced out of the market. They populate the faded section of demand. During high school, I was one of them. I wanted to fly the coop but could not afford to do so. Others included in this group are perhaps older workers with low job skills or singles just out of college and looking for first jobs. These folks, if subletting is illegal, find apartments in nearby low-rent markets. Their exit from this market is why the lower section of demand is faded.
Housing laws can adversely impact rents and apartments. An Oregon zoning law shrinks the areas where apartment complexes can be constructed. This decreases supply, raises rents, and reduces the number of available units. NYC restricts subletting. That reduces supply and raises rents. Since renters would have had a room in the absence of subletting restrictions, the restrictions result in higher demand as more people search for rooms. That pushes rents up too. In the absence of all restrictions, markets will find creative ways to solve housing shortages. For example, prior to zoning laws, early Americans turned their homes into boarding houses or residential hotels, which are not unlike the no-frills rooms listed on Airbnb.
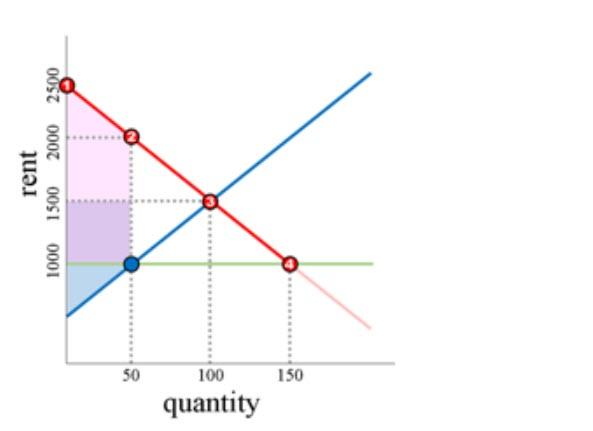
When rents get too high, rent control becomes popular among politicians who are either wanting to do the right thing or are shopping for votes. The figure below shows what happens when government sets rental rates (the green line). At the imposed rent, the people who populate the demand line between points 3 and 4 reenter this market to look for apartments. This is why that section of demand is no longer faded. Since the financing and maintenance expenses of the rental units on supply between the blue point and point 3 exceeds the legislated rent, the landlords take these units off the market (e.g., they get listed on Airbnb instead). Thus, the rent ceiling reduces the number of units to 50 but increases the number of people in the market to 150. If subletting is illegal, unsuccessful apartment seekers live in cars or on streets as they wait for tenants to vacate.
Recall that demand represents a queue with the richest renter on the left and the poorest on the right. With the rich owning homes, the upper middle class populates the line between points 1 and 2, the lower middle class populates the line between 2 and 3, and the poor populates the line between 3 and 4. Since the upper middle class are willing and able to pay more than the lower middle and poor classes, they have the most impressive applications or can afford the largest bribes. Thus, the renters with the 50 highest incomes get the 50 apartments that are offered in the market. Those in the lower middle class, who had apartments prior to rent control, are now without homes. The poor were not homeless prior to rent control, as they had low-rent units in nearby neighborhoods. But now they are homeless.
Though rent control is sold as a policy that is intended to help the poor, it induced homelessness among the poor and lower middle classes. It also increased the spoils of trade accruing to renters with the highest incomes. Their spoils increased from what it was prior to rent control (the light pink area) to what is after rent control (the light and dark pink areas).
The consequences of rent control are well understood by economists, from one end of the political spectrum to the other. Given this rare consensus in economics, it is surprising that states like Oregon are on the verge of voluntarily wrecking their housing markets.
via ZeroHedge News https://ift.tt/2TzpsBf Tyler Durden


