Following the violent plunge in yields earlier this week and especially on Tuesday night into Wednesday morning, Nomura’s Charlie McElligott summarized the recent rates action as “Scary Hours” in a bond market rocked by “Crazy, Panicky” moves. This full-blown capitulation by bond shorts, prompted by market expectations of not one but two rate cuts in the coming year, caught many by surprise and resulted in massive losses for any last traces of the “reflation” trade.
Looking at today’s market action, this “breakdown in rates and equities” appears to have fizzled for now, and we are finally seeing some tactical selling in the front-end “downside” – especially after yesterday’s widely discussed $40 million “EDZ9 put condor trade” leading McElligott to suggest that the front-end move has finally “overshot,” in conjunction with reversals in swap spreads, as the forced convexity hedgers look to be adjusted for now, potentially moderating the key driver of the multi-day panicky Rates move.
But the damage has already been done.
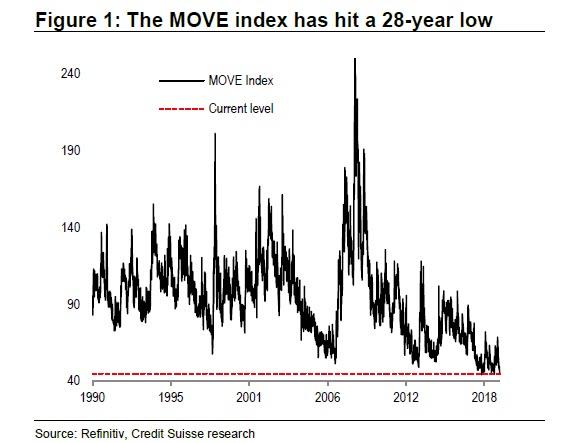
Recall that one month ago we reported that the MOVE index, which tracks 1 month bond volatility, just hit an all time low, and advised traders to “enjoy the record low treasury vol while you can (and can buy it cheap) – it won’t last. And if and when MOVE moves higher (potentially in a rather explosive fashion), expect the spillover from any sharp repricing of volatility at this fulcrum asset class to hit all other assets promptly.“
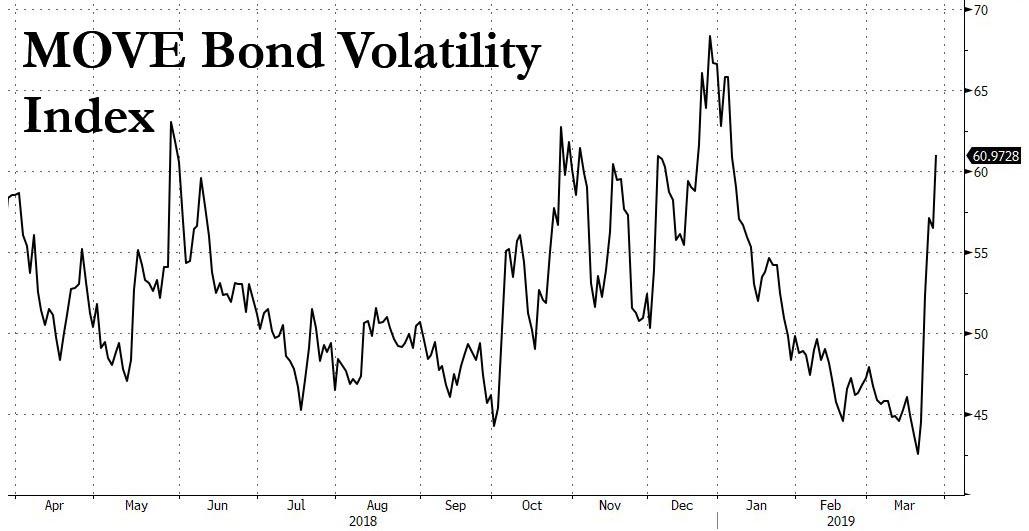
One month later, that’s precisely what happened, because even as today’s reversal in rates may provide some modest relief for Systematic rate vol carry strategies where many have lost the entirety of the year’s gains over the past two weeks after suffering yet-another 3 sigma z-score drawdown yesterday as bond volatility indeed exploded, as we warned it would in late February.
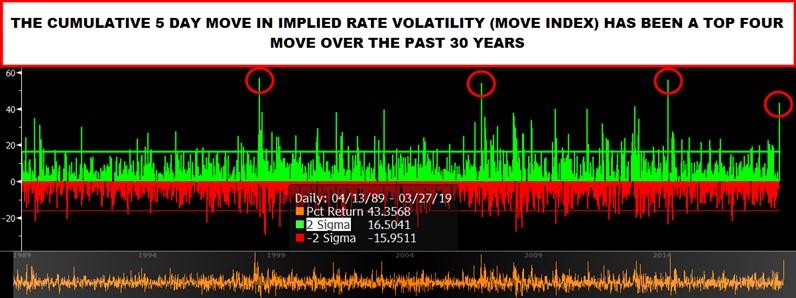
In fact, according to McElligott, the “Merrill’s MOVE index has seen its fourth-largest cumulative 5-d move of the past 30 years” a five sigma event.
It wasn’t just bond traders that got carted out in the last few days.
As McElligott writes in his daily note, yesterday was also the fourth-worst day for his model hedge fund long/short book year-to-date, “as chronically hated Value- screamed higher and Quality- again outperformed on the session, while crowded “Growth-y” Cash / Assets-, Sales Growth- and R&D / EV- factors were all hit meaningfully lower.”
As a result, the past three sessions appear to have seen a modest “gross-down” flow going-through as the dreaded “Shorts outperforming your Longs” dynamic drags on performance as hedge funds once again were violently reversed on the most popular, consensus positions:
- “Most Shorted” (+1.4% cumulative 3d move), “High Short Interest” (+1.3%), “2018 Worst Performers” (+1.0%), “1Y Momentum Shorts” (+0.7%), “Most Shorted Large Caps” +0.7%”
- “Momentum Longs” (-0.8% in 3d), “Hedge Fund Longs” (-0.8%), “2018 Best Performers” (-0.7%), “1Y Momentum Longs” (-0.6%), “HF Top 50” (-0.4%) and “HF Overweights” (-0.2%)
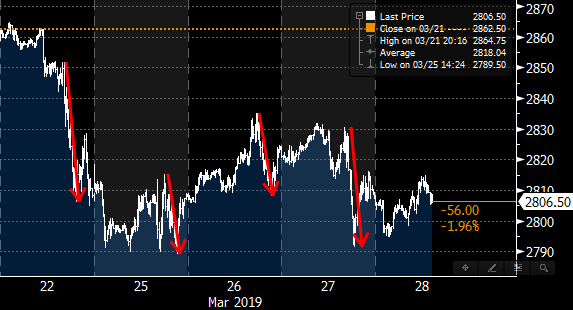
There is another potential catalyst for the intraday swoons observed this week: as the Nomura strategist notes, we have seen recurring mini S&P reversals late in the EU session, suggesting rebalance-looking flows out of Europe, which have “clearly been a large part of the stock pressure.”
Also worth noting is that at the same time during the day, 10Y yields have rallied…
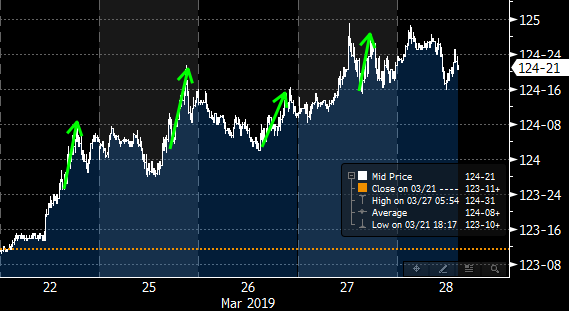
… suggesting this may be part of the notorious quarter-end pension fund rebalancing trade.
The threat of continued pension-rebalancing into month end aside, there have been several other technical reasons for the recurring equity weakness in recent days, as laid out by Elligott:
- The recent downtrade in S&P has seen us near the S&P Systematic Trend “sell / deleveraging trigger” levels..but still yet to trade through / close below it
- Our “forward dropoff” analysis for the CTA Trend SPX model shows that we have approximately 5 days left (first 5d ‘red block’ in forward signal table below) of the “mechanical” pulling-HIGHER of the “SELL TRIGGER” closer to “spot,” before then again reverting “out of the danger zone” and heading LOWER for the following THREE sessions thereafter (meaning “sell trigger” drops further below “spot” again—see days 6,7 and 8 below)
- Importantly however as a forward “U.S. EQUITIES PULLBACK WINDOW” catalyst, we will again see the “sell triggers” again moving mechanically higher out nine days from here—and WAY HIGHER OUT THREE WEEKS (second red block highlight, starting at the 9d count on top):

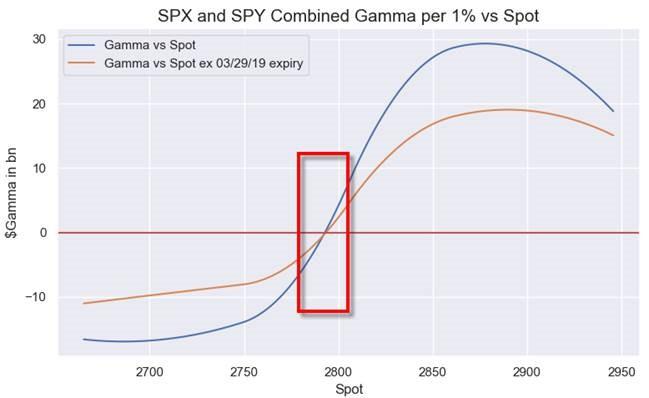
Yet having previously warned about the “pullback window”, McElligott now specifies the timing of the event, noting that “it has to happen now”, as he currently sestimate SPX/SPY consolidated Dealer Gamma to turn “negative” in approximately the same area ~2790 area the bank’s CTA pivot leve… “so this next five days is the “PEAK WINDOW” for this “alignment” of Dealer Gamma, Rebalancing flows and CTA sell triggers.“
That said, something does not add up: why after such a violent “volatility quake” in bonds have stocks remained oddly resilient (with the exception of last Friday’s violent plunge)? According to McElligott, two reasons explain why equities continue to “hold”:
- “Spot” S&P still remains meaningfully above CTA sell-triggers (SPX and even moreso NDX remain comfortably “Max Long,” although position sizes / $ exposure is just a fraction of last year’s Jan18 / Sep18 peaks)
- Dealer “long Gamma” remains at current levels and “holds” us, only turning “negative” (per our latest inputs) approx 20 handles lower in SPX ~ 2790
Which means that if stocks can resist a late March dump, it may be smooth sailing, as looking ahead into April, three drivers emerge:
- “Seasonals” out the first two weeks of April shows a very growth-y “Cyclicals over Defensives” trend since 1994
- The “Rebalance Analog” shows very POSITIVE out-trade as a “post April 1” SPX upside catalyst—especially looking-out the 5-6 days after (see table below):
- Finally, Mid-April will earnings “kickoff,” which sees PMs “tune out macro noise” and also means that corporates will thereafter begin to emerge from the “blackout”—particular Banks which have certainly been a negative optic of the past few weeks in light of the rates move
Putting all this together, and looking at the near future, McElligott predicts that the marginal pressure for US equities is likely to tilt positive for the S&P500 as we push into April for the following reasons:
- Yes, Systematic Trend “sell triggers” in SPX again move mechanically / dangerously higher looking-out nine days (and WAY HIGHER 3 weeks out)—but in meantime, Spot remains well above said pivot levels
- Spot also remains above dealer Gamma pivot (comfortably in “long gamma” zone currently)
- “EPS commencement” in mid-April when Equities PMs “tune out macro noise”
- Emergence from the “Buyback Blackout” at same time (for Banks especially)
- “Extreme Pension Rebalancing” analog turns positive the 1w after the “turn”
- Powerful seasonal since ’94 with USEQ “Cyclicals over Defensives” over the first two weeks of April.
Until then, however, watch out for even more bond market volatility and additional multi-sigma events in the MOVE index, which if extended to far, threaten to completely destabilize the market’s benign transition from the late-March “pullback window” into the April “rebound window.”
via ZeroHedge News https://ift.tt/2HWV9NK Tyler Durden