When the yield curve inverted last week, an event which officially started the countdown to the next recession, few felt as vindicated (and perhaps content) as SocGen’s Albert Edwards who has been calling for the next phase of the “Ice Age” (defined by him all the way back in 1996) for years. Predictably, in a note published today, he took a moment or too to gloat over recent developments, writing that “ten years since the start of the QE experiment, the Fed has failed in its objective to drive up CPI inflation, merely inflating asset prices instead. The next phase of the Ice Age is unfolding as US (and eurozone) CPI inflation rapidly falls towards zero, and central bank liquidity continues to rotate out of risk assets into the last game in town – government bonds.”
Yet even in quasi-victory, the bearish Edwards is eager to pour just a little more gasoline on the bonfire of the raging market panic (as recapped earlier by his Rabobank colleague, Michael Every), and cautions that “the barely inverted curve may underestimate the imminent danger.”
Which brings us to an interesting tangent: is Edwards a perma-bear… or just an uber-bear as he describes himself in the following section:
I am frequently referred to in the press as a perma-bear – a label often used to suggest that my views can be safely ignored as any argument I use is merely constructed to support my ‘permanent’ bearishness on equities. Personally, I prefer the title über-bear. I certainly have no intention of being permanently bearish, but to be sure, being strategically underweight equities since the end of 1996 may certainly strike some as “permanent”.
To be sure, expecting a market crash for 23 years may indeed strike some as permanent, but do not fret: as regular readers will know, Edwards’ bearishness on equities sits within the context of his Ice Age thesis, where what’s bad for stocks is good for bonds and vice versa:
I have long used the Japanese experience from 1990 onwards as my template, having watched each successive economic cycle in Japan grind out lower highs and lower lows for inflation and nominal GDP growth until they slid into a sub-zero deflationary hell.
When I first framed my Ice Age thesis back in 1996, I envisaged the US and Europe experiencing a Japanese-style secular de-rating of equities, both in absolute terms and, more importantly, relative to government bonds. Meanwhile, bonds would also re-rerate in absolute terms. So with the next recession expected to begin as soon as late 2019 or early 2020, how long does Edwards see the next economic crisis lasting? “I believe this Ice Age process will end with US 10y close to minus 1%.“
Which, which potentially bad news for stocks, is of course great news for bonds, as he explains in the next section:
My consistent über-bullishness on western government bond markets never seems to attract as much attention as my extreme bearishness on equities. Yet the thesis supporting both is the same. Take a look at the performance of 10y+ world government bonds since the inception of the Ice Age (i.e., from end-1996). A balanced fund following my strategic advice to buy and hold bonds over equities would have only marginally underperformed even at the end the fantastic bull run in equity markets over the last ten years. The contrast in volatility is also striking as is clearly shown in the chart below.

Here, Edwards like so many other commentators, takes the opportunity to remind readers of his own take on why the inverted yield curve has been “so successful in predicting recessions”, and explains as follows:
As far as this author is concerned there is no sophisticated economic or financial market theory that explains the predictive reliability of a yield curve. Being the simple, unsophisticated soul that I am, all I believe the inversion of the yield curve tells us is that the Fed has raised interest rates considerably. This often coincides with inversion, especially when the bond market starts to detect the sickly aroma of an economy slipping away into a recession.
But, somewhat oddly, Edwards is less of an absolutist when it comes to curve inversion, and writes that in his view, “inversion is neither a necessary nor sufficient signal that a recession is imminent.”
This is where SocGen’s analysis on the ‘shadow’ Fed Funds falling to minus 3% back in 2016 at the height of QE, and which we first presented last June, is so important. What it means, Edwards explains, is that, as far as the impact on the economy and markets are concerned, the increase in Fed Funds interest rate has not been from 0.25% to 2.5% currently but from minus 3.0% to 2.5%, i.e., a much more punchy 5.5 percentage point increase, as shown in the chart below – “the green line depicts the end of QE and start of QT. So considerably more aggressive tightening of interest rates than meets the naked eye and a shift that historically is more than enough to tip the economy into recession.”
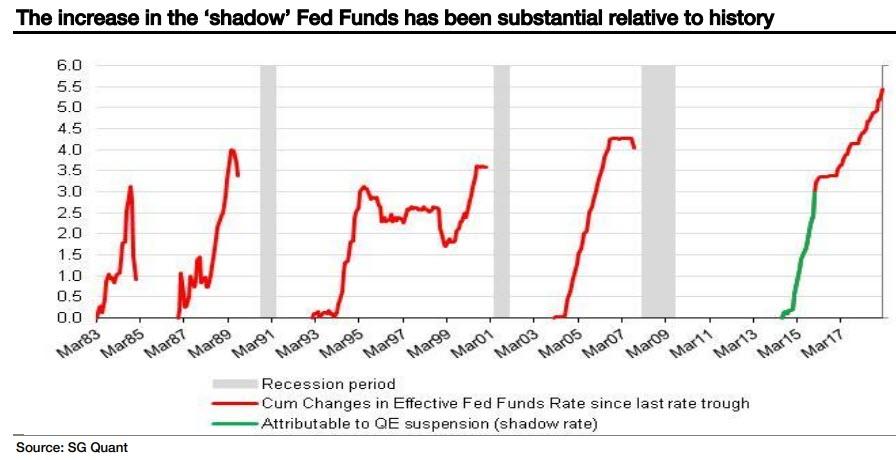
Following this surge in the shadow rate, which also takes into consideration the Fed’s balance sheet and the (lack of) QE, with the US economy and equity markets beginning to suffer from a severe dose of indigestion in the wake of this 5½ percentage point hike in rates, no wonder the bond market rallied so hard: “It would probably have done so in a few months in any case, even without the Fed’s panic U-turn on interest rate guidance”, Edwards notes.
Meanwhile, looking at that other all-important metric – inflation – Edwards sees a sharp reversal on the horizon, because the current CPI basket is heavily skewed toward shelter inflation. Well, with the US housing market having entered a sharp downward trajectory recently, Edwards believes it is only a matter of time before a deflationary flood is unleashed:
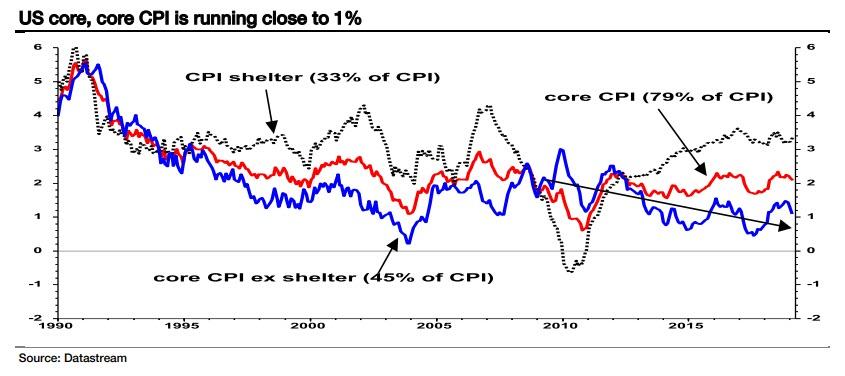
The current 2.1% core CPI inflation rate (red line in chart below) is massively inflated by the dominant ‘shelter’ component, which is running at 3.4% yoy (see dotted line below). We have written about this before and do not intend to go into deep detail here apart from noting that, excluding shelter, ‘core core’ CPI inflation is only running at 1.1% and, unless I am mistaken may even be trending down (see blue line below).
Shelter comprises 33% of CPI and some 42% of core CPI and so dominates the latter in particular. It comprises two components: rental of primary residence (8% of CPI), but also an item termed Owner Equivalent Rent (OER, 24% of CPI). The OER series is a mind-bending concept designed to measure the rent a homeowner forgoes if they do not rent out their own home! It was included to replace house prices ejected from CPI in the early 1980s. This strange OER series is ‘imputed’ (made up?), but tends to follow actual rents quite closely (see chart below). From this view, a drop in OER inflation is already slightly overdue.

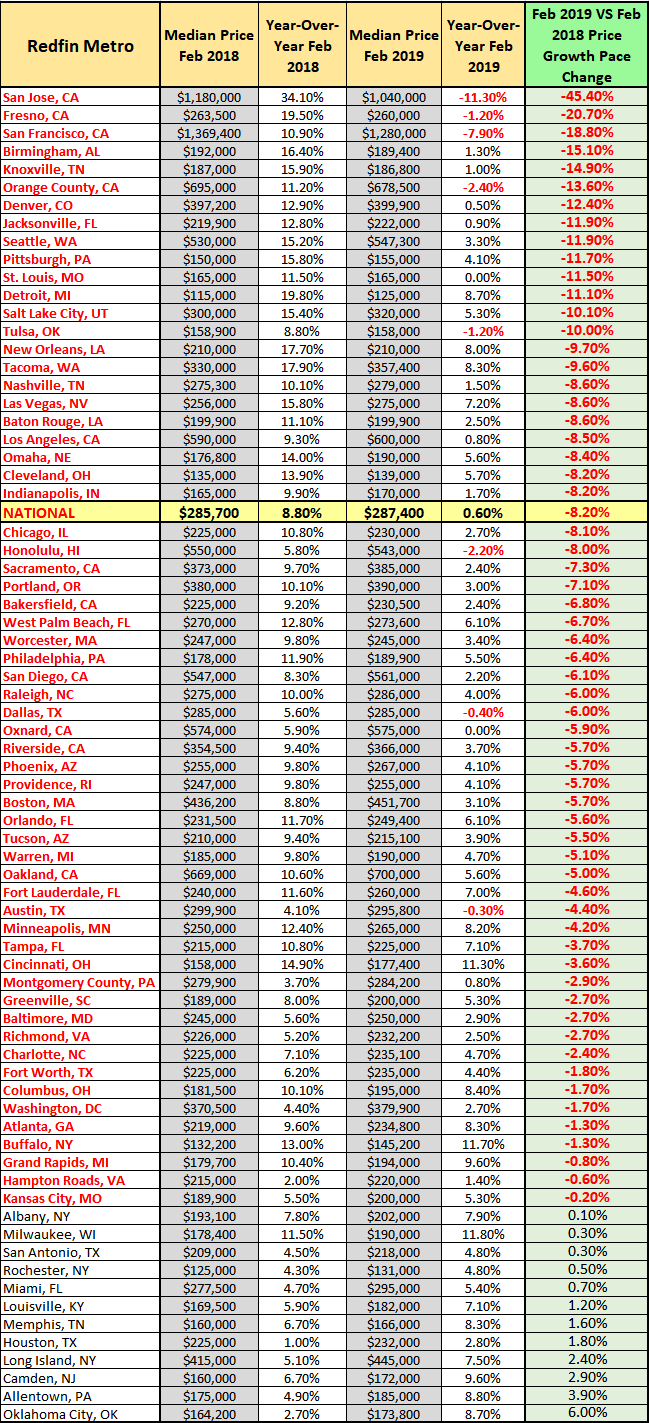
As a reminder, one week we showed that while few discuss it, growth in the US housing market has already hit a brick wall and is in fact reversing in most metros, as such it is only a matter of time before this shock reverberates across all CPI price signals.
“And therein lies the rub”, according to Edwards, who predicts that with the US housing market clearly softening rapidly, “there is good evidence that rent inflation in the US is set to plunge and take the dominant shelter component of core CPI inflation substantially lower.”
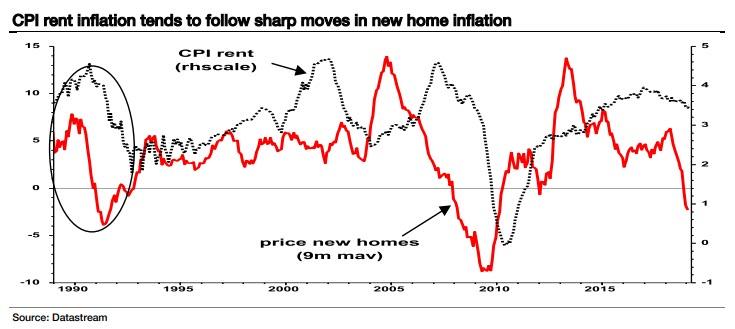
As a case study, the SocGen strategist reminds us that back in the early 1990s, a similar decline in new home inflation saw CPI rent inflation slide from above 4% to 2% (as circled below). “A similar outcome now would see core CPI move closer to 1% than the current 2%. In the market’s current mood that would be like throwing gasoline onto a government bond market that is already on fire.“
Edwards ends his latest preview of the coming deflationary apocalypse with a quote by his just as notorious deflationist peer, Russell Napier…
“What a three weeks it has been, particularly in bond markets where, ten years after the launch of QE, the prospect of deflation is priced as a clear and present danger! The good news is that we know what is coming next. The bad news is that we know what is coming next. The current war on deflation, a war lost if the shift in bond yields is to be believed, is bringing forth from the authorities not a new tactic but a whole new strategy – financial repression. So, is the financial repression, now renamed modern monetary theory/makeup strategy (ie allowing inflation above the 2% target to compensate being below for so long)/nominal GDP targeting, imminent as bond yields in New Zealand and Australia reach all-time lows and the tenyear bond yields of both Japan and Germany return to zero?”
… who argues that should the bond investors’ view on deflation be confirmed, it paves the way not for more QE, as the inequality that QE has caused has lost the Fed (and the ECB and BoE) the support of the public and politicians alike. Rather, new policies will be tried, and the trial balloons described above have already been floated by the Fed in recent speeches, ready for use in the next recession. And after 5½pp of Fed tightening, that time could even be now.
This then brings us to Edwards’ conclusion and his brief, but violent forecast of what will happen next:
The recent explosive rally in bond markets and inversion of the US yield curve signals that the next phase of the Ice Age may be arriving. Prepare for huge market moves.
Well, he didn’t call himself an uber-bear for nothing…
via ZeroHedge News https://ift.tt/2Woxc5Q Tyler Durden