For stocks, April was certainly not the cruelest month, as the risk-on rally continued with the S&P 500 posting 4.0% total returns following the strong 13.6% rally in 1Q. The month ended with a mini meltup, as the S&P set record highs four times in April on a closing basis, three of them in the last three trading days of the month. Overall, the S&P 500 is up 18.2% YTD, 26% since the December low, and sits 2% above its prior high in September 2018.
As BofA notes, the April rally was led by mega-cap stocks – the largest 50 stocks outperformed the overall market by 50bps, while the equal-weight S&P 500 index lagged by 30bps. Global equities also posted strong gains (but lagged the S&P), rising 3.7% in local currency terms and 3.4% in USD, with all MSCI regions gaining. US stocks outperformed other asset classes including bonds (LT Treasuries -1.7% / IG corp. +0.6%) and cash (+0.2%). The VIX index fell 4% (down 48% YTD), while gold slipped for the second straight month (-1.0% in April).
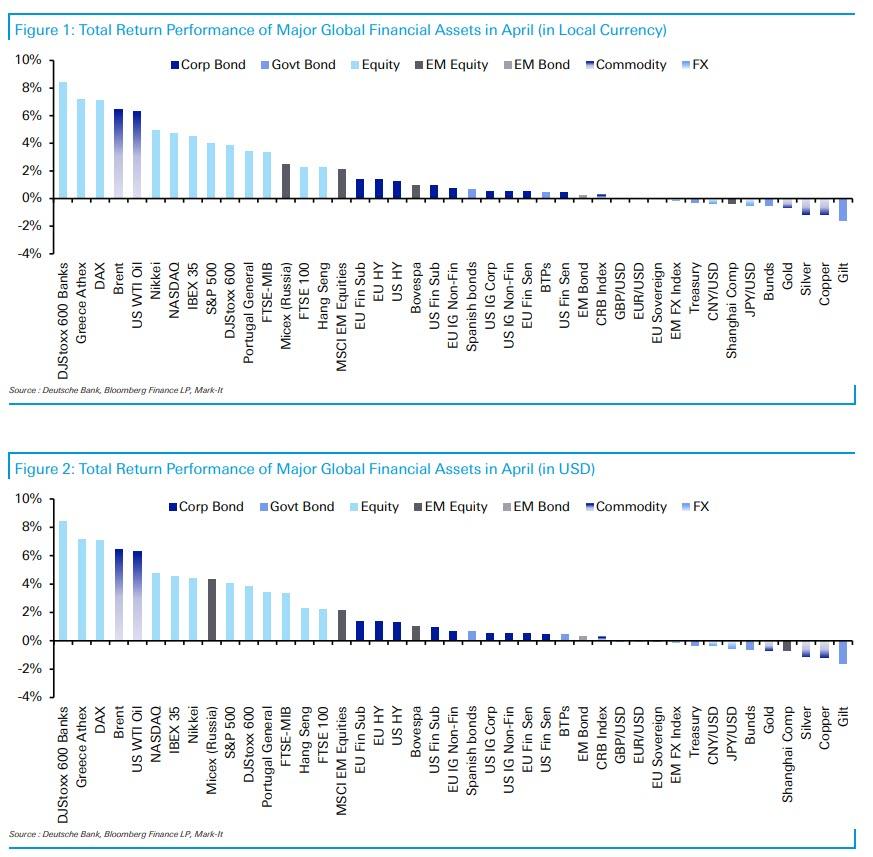
It wasn’t just the US, however, and as Deutsche Bank writes, there were strong returns across the board for most equity markets globally as shown below. Central banks falling into a dovish line one-by-one, data continuing to favor this goldilocks environment, earnings season so far being taken positively, trade headlines by and large incrementally more positive and a continued lack of volatility all contributed to the favorable backdrop for risk assets, according to the bank’s Craig Nicol.
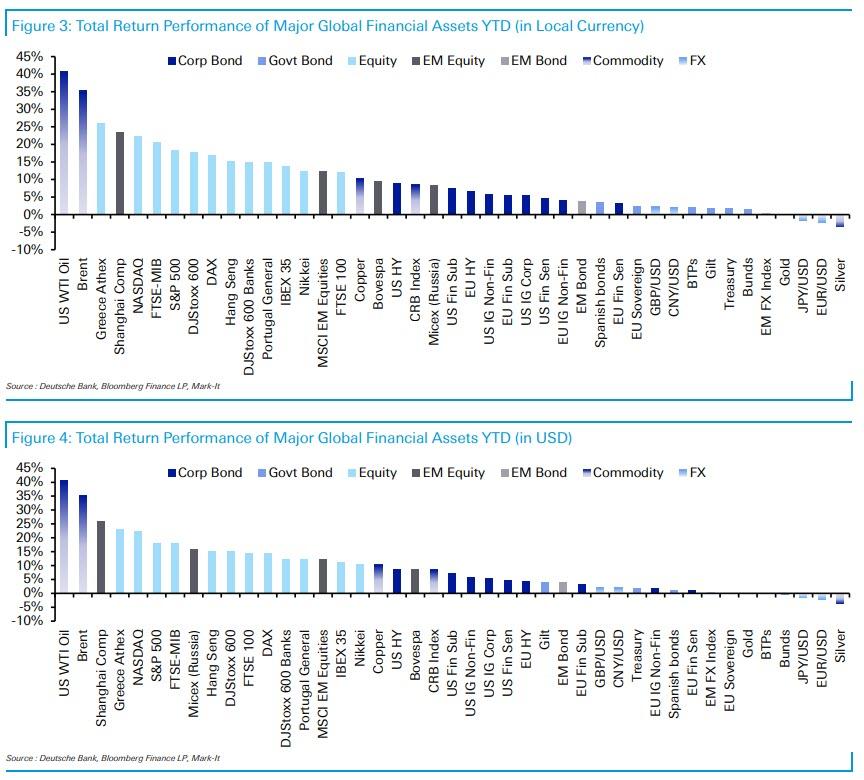
And while returns weren’t quite so spectacular for rates and commodities, which lagged the broader rally, however, by the end of the month, 30 of the 38 assets in Deutsche Bank’s sample still finished with a positive total return in local currency terms and also dollar-adjusted terms. This means that YTD, we’re now at 37 out of 38 assets up in local currency terms and 35 in dollar terms. In local currency terms, this is now the strongest start to a year through the first four months since 2007.
Digging into the April moves, DB notes that the top spot in its leaderboard goes to European Banks, which returned +8.4% in local currency terms. A combination of a slight rise in bond yields, earnings, improving data and a general lag versus wider equity markets in the first quarter all appeared to play a role. That compares to a return of +3.9% for the broader STOXX 600 while the NASDAQ and S&P 500 finished with returns of +4.8% and +4.0%, respectively, and as we noted above, new record highs. EM equities lagged the rally, albeit still returning a solid +2.1%. In Asia, the Nikkei returned +5.0% and Hang Seng +2.3%. The Shanghai Comp was the big underperformer, falling -0.4%.
Credit markets, and particularly higher beta credit, had a solid month also, particularly when considering negative total returns for Treasuries (-0.3%) and Bunds (-0.6%). EUR HY and USD HY returned +1.4% and +1.3%, respectively, while EUR Fin-Subs and USD Fin-Subs finished with returns of +1.4% and +1.0%, respectively. EUR and USD IG Corps by contrast returned +0.7% and +0.5%, respectively. Coming back to rates, it’s worth noting that Gilts (-1.6%) struggled last month as the focus turned to stronger UK data, however, non-core markets were stronger, particularly BTPs (+0.5%) and Spanish Bonds (+0.7%). EM Bonds (+0.3%) were slightly positive, albeit masking underlying idiosyncratic stories for a number of countries.
Finally, there was a bit of split in commodities with Brent (+6.3%) and WTI (+6.4%) oil two of the strongest assets last month, however, Gold (-0.7%), Silver (-1.1%) and Copper (-1.2%) all fell.
As for the YTD picture, as alluded to above, only 1 asset has the misfortune of being down this year in our sample and that goes to Silver (-3.5%). WTI oil (+40.7%) continues to hold the top spot, followed closely by the majority of equity markets, which are led by the Greek Athex (+26.1%). The NASDAQ has now returned +22.4%, S&P 500 +18.2% and STOXX 600 +17.7%. The big rally for European Banks last month means they are now up +15.0% this year. Meanwhile, USD credit is up +4.6% to +8.9% and EUR credit +3.3% to +6.6% with HY outperforming IG. Bond markets are still delivering a positive return in local currency terms, with Treasuries up +1.8% and Bunds +1.5%, however, the latter does deliver a negative return in dollar-adjusted terms as a result of the euro move this year.
Going back to the US and looking at sector performance, financials gained most in April, up 8.8%, true to its historical trend of consistent outperformance following yield curve inversions. Strong 1Q earnings (71% have beaten on EPS through April) and a steepening yield curve helped. Tech and Communication Services were also up over 6% each, bolstered by breadth of earnings beats (80% beat on EPS in both sectors). Health Care was the notable laggard in April, down 2.7%, likely hurt by extended positioning ahead of political campaigning. YTD, Health Care is the worst performing sector in the S&P, up just 3.2% vs. +17.5% for the S&P 500. Real Estate also fell in April, down 0.6%.
Finally, looking at returns by size, in keeping with quality returns, the Russell 2000 (+3.4%) slightly lagged the Russell Midcap (+3.8%) and the Russell 1000 (+4.0%) in April. Within small and mid caps, Financials, Tech, and Industrials led, whereas Health Care and Energy lagged. Value stocks outperformed expensive/growth stocks in both small and mid caps. Midcaps (+21.0%) are the best-performing sector so far this year, while large caps (+18.6%) are neck and neck with small caps (18.5%).
via ZeroHedge News http://bit.ly/2vBtZEB Tyler Durden