Just how much power do central banks have to manipulate and direct what by now should be clear to anyone is the world’s most centrally planned “market” in history? Here is a number from Bank of America’s Chief Investment Officer demonstrating just that: 215.
As BofA writes this morning, “once upon a time (between 7th Sept 1929 & 22nd Sept 1954) it took 9,146 days for the S&P500 to reach a new high following a >20% bear drop.” Fast forward to 2019, when the S&P 500 took just 215 days to recover and surpass its old high.
So now that the Fed has made it clear it will never allow the market to drop materially – as any significant drop and/or recession will jeopardize what little faith is left in the wealth effect and the Fed’s powers – there is another number to keep in mind: 3,498.
Why? Because as of 2018, the S&P500 bull market was already the longest ever; however for the S&P500 to become longest and largest of all-time – which it may have no choice but to do in a world where every central bank is now all in on reflating risk assets – it will have to hit 3,498.
What is ironic is that with the S&P at all time highs, investor skepticism that anything about this rally is real continues to grow, and instead of fund flows into stocks, last week was another week of big inflows of $9.6BN but into bonds; meanwhile equities saw yet another week of redemptions ($0.3 billion), with total outflows from equities now a staggering $95 billion (more than all coming out of Long Only active equity funds), offset by $140 billion in bond inflows.
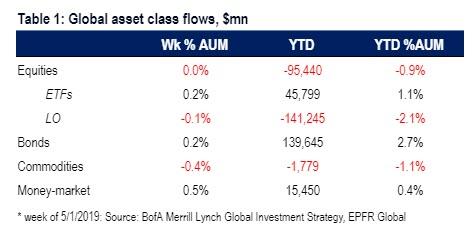
It’s not just institutions: BofA’s high net worth private clients also sold stocks and bought bonds over the past 8 weeks (0.2% & 1.2% of asset class AUM respectively); As BofA further explains, its high net worth clients’ETF portfolio (14% AUM) shows rotation from EM debt & HY to IG, Eurozone & Japan equities to EM, cyclicals to bond proxies (Chart 4).

Explaining who is buying, and who is selling, Hartnett writes that “Capitalists front-run populists“, and explains:
S&P reports Q1 buybacks up 12.1% YoY, almost 1/3 US companies boosting their YoY EPS growth by >4pps thanks to share count reduction;
The punchline “corporates rather than private clients & institutions driving equity prices.”
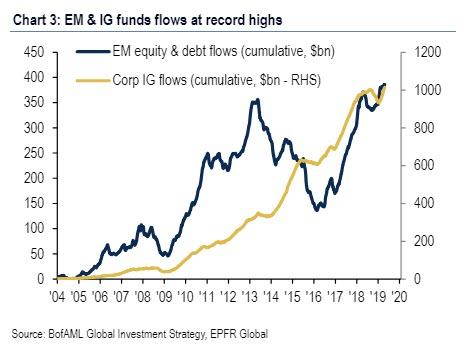
And since they are not buying stocks, investor flows are almost entirely into IG bond funds & EM funds (both equity & debt) both are currently at cumulative all-time highs, showing how powerful the “yield” theme has been for the past decade.
So with all that, where does the market stand in terms of the three Ps – positioning, policy and profits? Here is the answer from BofA:
- On positioning: BofAML Bull & Bear Indicator up to 5.1 (Chart 2), highest since Feb; surge to sell-signal of >8.0 requires a. $50bn inflows to EM equity, EM debt & HY bond funds (vs. just $10bn past 6 weeks), b. overbought equity indices (>80% above 50- & 200-DMA vs. 42% today), c. May BofAML Global FMS cash levels dropping <4.3%; these all suggest investor “greed” is in credit, not stocks.
- On policy: past 10 days Fed & PBoC failed to “out-dove” rate expectations, impeding the “breathless” rally in assets this year; universal complacency on endless low rates evident in record low MOVE index; but PBoC to remain easy until China labor market recovers (China employment PMI currently lowest since 2012), and Fed stays easy until US inflation picks-up; bottom line: we expect monetary policy to remain easy and for dips to be bought; tomorrow’s inflation data that could hurt fixed income = wages (AHE) >0.4% MoM & non-manufacturing ISM price index >60.
- On profits: rise in EPS expectations likely in coming months; estimate of BofAML Global EPS model (currently -7%) has turned higher on China financial conditions, Asian exports & global PMIs; but MSCI ACWI PE has already jumped 2.4ppt YTD (from 12.9x to 15.2x) and rare for this to occur without higher EPS;
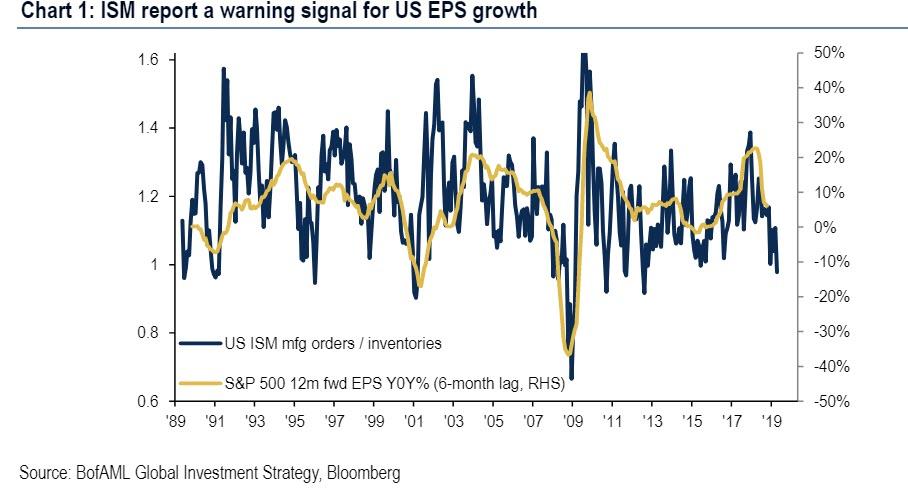
… poor ISM report showed US order-to-inventory ratio at lowest since 2012 = a likely harbinger of weaker US EPS growth (Chart 1);

So today’s latest spike higher on “goldilocks” labor market data, here is the BofA bottom line: SOX needs to hold 1400, and the CRB commodity price index needs to hold 400 to prevent investor “selling cyclicals in May”.
via ZeroHedge News http://bit.ly/2vzHGDZ Tyler Durden