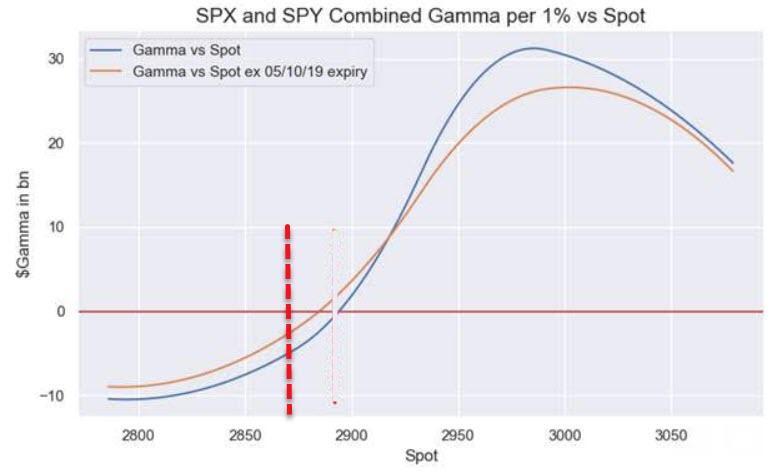
On Sunday evening, when futures were tumbling in kneejerk response to Trump’s one-two trade war tweet shock, we said that all eyes were on 2,890, which was the level where according to Nomura, dealer gamma turns negative again and selling begets more selling.
But while on Monday we saw a miraculous recovery in the S&P just as the futures were flirting with breaching 2,890 preventing an all out rout, today the bulls have had no such luck as it now appears that the US trade tariffs are virtually certain to begin at midnight on Friday, and as such the selloff has resumed and accelerated notably below 2,900 as of Tuesday afternoon, with the S&P sliding below 2,890, which has triggered various liquidation strats.
Nomura’s Charlie McElligott lays out all the key reversal points which are suddenly in play on Tuesday as the S&P tumbles below 2,900:
- CTA deleveraging risk levels for US Equities (sending signals from+100% down to +60%) now back “in play” following the “tariff tweet” follow-through gap lower (ESA 2895—SPOT CURRENTLY ‘THROUGH’, NQA 7598, RTYA 1584 CURRENTLY ‘THROUGH’—but note: technically most would need to see a hold and close below those respective levels) PLUS
- The convergence of the CTA Trend deleveraging level with our estimates on where index / ETF options Gamma flips “negative” with BOTH CURRENTLY ‘THROUGH’ (SPX / SPY consolidated @ 2893, QQQ @ 188.36) PLUS
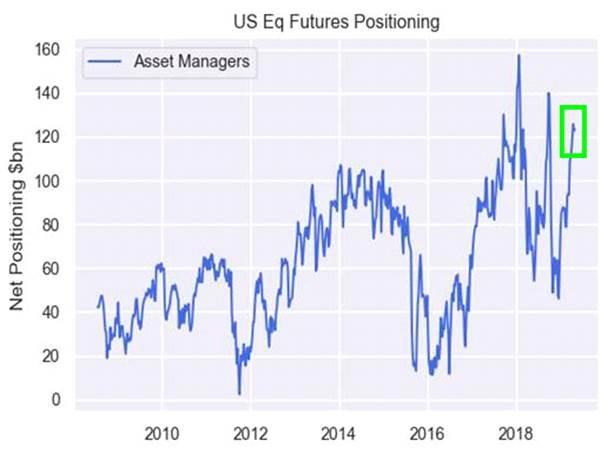
- Asset Managers selling-down / monetizing their enormous “length” accumulated in US Equities over the course of the year-to-date ($62B) to start the move PLUS
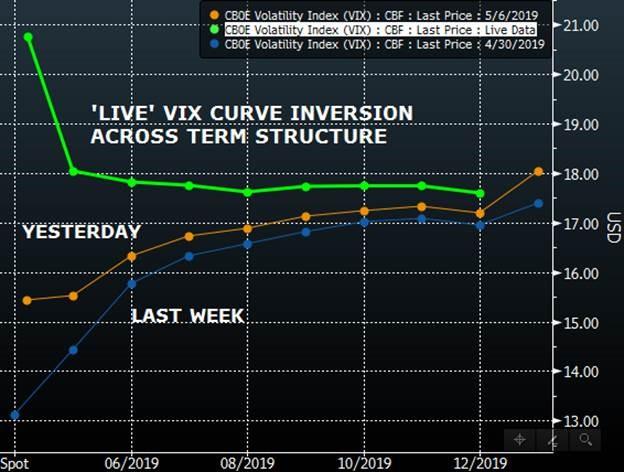
- VIX futures curve now riddled with inversions—as highlighted yesterday, this source is likely behind much of this now-forced covering of ‘short vega’ from systematics and “roll-down” strategies
It was these catalysts that the Nomura strategist said yesterday “could converge to create a “flow” risk (“supply over demand” imbalance) for US Equities off the back of the tariff drama reacceleration” and it certainly looks as if as we are seeing this supply “tip” into realization as of Tuesday afternoon, “with both SPX and RTY through their CTA deleveraging levels, a move exacerbated by the slide of the S&P in “negative Gamma” territory in SPX/SPY and QQQ options landscape—all as the VIX curve inverts and forces “short vega” covering from systematics.”
There are two ways to observe the internals of today’s massive puke (three if one includes the actual plunge in the S&P). The first is that the NYSE TICK registered the second biggest selling program in the past two months at 1pm…

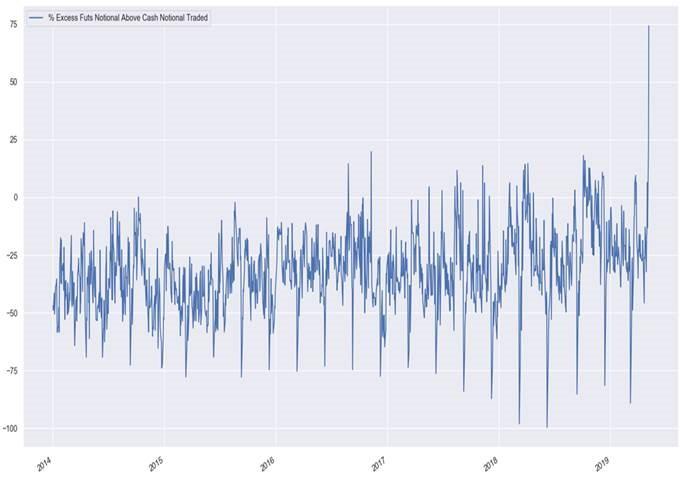
… but for the real nature of what is behind today’s liquidation look no further than the next chart showing the magnitude of the Futures over Cash notional today: currently intraday Nomura notes that “the excess Futures notional of S&P, Nasdaq and Russell above the combined Cash notional is supportive of the view that today’s trade is absolutely driven by futures deleveraging“, and is indicative that this:
- Asset Manager monetization of “Longs;”
- CTA Trend models may be reducing their “Long” (as described in more detail below) and of course
- Dealer Gamma hedging activity.
And this is what the market’s record futures puke looks like:
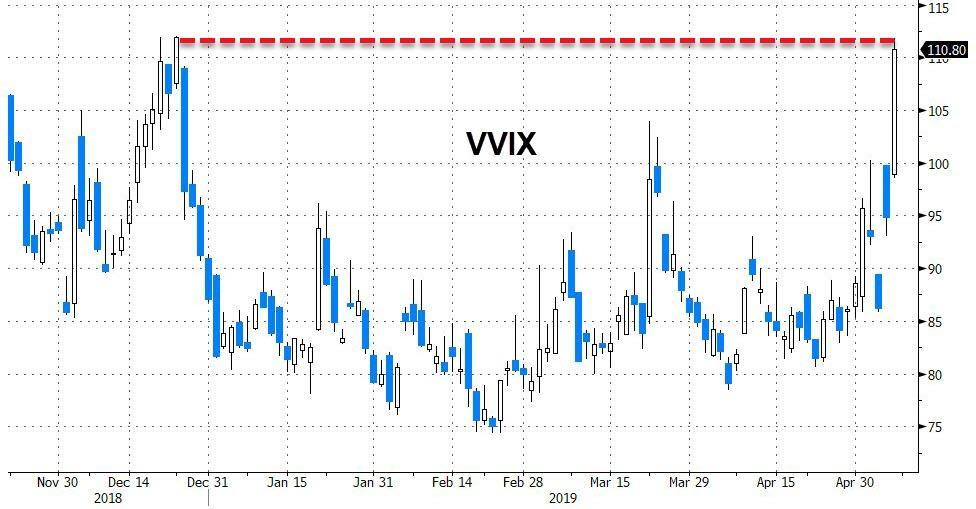
Meanwhile, with everyone pointing out as recently as last week how low both the VIX and net specs on the VIX had tumbled, look no further than VVIX, or the vol of the VIX, to see what happens when everyone is on the same side of the boat: as McElligott writes “VVIX really beginning to dance and price some serious “gap” / tail-risk @ 111″, and as for our question from this past Sunday, namely “Is The VIX About To Explode Higher Thanks To A Record Short Squeeze“, we now know the answer.
Finally, those wondering were are the next selling triggers, here are McElligott’s observations on what will catalyze even more selling:
- S&P 500, 100.0% long into today but ‘spot’ is currently through the sell-trigger level (note: needs to HOLD & CLOSE below), selling under 2894.82 to get to 60% as both the 2w and 1m signals “flip” to SELL, more selling under 2642.11 to get to -100%, flip to short under 2642.41, max short under 2642.11
- NASDAQ 100, 100.0% long into today, selling under 7597.86 (to get to 60%, more selling under 6699.38 to get to -100%, flip to short under 6700.16, max short under 6699.38
- Russell 2000, 100.0% long into today but “spot” is currently through the sell-trigger level (note: needs to HOLD & CLOSE below), selling under 1584.44 to get to 60%, more selling under 1579.99 to get to -100%, flip to short under 1580.15, max short under 1579.99
And the biggest irony: after defying the rally for so long, it was only in the past few days that asset managers finally threw in the towel, and rush to get equity exposure. And, as so often happens, that’s precisely when the trapdoor opened.
via ZeroHedge News http://bit.ly/2VRgxLC Tyler Durden