Authored by Lance Roberts via RealInvestmentAdvice.com,
Over the weekend, President Trump decided to reignite the “trade war” with China with two incendiary tweets. Via WSJ:
“In a pair of Twitter messages Sunday, Mr. Trump wrote he planned to raise levies on $200 billion in Chinese imports to 25% starting Friday, from 10% currently. He also wrote he would impose 25% tariffs ‘shortly’ on $325 billion in Chinese goods that haven’t yet been taxed.
‘The Trade Deal with China continues, but too slowly, as they attempt to renegotiate,’ the president tweeted. ‘No!’”
This is an interesting turn of events and shows how President Trump has used the markets to his favor.
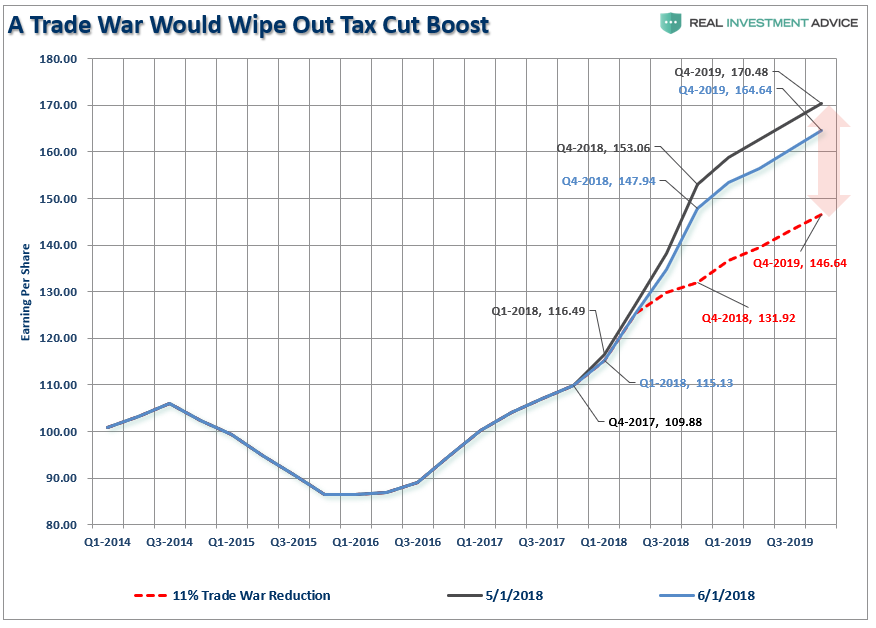
In January of 2018, the Fed was hiking rates and beginning to reduce their balance sheet but markets were ramping higher on the back of freshly passed tax reform. As Trump’s approval ratings were hitting highs, he launched the “trade war” with China. (Which we said at the time was likely to have unintended consequences and would kill the effect of tax reform.)
“While many have believed a ‘trade war’ will be resolved without consequence, there are two very important points that most of mainstream analysis is overlooking. For investors, a trade war would likely negatively impact earnings and profitability while slowing economic growth through higher costs.”
As I updated this past weekend:
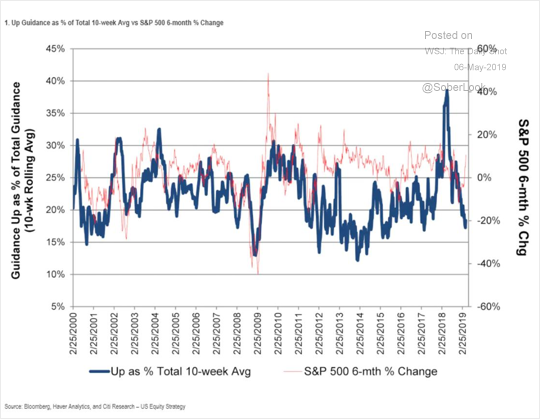
But even more important is the impact to forward guidance by corporations.
Nonetheless, with markets and confidence at record highs, Trump had room to play “hard ball” with China on trade.
However, by the end of 2018, with markets down 20% from their peak, Trump’s “running room” had been exhausted. He then applied pressure to the Federal Reserve to back off their policy tightening and the White House begin a regular media blitz that a “trade deal” would soon be completed.
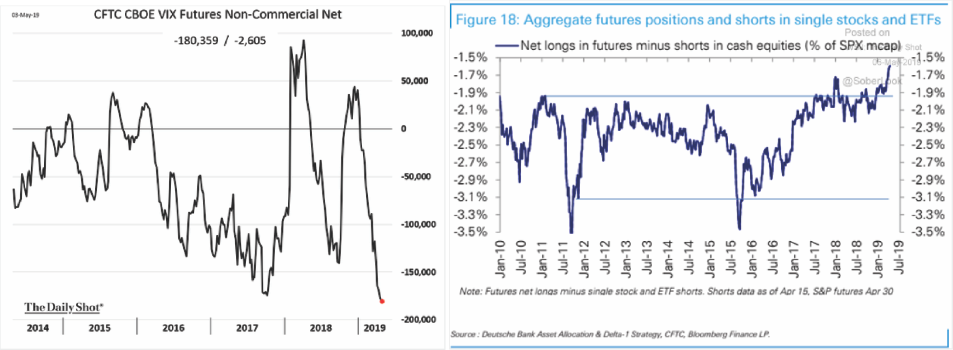
These actions led to the sharp rebound over the last 4-months to regain highs, caused a surge in Trump’s approval ratings, and improved consumer confidence. In other words, we are now back to exactly the same point where we were the last time Trump started a “trade war.” More importantly, today, like then, market participants are at record long equity exposure and record net short on volatility.
With the table reset, President Trump now has “room to operate” heading into the 2020 election cycle.
The problem, is that China knows time is short for the President and subsequently there is “no rush” to conclude a “trade deal” for several reasons:
-
China is playing a very long game. Short-term economic pain can be met with ever-increasing levels of government stimulus. The U.S. has no such mechanism currently, but explains why both Trump and Vice-President Pence have been suggesting the Fed restarts QE and cuts rates by 1%.
-
The pressure is on the Trump Administration to conclude a “deal,” not on China. Trump needs a deal done before the 2020 election cycle AND he needs the markets and economy to be strong. If the markets and economy weaken because of tariffs, which are a tax on domestic consumers and corporate profits, as they did in 2018, the risk off electoral losses rise. China knows this and are willing to “wait it out” to get a better deal.
-
As I have stated before, China is not going to jeopardize its 50 to 100-year economic growth plan on a current President who will be out of office within the next 5-years at most. It is unlikely, the next President will take the same hard line approach on China that President Trump has, so agreeing to something that is unlikely to be supported in the future is unlikely. It is also why many parts of the trade deal already negotiated don’t take effect until after Trump is out of office when those agreements are unlikely to be enforced.
Even with that said, the markets rallied from the opening lows on Monday in “hopes” that this is actually just part of Trump’s “Art of the Deal” and China will quickly acquiesce to demands. I wouldn’t be so sure that is case.
The “good news” is that Monday’s “recovery rally” should embolden President Trump to take an even tougher stand with China, at least temporarily. The risk remains a failure to secure a trade agreement, even if it is more “show” than anything else.
Importantly, this is all coming at a time when the “Seasonal Sell Signal” has been triggered.
Sell In May
Let’s start with a basic assumption.
I am going to give you an opportunity to make an investment where 70% of the time you will win, but by the same token, 30% of the time you will lose.
It’s a “no-brainer,” right? But, you invest and immediately lose.
In fact, you lose the next two times, as well.
Unfortunately, you just happened to get all three instances, out of ten, where you lost money. Does it make the investment any less attractive? No.
However, when in comes to the analysis of “Sell In May,” most often the analysis typically uses too short of a time-frame as the look back period to support the “bullish case.” For example, Mark DeCambre recently touched on this issue in an article on this topic.
“‘Sell in May and go away,’ — a widely followed axiom, based on the average historical underperformance of stock markets in the six months starting from May to the end of October, compared against returns in the November-to-April stretch — on average has held true, but it’s had a spotty record over the past several years.”
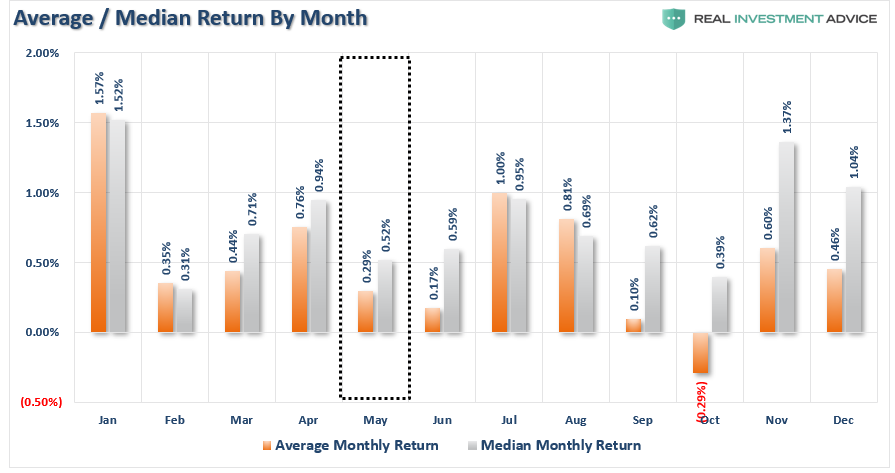
That is a true statement. But, does it make paying attention to seasonality any less valuable? Let’s take Dr. Robert Shiller’s monthly data back to 1900 to run some analysis. The table below, which provides the basis for the rest of this missive, is the monthly return data from 1900-present.
Using the data above, let’s take a look at what we might expect for the month of May
Historically, May is the 4th WORST performing month for stocks with an average return of just 0.29%. However, it is the 3rd worst performing month on a median return basis of just 0.52%.
(Interesting note: As you will notice in the table above and chart below, average returns are heavily skewed by outlier events. For example, while October is the “worst month” because of major crashes like 1929 with an average return of -0.29%, the median return is actually a positive 0.39%. Such makes it just the 2nd worst performing month of the year beating out February [the worst].)
May and June tend to be some of weakest months of the year along with September. This is where the old adage of “Sell In May” is derived from. Of course, while not every summer period has been a dud, history does show that being invested during summer months is a “hit or miss” bet at best.
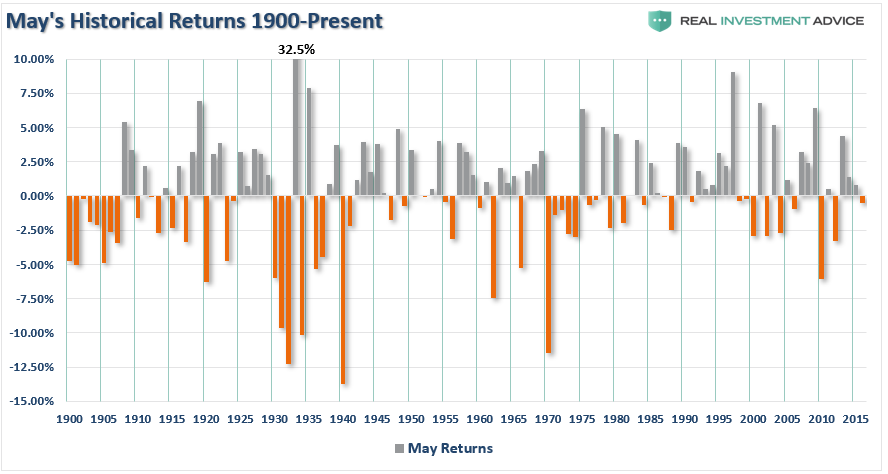
Like October, May’s monthly average is skewed higher by 32.5% jump in 1933. However, in more recent years returns have been primarily contained, with only a couple of exceptions, within a +/- 5% return band as shown below.
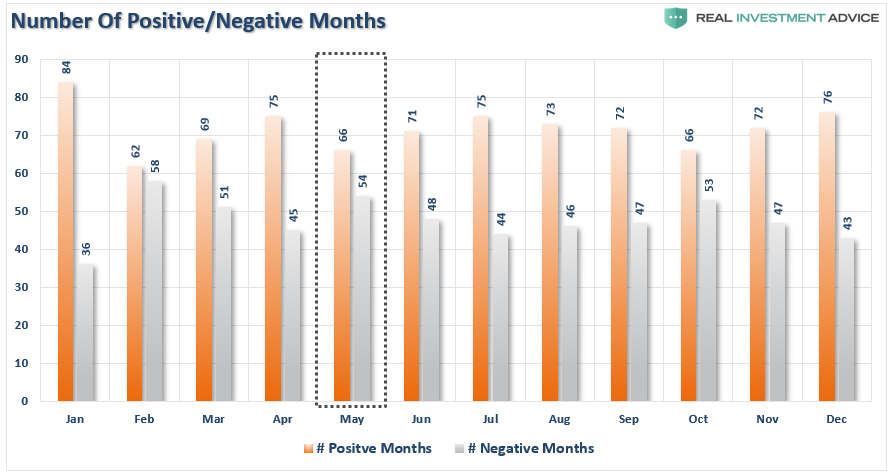
The chart below depicts the number of positive and negative returns for the market by month. With a ratio of 54 losing months to 66 positive ones, there is a 46% chance that May will yield a negative return.
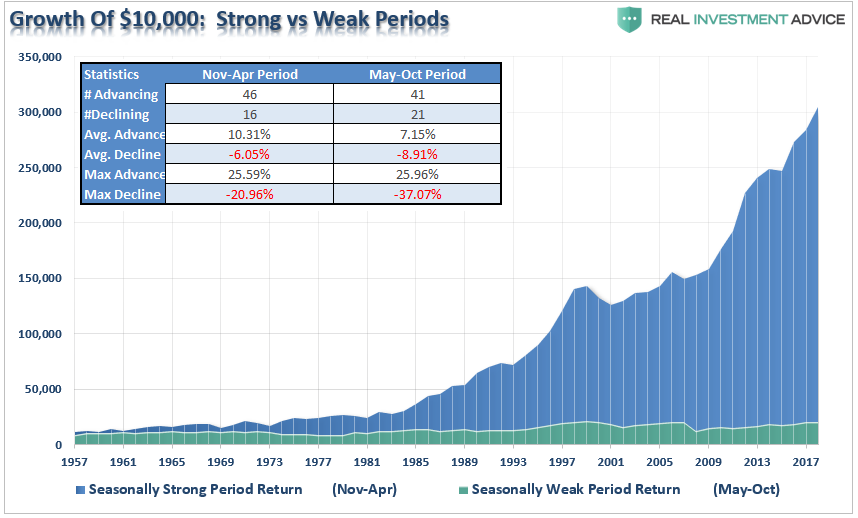
The chart below puts this analysis into context by showing the gain of $10,000 invested since 1957 in the S&P 500 index during the seasonally strong period (November through April) as opposed to the seasonally weak period (May through October).
A Correction IS Coming
Based on the historical evidence it would certainly seem prudent to “bail” on the markets, right? No, at least not yet.
The problem with statistical analysis is that we are measuring the historical odds of an event occurring in the near future. Like playing a hand of poker, the odds of drawing to an inside straight are astronomically high. However, it doesn’t mean that it can’t happen.
Currently, the study of current price action suggests that the markets haven’t done anything drastically wrong as of yet. However, that doesn’t mean it won’t. As I discussed this past weekend:
“While the market did hold inside of its consolidation pattern, we are still lower than the previous peak suggesting we wait until next week for clarity. However, a bit of caution to overly aggressive equity exposure is certainly warranted.I say this for a couple of reasons.
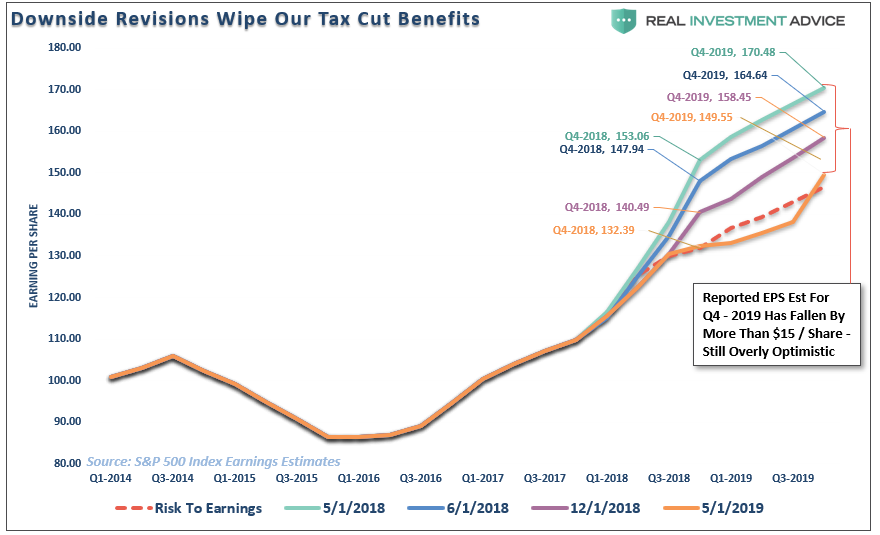
- The market has had a stellar run since the beginning of the year and while earnings season is giving a “bid” to stocks currently, both current and forecast earnings continue to weaken.
- We are at the end of the seasonally strong period for stocks and given the outsized run since the beginning of the year a decent mid-year correction is not only normal, but should be anticipated.”
With the markets on “buy signals” deference should be given to the bulls currently. More importantly, the bullish trend, on both a daily and weekly basis, remains intact which keeps our portfolio allocations on the long side for now.
However, a correction is coming. This is why we took profits in some positions which have had outsized returns this year, rebalanced portfolio risk, and continue to carry a higher level of cash than normal.
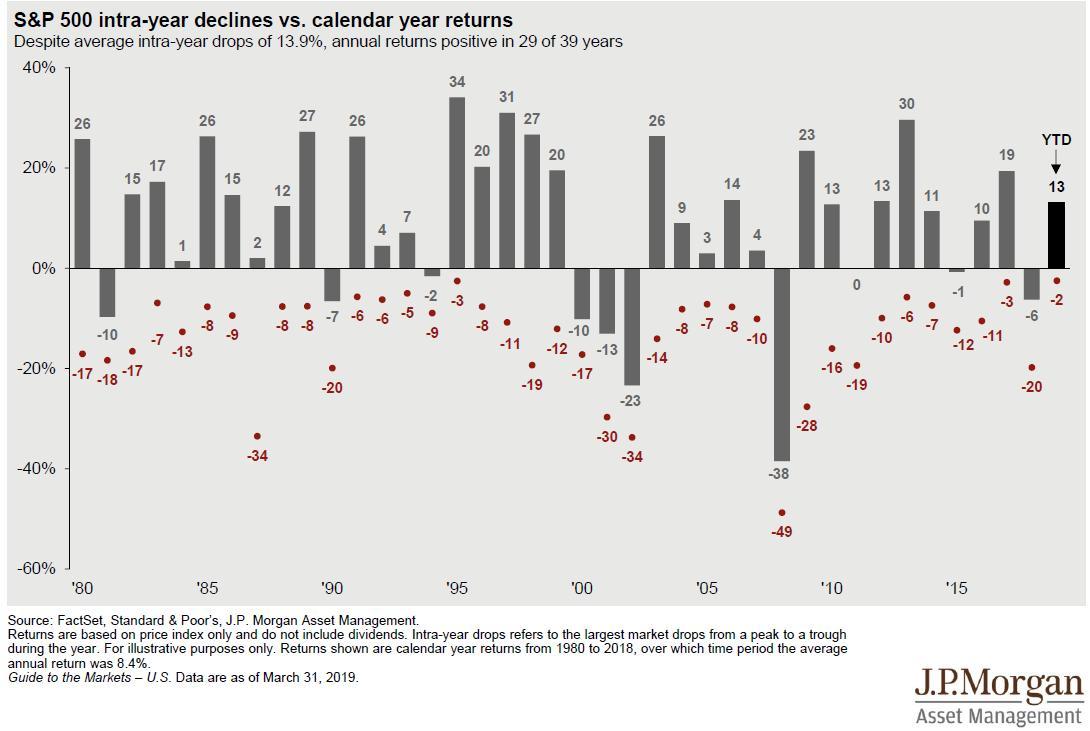
“The important point to take away from this data is that “mean reverting” events are commonplace within the context of annual market movements.
Currently, investors have become extremely complacent with the rally from the beginning of the year and are quick extrapolating current gains through the end of 2019.
As shown in the chart below this is a dangerous bet. In every given year there are drawdowns which have historically wiped out some, most, or all of the previous gains. While the market has ended the year, more often than not, the declines have often shaken out many an investor along the way.”
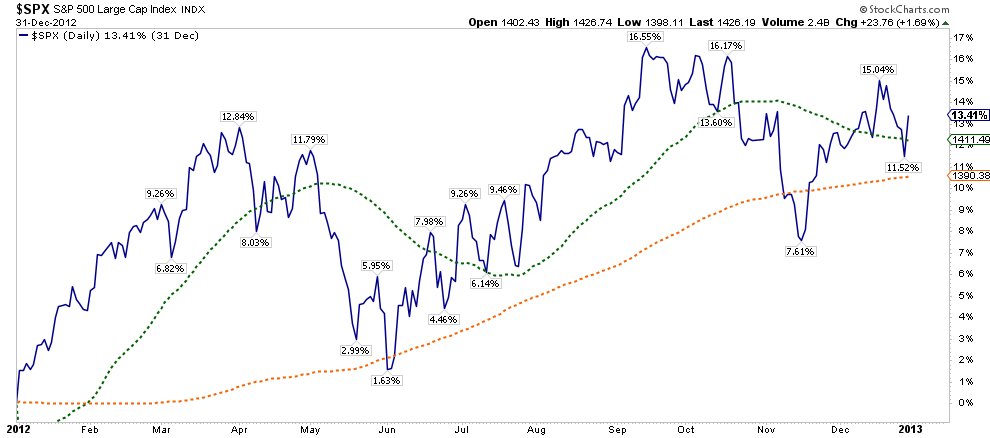
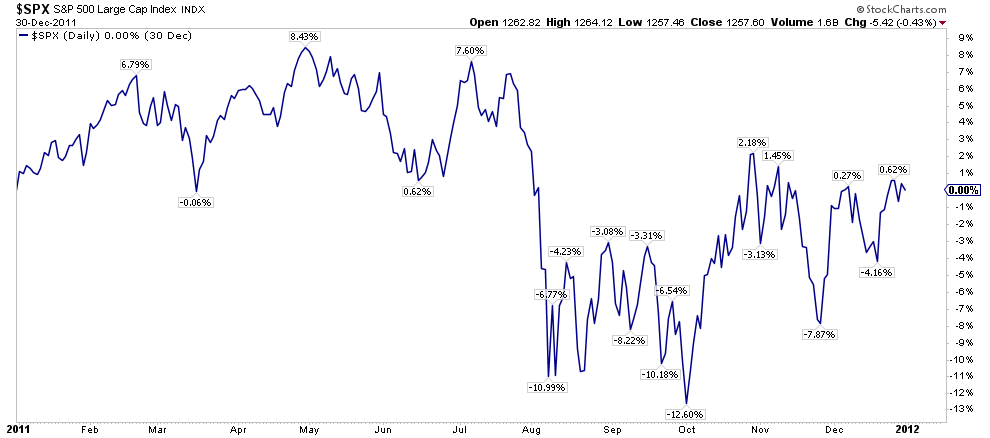
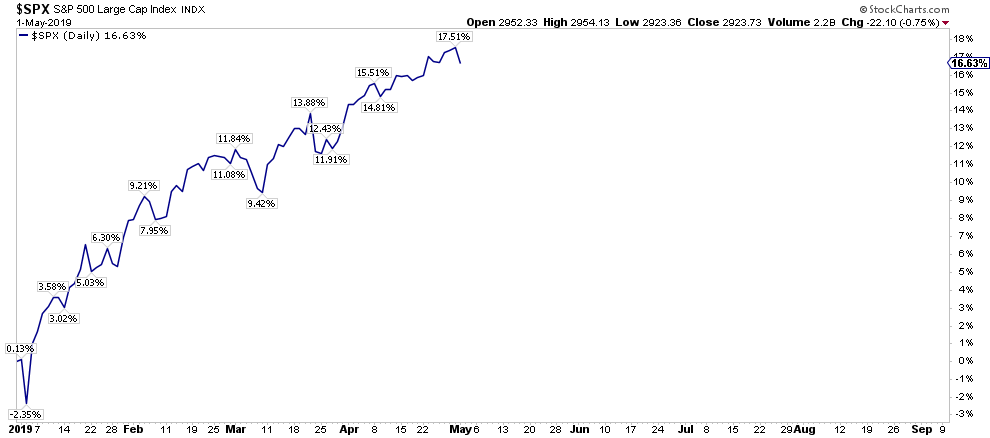
Let’s take a look at what happened the last time the market started out the year up 13% in 2012.
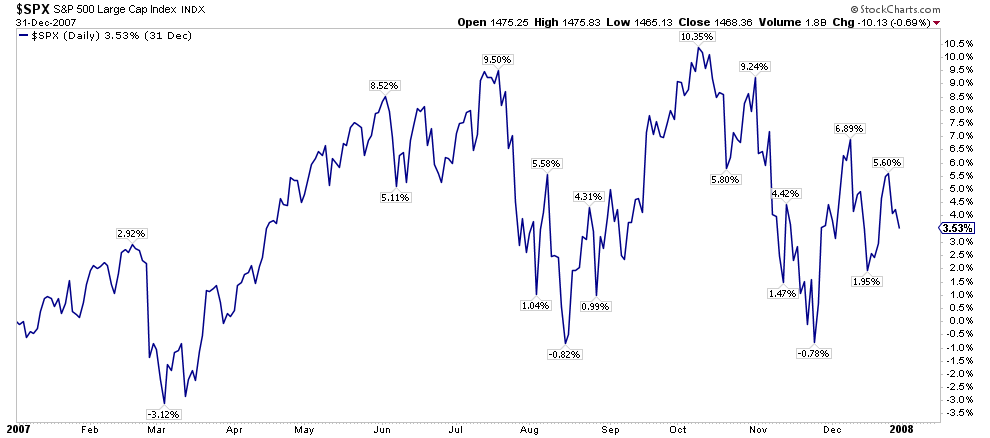
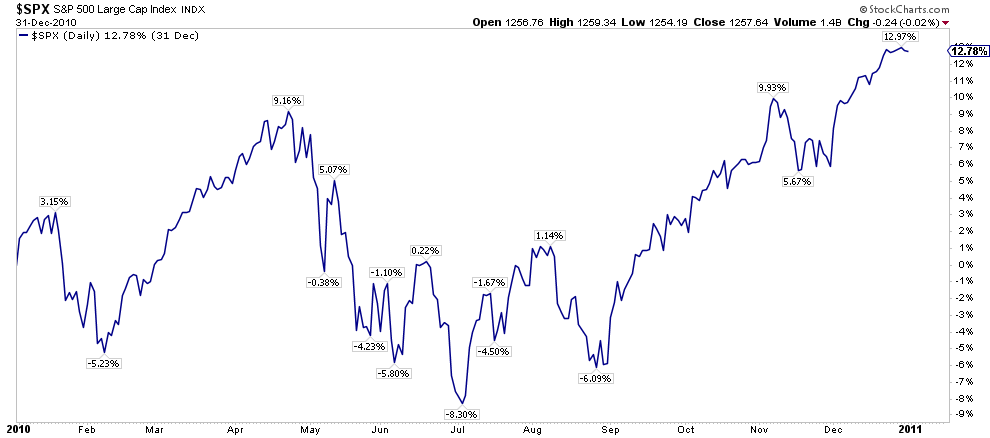
Here are some other years:
2007
2010
2011
Do you really think this market will continue its run higher unabated?
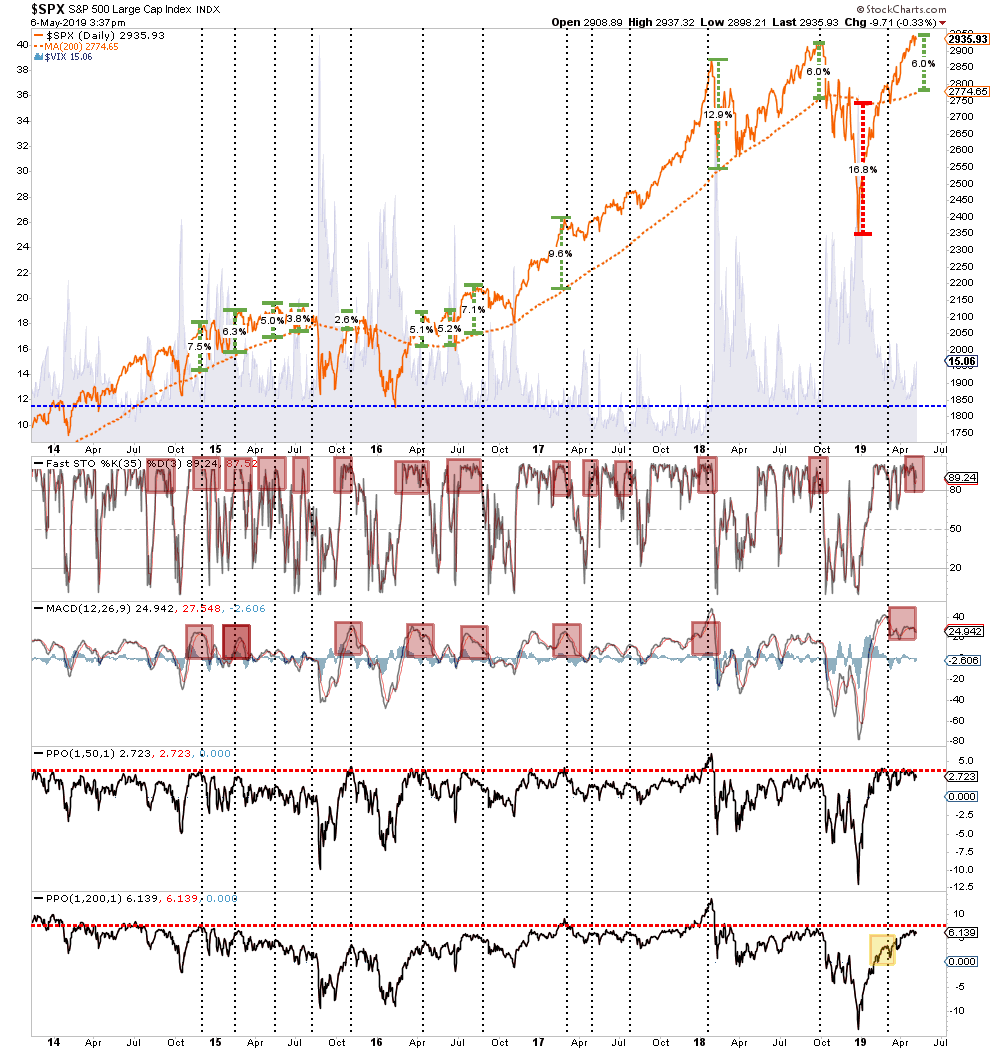
It is a rare occasion the markets don’t have a significant intra-year correction. But it is a rarer event not to have a correction in a year where extreme deviations from long-term moving averages occurs early in the year. Currently, the market is nearly 6% above its 200-dma. As noted, such deviations from the norm tend not to last long and “reversions to the mean” occur with regularity.
With the market pushing overbought, extended, and bullish extremes, a correction to resolve this condition is quite likely. The only question is the cause, depth, and duration of that corrective process. Again, this is why we discussed taking profits and rebalancing risk in our portfolios last week.
I am not suggesting you do anything, but it is just something to consider when the media tells you to ignore history and suggests “this time may be different.”
That is usually just about the time when it isn’t.
via ZeroHedge News http://bit.ly/304YGQS Tyler Durden
