Submitted by Danielle DiMartino Booth of Quilt Intelligence
The mercury is rising. But that also means the countdown to Halloween is under four months. That got us thinking; what is the oldest maintained cemetery in the U.S. of A.? A walk on the dark side, we know. And yet, we live for history in all its forms. With that, according to the American Cemetery Association, the Myles Standish Burial Ground located in Duxbury, Massachusetts wins the prize. It was in use from 1638 – 1789 and contains about 130 graves that belonged to several well-known Pilgrims who traveled on the Mayflower, including Captain Myles Standish, the cemetery’s namesake. A majority of the early graves were only marked with fieldstones or wooden markers, which have long since deteriorated or vanished. If you’re up for a road trip, QI recommends you take in this piece of history that made the National Register of Historic Places in 2015. Grab a selfie next to the oldest existing carved gravestone of Captain Jonathan Alden who died in 1697.
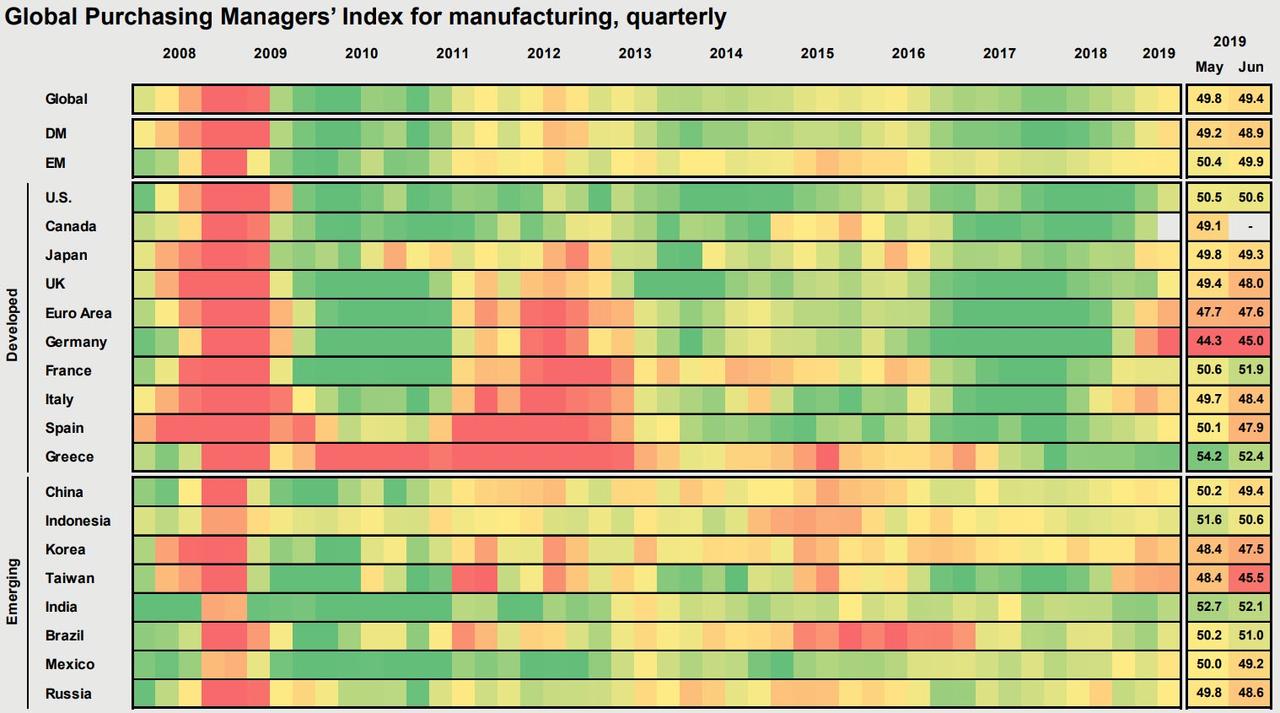
Speaking of tombstones, “Industrial Recession” was engraved in 2015. It would seem hammer and chisel are out again today. Twenty-one of the 35 nations that released global manufacturing purchasing managers’ indices (PMIs) posted outright contractions in June. The 60% share of countries coming in below the break-even 50 mark was the highest in seven years.
That is significant.
It means the current tariff/trade war episode is worse than the 2015-16 industrial recession centered on the energy bust. The worst month of that period saw the share of countries with sub-50 manufacturing PMIs at 49% in April 2015.
How can we gauge if the current experience will evolve into a full-blown case of the R-word? Incorporating the last twenty years, a cresting of the 70-80%-range of country breadth would be consistent with the U.S. recessions of 2001 and 2007-09. A mere push north of 60% would be consistent with the euro crisis and Euro Area recession of 2011-12.
How quickly the contagion proliferates also matters. The last two U.S. recessions included a doubling from the 30% to the 60% range.The bulge took one month and three months, respectively to develop in the 2001 and 2007-09 recessions. In 2019, it split the difference, taking a mere two months from April to June.
Industrial recession paints a picture of slower global growth.

For the U.S., it will translate into more persistent weakness in manufacturing employment. That should come as no surprise to those paying attention to the sinking Institute for Supply Management (ISM) Manufacturing Backlog index. Backlogs, a leading indicator of factory worker payrolls, registered in May (47.2) and in June (47.4) their first back-to- back contractions since the calendar turned from 2016 to 2017. Despite the strength in the employment index in yesterday’s ISM, there’s a good chance the consensus calling for a 1,000 gain in June manufacturing payrolls will be disappointed come Friday.
To sell you on the notion of a recession narrative, the risk has spread to broader labor concerns. Cue the U.S. construction sector. To cycle chasers like ourselves, it’s common knowledge that the construction report always plays second fiddle to the bellwether ISM Manufacturing survey that’s released the same day and hits the newswire at the exact same time.
That said construction spending is an integral part of the economic bean-counting process. Private construction data for the residential and nonresidential sectors are direct inputs in Gross Domestic Product (GDP), as are State and Local construction expenditures. Let’s focus on the top-line figure.
Total construction spending fell 0.8% in May, coming in below every estimate in the Bloomberg survey. The year-over-year trend is what caught our eye. The -2.3% twelve-month decline was the largest in eight years, clearly moving this labor-intensive sector into a late-cycle phase. The headline construction figure is a great proxy for the part of GDP specifically designated as “structures.” But one key element was absent: structures for oil & gas exploration, a.k.a. the rig count.
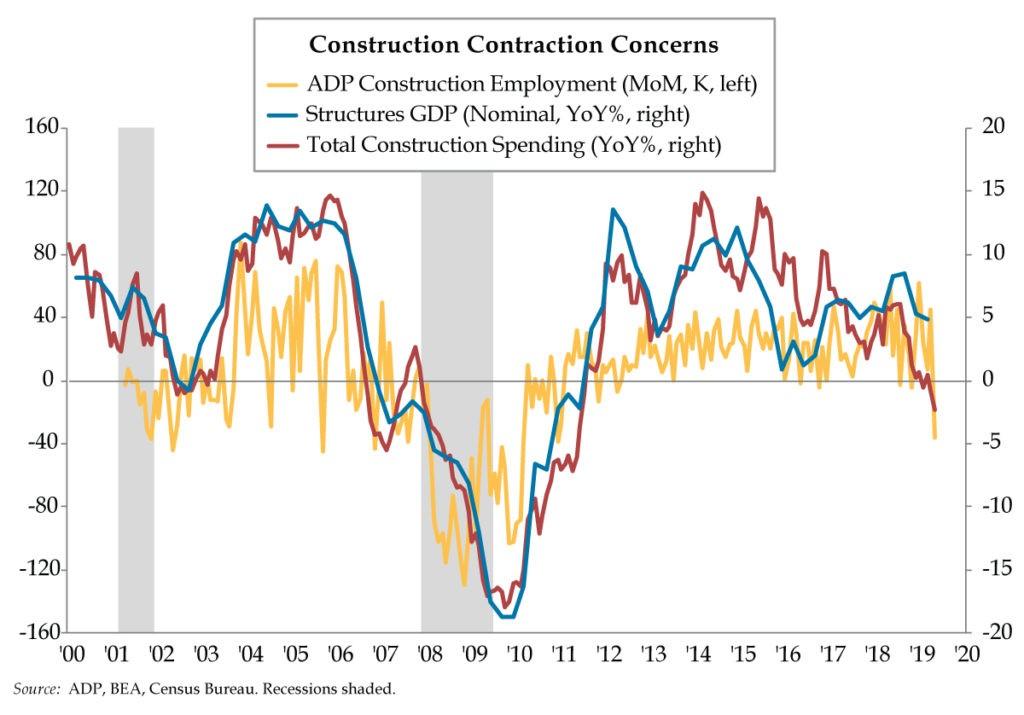
Even from this starting point, downside risk for the second quarter is abundant as rigs were falling about 8% versus year-ago levels in June after rising by mid-single-digits as recently as April. Granted, the recent bounce in oil prices should put a floor under the rig count, but the larger core of construction spending has raised the risk that second-quarter structures GDP will be challenged to keep its head above water, a.k.a. positive.
Persistent weakness in construction spending and construction GDP creates growing risk for cuts to construction payrolls, deftly illustrated above. ADP picked up this scent last month as construction employment abruptly fell 36,000 in May. Another sizable drop Wednesday and we’ll be looking for the hammer and chisel to look for the best placement for an uppercase ‘R’.
via ZeroHedge News https://ift.tt/2YyskNc Tyler Durden