Submitted by Nicholas Colas of DataTrek
US recessions are like epidemics: they all begin somewhere, and the “tell” is state-level unemployment data. For example, the end of the 2000 dot com bubble hit Connecticut and Massachusetts first – two hubs for the financials services industry with lots of affluent investors to boot. The end of the 2000s housing boom predictably impacted Florida and Nevada before the rest of the country. This time around, the data shows the manufacturing-heavy states of Michigan, Ohio and Indiana are most at risk. No wonder “Dr. Fed” wants to inoculate the region with lower interest rates.
When medical professionals study epidemics, they look for the source of the outbreak. Ideally, epidemiologists want to find “patient zero” – the first person to contract a given disease. Barring that, identifying at least the initial population to fall ill allows researchers to analyze what those people have in common and how the disease spreads.
Today we borrow from that approach to consider how US recessions start, using state-level unemployment to hunt for the “source” of the last 2 recessions. Joblessness is, of course, just one recessionary “symptom” and the transmission mechanism through the national economy morphs as the downturn takes hold. But locating “patient zero” is still useful because we can use the approach to consider where the next US recession may begin.
Here is what we’re looking for:
- States that had abnormally low unemployment at the peak of an economic cycle after lagging in the prior expansion, showing that the local labor market was exceptionally tight.
- A dramatic pickup in unemployment even as the nationwide data still looked good.
- Ideally, this rapid shift in labor market trends will point to regions disproportionately aided by a cyclical trend that, once it started to unwind, caused a national recession.
Example #1: Bursting of the dot com bubble in 2000
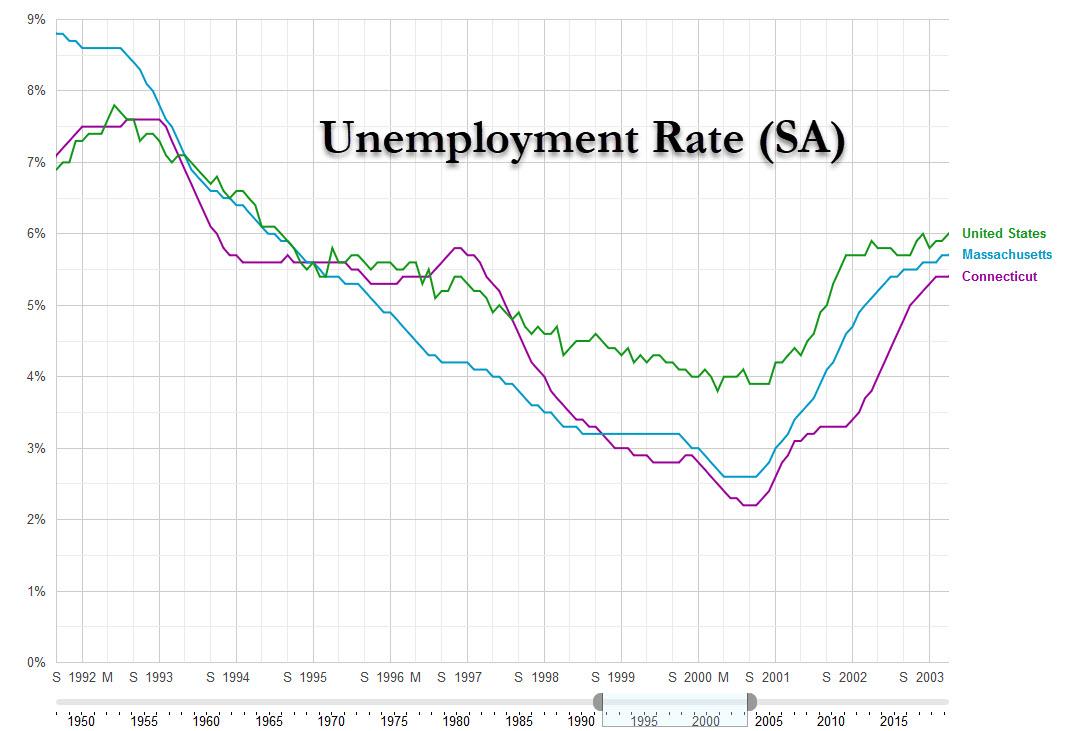
- In January 1993 Connecticut and Massachusetts both had unemployment rates higher than the national average (7.6%/7.8% respectively versus 7.3%).
- By September 2000, Connecticut had a 2.2% unemployment rate and Massachusetts was at 2.6%. National unemployment was 3.9%.
- At this time CT and MA had some of the lowest unemployment rates in the country, right alongside major agricultural regions like the upper Midwest (Iowa, Kansas, Minnesota, Nebraska, North/South Dakota), which have structurally low joblessness.
- Six months later, in March 2001, CT’s unemployment had risen by 0.7 points and MA’s by 0.8 points. By way of contrast, the national jobless rate had only increased by 0.5 points.
- Fast forward 2 years, and CT/MA unemployment rates at 5.4%/5.7% were very close to the national average of 5.9%.
- See the chart here (link):

Takeaway: these two affluent states with outsized exposure to the financial services industry were “patient zero” for a recession caused first by the bursting of the dot com bubble and then by the recession (with even lower stock prices) after the 9-11 terror attacks.
Example #2: The end of the housing boom in 2007
- In January 2002, the unemployment rate in Florida was 6.0% and in Nevada it was 6.1%, both higher than the national reading of 5.7%.
- Then the construction boom started, and unemployment in both states began to fall quickly.
- By March 2006, unemployment hit a then-record low in Florida (3.1%) and tied for a record low in Nevada (4.0%). The national rate was a good deal higher, at 4.7%.
- The warning lights flicked on in 2007. FL unemployment rose from 3.4% in January to 4.4% in October. In NV, the jobless rate went from 4.1% in January to 4.8% in October, matching the national number.
Takeaway: these two states saw the best and worst of the mid-2000s housing cycle, and the labor market numbers reflect that.
As for where the next recession will begin, the data points to one 3-state area: Michigan, Ohio and Indiana. Here is how we come to that conclusion:
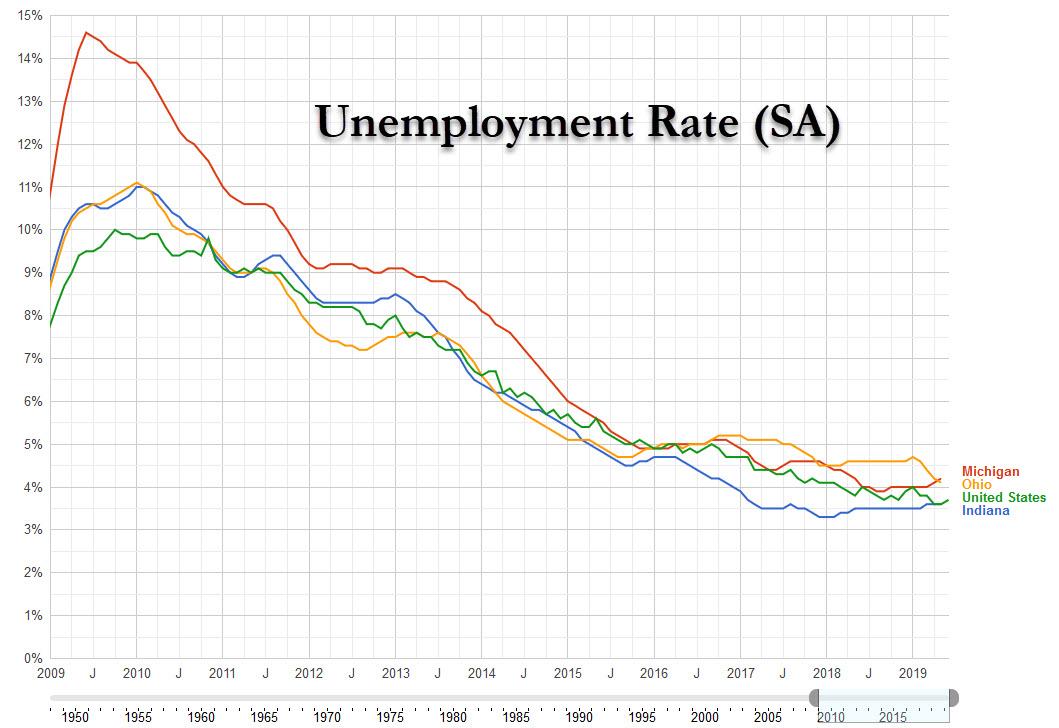
- All 3 states were especially hard hit during the Great Recession, with unemployment rates anywhere from 0.6 – 4.1 points higher than the national average. This fits the pattern of our historical examples noted above.
- Now, unemployment rates in MI, OH and IN are either equal to the national reading (IN) or within 0.3 points (MI and OH). While not yet below the countrywide unemployment rate, all 3 states are experiencing far lower joblessness than the 2000s cycle.
- Also, workers in these states have lower-than-average educational attainment. According to the US Census Bureau, Michigan ranks 34th in the US for the percent of inhabitants with a 4-year college degree. Ohio is 34th and Indiana is 43rd.
- That these states are seeing a better labor market with less-educated workers fits well with the national numbers; the only real slack left in the system is in this cohort.
- Chart of these 3 states versus the national unemployment rate below (link):
Summary point: by this reckoning the next US recession (or “epidemic”) will start with a pullback (“outbreak”) in manufacturing, since that’s the most important growth driver for the economies of Michigan, Ohio and Indiana. Viewed through this epidemiological lens, the Federal Reserve’s desire to essentially inoculate the region with lower interest rates at least fits the paradigm.
Other sources: US educational attainment by state.
via ZeroHedge News https://ift.tt/2XS0fnG Tyler Durden
