Authored by Chris Hamilton via Econimica blog,
Some folks have asked how the current population and demographic scenario plays out and the impacts on economics, financials, politics, and the environment. To give my best two cents, I offer the concept of stock versus flow. The world is all about growth; month over month, quarter over quarter, and year over year growth. Not stock but flow. In a world of 7.8 billion persons, from a growth perspective all that matters is the year over year growth of the population, the economy, financial assets. Obviously, I’m going to focus on the nexus…population growth according to the UN World Population Prospects, 2019 (linked HERE).
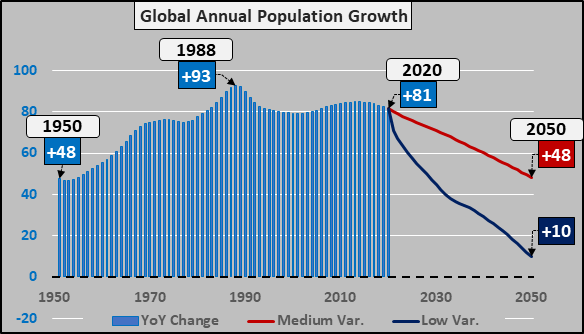
From 1950 to 1988, total year over year global population growth accelerated from +48 million/yr up to +93 million/yr (chart below). But since 1988, total year over year global population growth has been decelerating, now growing “only” +81 million annually in 2019, or 12 million fewer than the peak in 1988. By 2050, the UN estimates that total year over year growth will be somewhere between +48 million/yr (medium variant) to just +10 million/yr (low variant).
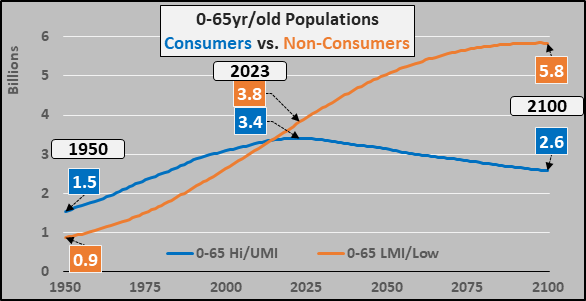
But the world is characterized by stark inequalities among the “haves” and “have-nots”. The World Bank is kind enough to categorize the worlds nations into four buckets by the Atlas Gross National Income per capita (geographically detailed HERE and listed HERE). High income nations range from $84k to $12k per capita, Upper Middle income nations $12-$4 per capita, Lower Middle income nations $4k to $1k, and Low income nations less than $1k per capita. To simplify what is taking place, I sweep the high and upper middle income nations 0-65yr/old populations together (blue line below), as these nations represent 90% of the global income, savings, and access to credit. They consume 90% of the energy and purchase 90% of the global exports. They drive global economic activity. Likewise, I sweep the have-nots 0-65yr/old populations together (tan line, below). The momentous takeaway should be that population growth among the 0-65yr/old global consumers is on the precipice of ending…and the end of growth is the beginning of secular decline. The lack of an effective transfer of wealth (and demand transfer) from haves to have-nots is now a huge issue.
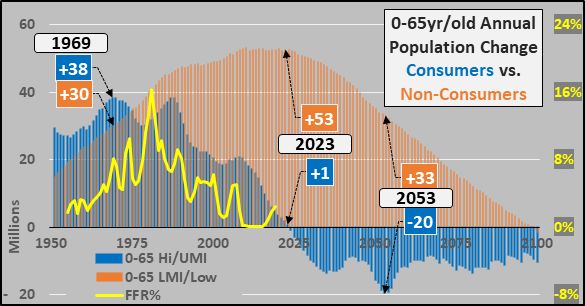
Perhaps it is easier to see the annual change in the two population sets, as annual growth among the consumers peaked in 1969 (blue columns below) and has been decelerating for nearly five decades. But according to the UN, the growth of global 0-65yr/old consumers will cease in 2023 and declines among the consumers will accelerate, reaching up to -20 million annually by 2053. As for the non-consumers (tan columns), they have progressed up and through peak growth and are now beginning a secular deceleration of growth. To highlight which group drives demand, consumption, and inflation…I add the Federal Funds Rate (yellow line). The FFR clearly tracked the accelerating and then decelerating growth among the consumers…and the case for ZIRP is pretty plain as a collapsing number of consumers versus rising total assets is imminent.
So, as growth among the consumers accelerated from 1950 through 1980, the Fed strangely made capital prohibitively more expensive, thus capping the growth of capacity against fast rising demand, thus stoking inflationary spirals. Then, as the annual growth in demand began decelerating from 1980 to present, the Fed made capital progressively cheaper stoking overcapacity and deflationary excess.
If the Fed’s goal was to manage the economy (and inflation and jobs within that context), the interest rate curve should have been the inverse supporting growth in capacity alongside accelerating growth in demand from 1950 to 1980. And once demand was waning, higher rates would have been sensible to avoid cheap money fueling the creation of capacity into declelerating demand. Whether the Fed’s (and like central banks) intention was to strangle global economic activity and stoke inflation to control population growth, I have no way of knowing. But with widely accessible birth control making child birth a conscious determination and costs of living rising well in advance of wages, each asset bubbles pushed fertility rates and population growth down further.
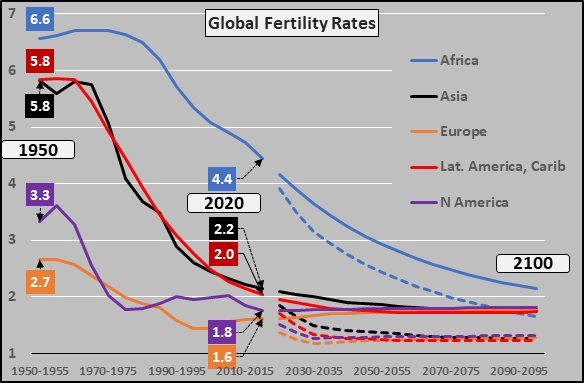
The chart below shows fertility rates from 1950 to 2020 and UN medium and low variants through 2100. The UN predicts that in 2020, all regions except Africa will have fertility rates below 2.1 or negative fertility rates (ok, Asia is anticipated to turn negative by 2025). What is surprising is the expectation that North America and Europe fertility rates will rise, particularly as they both continue to collapse to all time lows since 2007. As for Africa, fertility rates are plummeting and expected to continue doing so…but the ongoing growth that Africa represents is not translating as it very low emigration rates, particularly compared to Central America or South Asia.
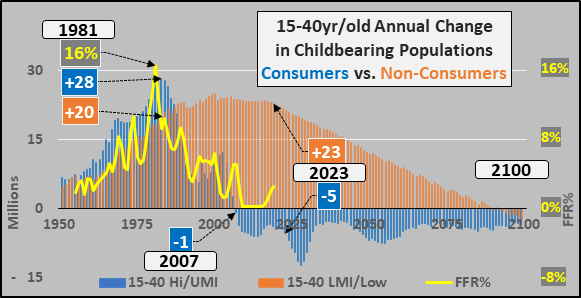
So, with tanking fertility rates and a declining childbearing population among the consumer nations ever since 2007, the confidence level is very high that growth isn’t coming back any decade soon. The chart below shows the annual change in the childbearing populations of consumers (blue columns) and non-consumers (tan columns). This is a process of depopulation among the consumer nations that is already in the advanced stages. Again, I include the Federal Funds Rate, as it is nearly a 1:1 match with the annual change of the consumer nations childbearing population, and the changing demand they represent. The implication is that population growth leads (changing demand) and the Federal Funds rate follows…so ongoing rate policy shouldn’t be hard to cipher.
What happens now? With a declining potential global workforce among the consumer nations (aka, declining potential consumers) the overcapacity of real goods, services, and assets (real estate, stocks, bonds, commodities)…a deflationary spiral is only exacerbated by low rates incenting even more capacity creation thanks to ZIRP or more likely NIRP (paying debtors to take out further loans). The cheap money is also fueling innovation, automation, robots, and autonomous vehicles, etc. (all good things, in a vacuum) that are all further exacerbating the deflationary spiral via ever greater capacity absent creating like demand.
This cheap money is rewarding asset holders more than wage gains among workers (particularly asset-lite or asset-less young adults who comprise the childbearing population). These policies of inflating asset prices are rewarding elderly and institutions who own the bulk of assets over the young adults who are being penalized with record rents, home prices, insurance, medical costs, day care costs, and student loans, etc.. All this is further delaying marriage and family formation and only pushing fertility rates toward the low variant. The global population is set to peak far sooner and more dramatically than the UN’s current 2100’ish date.
Global commodity demand is likely to likewise collapse far sooner than anticipated and large overcapacities will likely stymy further green efforts.
All the D’s are now in play; in the rearview mirror are the deceleration of population growth and concomitant decelerating economic growth, interest rate distortions to provide false signals to the market resulting in excessive personal, corporate, and federal debt. The interest rate distortions have and continue to push asset price distortions. Currently deflation is sweeping the globe, leading to upcoming outright depopulation, depression, and ultimately corporate and/or national currency defaults.
A terrible daisy chain of events has long been underway and although we still have better options, at every fork we seem to take the wrong turn. In the not too distant tumult, those least responsible and those who played by the rules will likely disproportionately suffer the consequences as the bedrock on which they have built their homes, retirements, and dreams crumbles away.
via ZeroHedge News https://ift.tt/2y45KjR Tyler Durden
