‘Quant Quake 2.0’ Fallout: Nomura Warns Of “Horrific” Returns For Momo Stocks Ahead
The shock of yesterday’s US Equities factor reversals will go down in infamy alongside the August 2007 “Quant Quake” and the Fed/March/April 2016 “Market-Neutral Unwind” as one of the more stunning trades in modern market history…
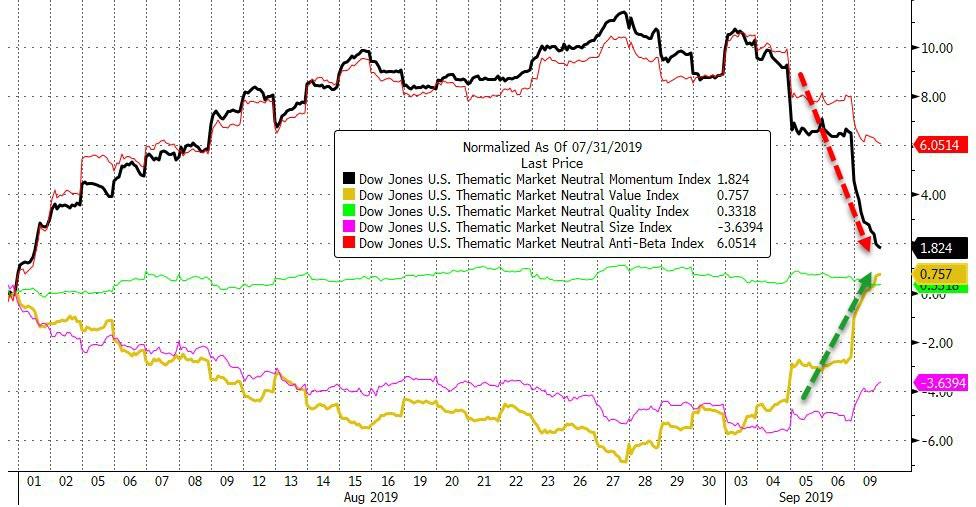
…And yet, as Nomura’s Charlie McElligott exclaims, hilariously, nobody watching financial TV or Joe Schmoe retail investor looking at just simple Index returns in isolation (or even a more sophisticated investor looking at the Vol complex yday) would have had any idea of the calamity occurring under the surface, as it was all about a blowout in sector- and thematic- dispersion which then acted to offset / “mask” the “top down” moves.
Stepping into today’s trade and CRITICALLY as it pertains to said devastating “internals” within this US Equities performance dynamic of the past few sessions, overnight we see US Rates / USTs pausing the bleed of the past week and actually “bull-flattening” – which should help “locally” to stop the violence of the Equities “Momentum” unwind, which at its “macro core” was “kicked-on” by the recent Duration selloff / “Bear-Steepening” in US Rates.
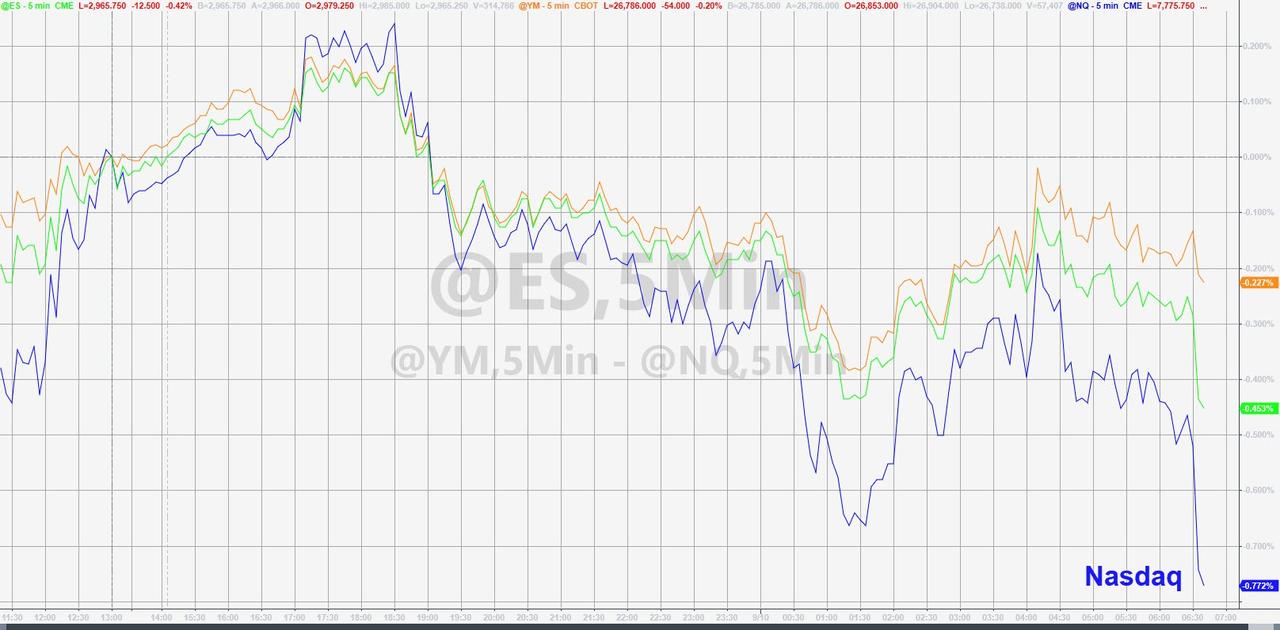
But for now, Nasdaq is notably underperforming…
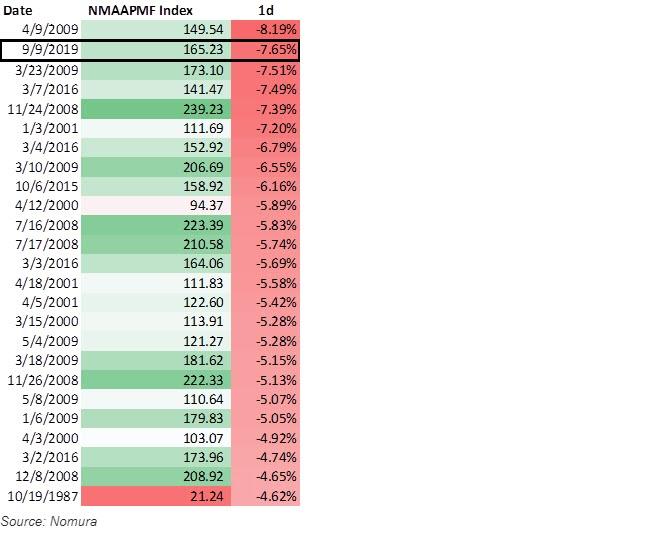
Just how unprecedented was the “Momentum Shock” unwind? Yesterday’s -7.7% move in US Equities “1Y Price Momentum Factor” was the second largest 1d drawdown in the history of our factor data going back to 1984 (the worst day being -8.2% on April 4th, 2009), while my US Equities HF L/S model was -3.3% on the day, tied for the second-worst 1d performance move for the leveraged fund proxy since the jarring 2015 “Growth Scare” trade (all of which encompassed a China FX deval, a disinflationary “Crude Shock,” US HY E&P default scare, a one-quarter US Earnings recession and the first Fed hike of the cycle).
What would make the Momentum unwind stop or pause? As mentioned above, a resumption of the Duration / Rates rally (particularly “bull-flattening”) would staunch the pain, and could easily be driven by more “bad global growth data” or an “dovishly inline with market expectations” ECB this week
But what could make the Momentum unwind accelerate? Two potential catalysts I’m watching:
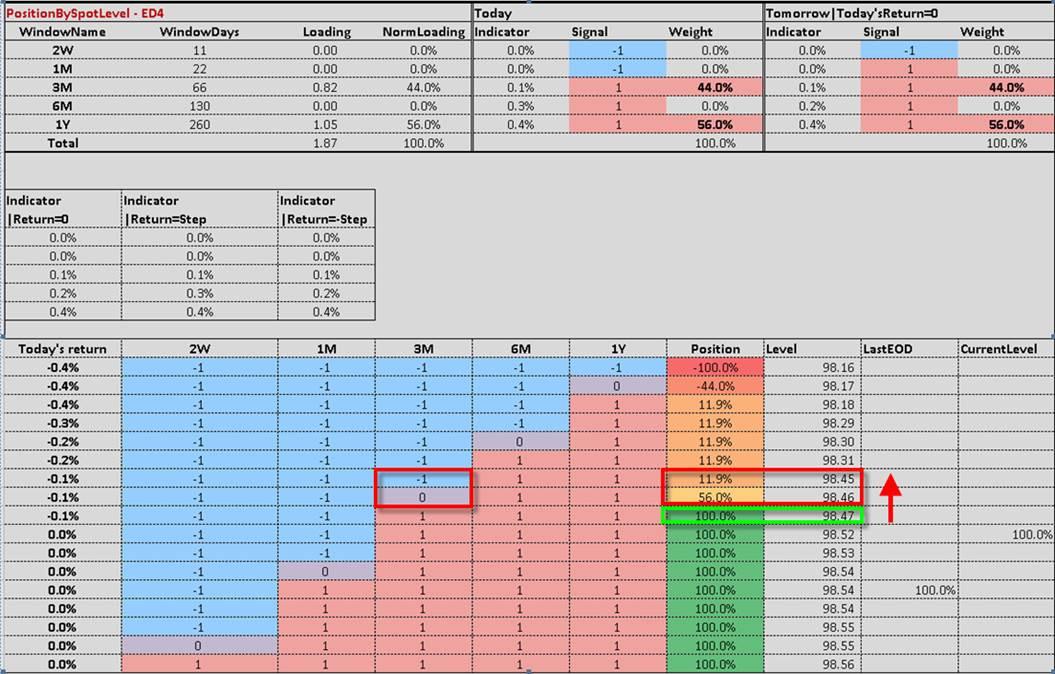
First is price-based, as it relates to the Nomura QIS CTA model and the level at which we would see Systematic Trend begin to deleveraging from the legacy “+100% Long” position in ED$ (ED4 is what we track), as it is the best proxy for the Leveraged Fund universe and their “grab” into the YTD Rates trade; currently we would expect reduction / selling-down of that position on a break and close in ED4 below 98.46/45, where the signal would move from “+100% Long” to just “+12% Long” as the 3m model window would “flip” to SELL (see bottom chart / table of email)
Second is the waaay out of consensus ECB scenario I put in yesterday’s first note, as outlined by our EGB Rates Strat Marco Brancolini, who made a call into the ECB that we see a “dovish surprise” from the ECB…but that perversely, it could come via a surprise twist which would actually see the long-end HIT LOWER, which in-turn would extend the recent “steepening” in Rates curves and risk accelerating the current “unwind” dynamic further.
Most importantly below, Nomura’s McElligott attempts to answer the question that every investor has been asking over the past 24 hours:
“What does this type of “Momentum Shock” mean for forward themes and returns for both S&P and “Momentum” themes going-forward?”
(e.g. implications for the reversal of various long-standing dynamics seen with “Growth over Value,” “Defensives over Cyclicals,” “Large Cap over Small Cap,” “Min Vol over High Beta / High Vol” etc)
We tested scenarios three scenarios:
1) a “Momentum Shock” of this magnitude (hint: a VERY small sample size as noted earlier!), and specifically,
2) the Value (“EBITDA / EV” factor) performance standalone and
3) the Value outperformance as a spread vs “1Y Price Momentum” factor at a similarly extreme level
Per said back-tests, the dates where we experienced comparable “triggers” in both tested scenarios are a rather stunning group of macro periods which were MAJOR market inflections / escalations…
PUNCHLINES:
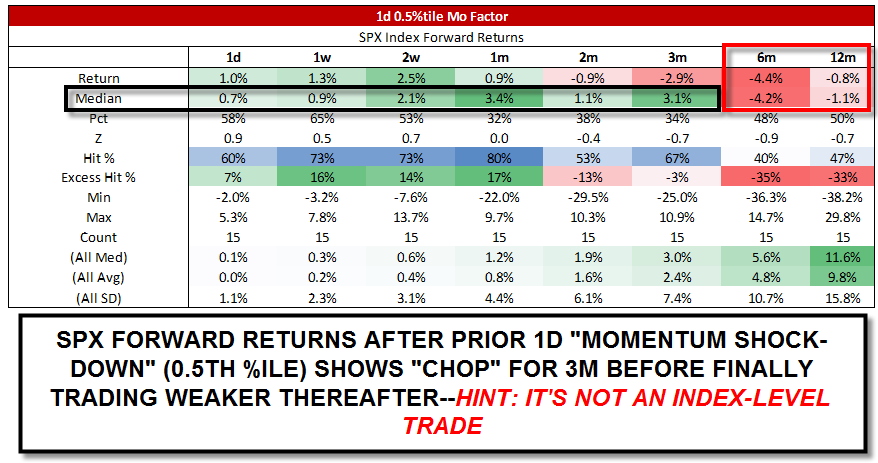
The S&P looks to painfully just “chop” in a range both up and down, which means that traditional hedges might not do anything for you IF your single-stock / thematic tilts continue going “wrong-way” (as this is a DISPERSION issue / portfolio rebalance / rotation trade, not an index trade).
A prior extreme “Momentum Shock” test (we look at previous -6.8% or more 1d returns) shows us that “Momentum” continues to come unglued: -9.9% 2s return, -11.8% 1m, -10.6% 3m, -26.2% 6m, -27.8% 12m.
HORRIFIC FORWARD RETURNS FOR “MOMENTUM” FACTOR AFTER A COMPARABLE “SHOCK DRAWDOWNS”
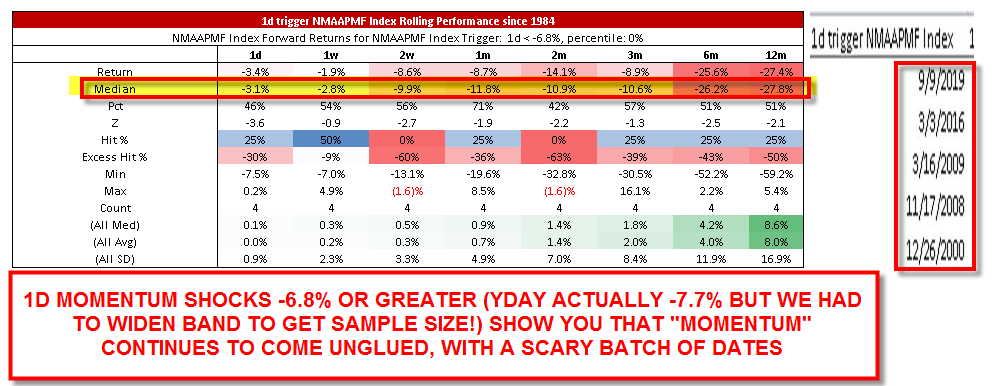
And a look the DATES for prior-6.8% Momentum 1d return are particularly “compelling”: outside of yesterday, we see 3/3/16 (peak of the 2016 famed “mkt-neutral unwind” where funds experienced a massive “Momentum Shock” following the late 2015 global growth scare pivot into cyclical risk-on after the Shanghai accord / Yellen ‘weak dollar’ policy); 3/16/09 (GFC mkt bottom); 11/17/08 (post Lehman escalation into the GFC lows); 12/26/2000 (Tech bubble pop acceleration)
Prior extremes in our “Value” factor proxy where “EBITDA / EV” saw a 1d 99.5th %ile return (yesterday was actually +99.7th %Ile but we had to widen out for sample size) tells us that under prior “trigger” events, “Value” factor too chops from here out to 3m months but then EXPLODES HIGHER out 6m (+27.1% median return) and 12m (+83.3% return!)
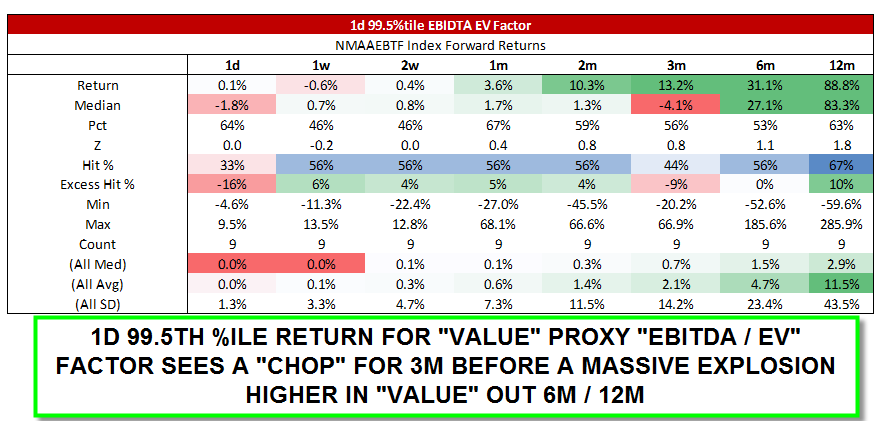
This is possibly telling-us that either the “end of days” global growth prognostications were wrong, or that we do indeed begin to come out of Recession – either way, a BIG “Value outperformance” trade begins
Tyler Durden
Tue, 09/10/2019 – 09:40
via ZeroHedge News https://ift.tt/31ea4K4 Tyler Durden