The Top 30 IPOs Of 2019 Will Burn A Total Of $12.5 Billion Between Them
After the recent WeWork IPO debacle, not to mention the Uber and Lyft public offering fiascos, investors may finally be waking up to the realization that they dumped a whole lot of money in pursuit of gains that will never materialize, and their “investments” are set for a painful lesson in irrational exuberance, even as silicon valley VC exits laugh all the way to the bank.
It is therefore no surprise that, as Goldman’s chief equity strategist David Kostin writes in his latest “Weekly Kickstart” periodical, the abundance of new high-profile IPOs has prompted many questions from portfolio managers. One frequent inquiry: How does the 2019 class of IPOs compare with offerings completed during the late 1990s Tech boom?
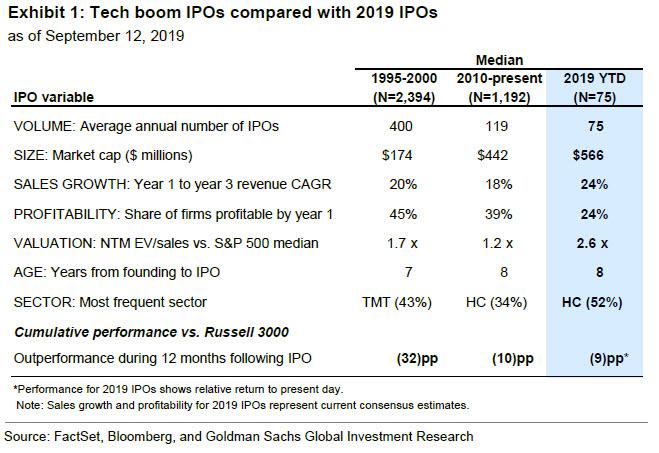
To answer this question Kostin reviewed six variables and compare the 2019 class of IPOs with the those from the Tech boom: (1) volume, (2) sales growth, (3) path to profitability, (4) valuation, (5) sector, and (6) firm age. Here are the key findings:
VOLUME: “Mania” rather than “boom” is a better description of the IPO market in the late 1990s.An average of 400 IPOs were completed every year for 6 years. In contrast, the annual volume of IPOs has averaged 120 during the past 20 years and 2019 is matching that pace with 75 IPOs completed YTD (107 annualized). Yet if investors merely allocate far more capital to fewer potential blow ups, is that really a consolation?
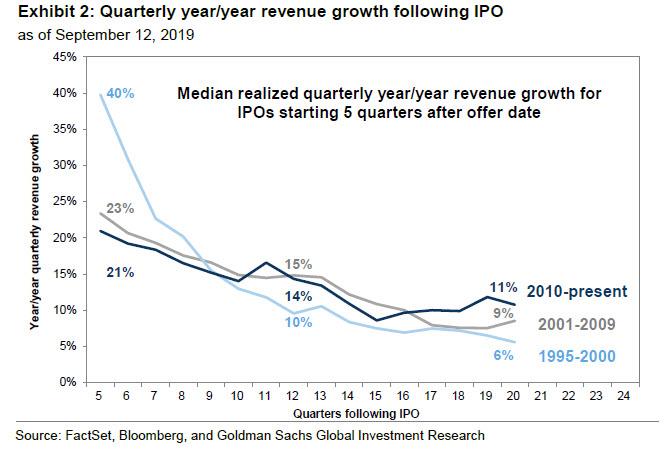
SALES GROWTH: Where there is certainly elements of mania, is the public’s expectation of future growth currently, even compared to the dot com bubble. Annualized sales growth during the first three years for the median 2019 IPO is expected to be 24%, higher than the expected realized sales growth for the typical IPO during the Tech boom, which equaled 20% during the first three years. The fade in realized sales growth rate did not provide incremental information about the likelihood of share price outperformance during the first three years as a public company. At some point however, hope and reality crash: this was most obviously during the dot com bubble when the median year/year sales growth plunged from 40% to 10%. During the two recent cycles, the median realized sales growth fell from roughly 22% to 15% between years two and three. For the IPO class of 2019, consensus expects sales growth will decelerate from 29% in year 1 to 22% in year 3.
PROFITABILITY: Since 1995, roughly half of IPOs completed in a given year posted positive net income in the first year as a public company. And here a “shocker”: IPOs completed during 2019 are projected to be the least profitable IPOs of any year since the Tech boom. In 1999, just 28% of IPOs reported positive net income during the first 12 months in the public market, which fell to 21% for IPOs in 2000. Analysts forecast just 24% of 2019 IPOs will report positive net income this year.
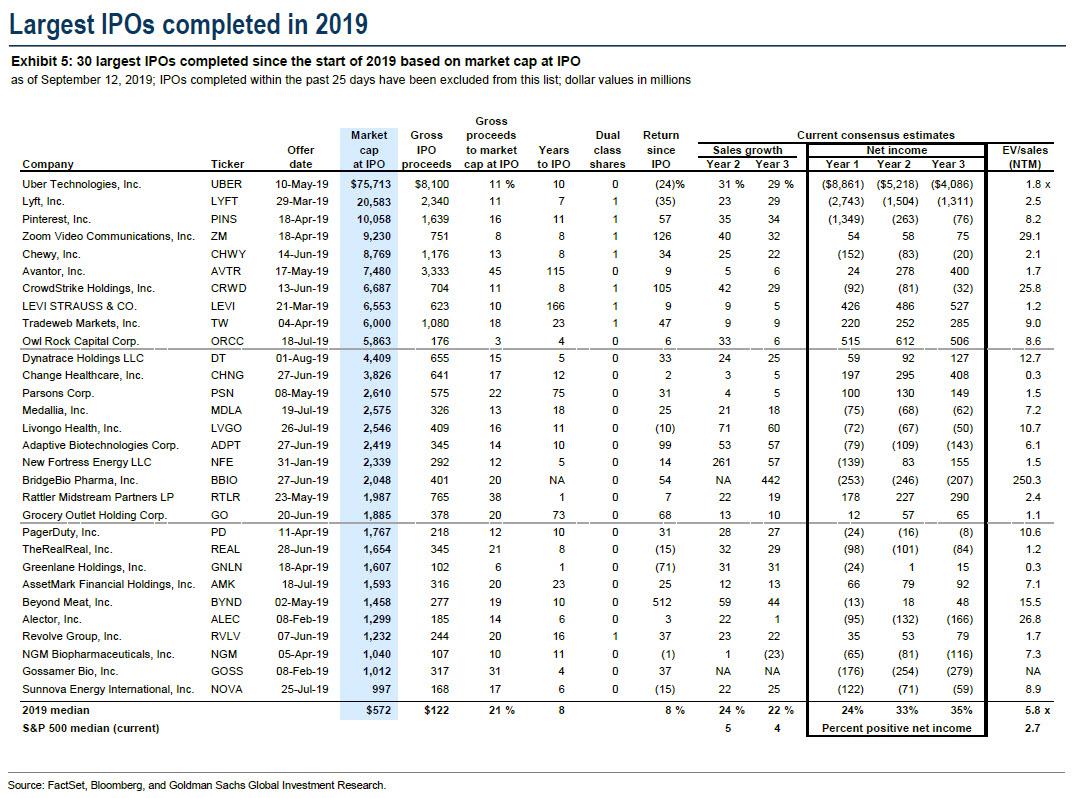
And another stunning observation: adding across the top 30 IPOs of 2019, whose combined market cap on the day of going public was just under $200 billion…
… they are projected to burn a total of $12.5 billion (although outlier companies like Uber, Lyft and Pinterest certainly dominate).
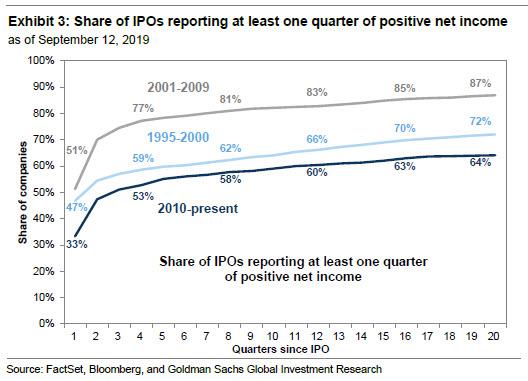
What does this mean based on historical patterns? Well, it’s hardly good: during the Tech boom, 66% of IPOs reported at least one quarter of positive net income by the 12thquarter following the IPO. Stated differently, 1/3 of new issues completed during the late 1990s had not registered a single profitable quarter three years after the IPO and only 72% had achieved profitability five years following the IPO. If a company has not achieved profitability by year three it is empirically unlikely to do so by year five. Analysts expect 43% of 2019 IPOs will be profitable at some point during the first three years as a public company, in other words, roughly half of this year’s IPOs will soon be bankrupt, especially once the US economy enters a recession as is widely expected some time in 2020/2021.
It is so bad that even Goldman admits that in terms of a path to profitability, IPOs since 2010 look more like Tech boom IPOs than offerings completed during the 2001-2009 period. During the current cycle, 60% of the 1,192 IPOs completed since 2010 have reported positive quarterly net income within their first three years but that ratio climbed to only 64% after five years. A portion of the below-average share of profitable firms can be attributed to the wave of Biotech offerings. Biotechnology firms have accounted for 14% of IPOs during this cycle and for 28% of 2019 IPOs. None of the Biotech IPOs completed in 2019 YTD is projected to be profitable in years one, two, or three.
SECTOR: Since the late 1990s, the sector with the largest share of the IPO calendar has shifted from Tech, Media, and Telecom (TMT) to Health Care. During the Tech boom, 43% of IPOs were TMT stocks. Since 2010, Health Care has dominated the new issue calendar, accounting for 34% of IPOs (TMT share of 19%).
AGE: The median age between founding and IPO for non-TMT equity offerings has been stable at around 8 years for the past quarter century, including for the class of 2019 IPOs. However, Tech companies have been staying private for longer, which is to be expected with the recent growth of the private market, with the median age of a firm at IPO rising from 3 years in 2001 to 13 years in 2018. Younger firms grow sales at a faster rate than their more experienced peers. This trend has contributed to the lower expected sales growth for recent IPOs compared with the Tech bubble. The median firm founded 0-5 years before IPO reported sales growth of nearly 50% five quarters after the offering compared with 19% for firms older than 15 years. Company age at the time of IPO was not a significant indicator of relative performance during the following three years.
VALUATION: Finally some “good” news: new issue valuations peaked during the Tech bubble. The median IPO completed during 4Q 1999 traded at a relative EV/sales multiple of 7.0x vs. the S&P 500 (13.2x vs. 1.8x) compared with the 25-year median relative multiple of 1.4x. Valuation of the typical 2019 IPO is well below the level of the Tech boom. The median IPO YTD trades at a relative multiple of 2.1x vs. the S&P 500 (5.8x vs. 2.7x). While helpful, that may be cold comfort to “explain” why most of the companies will never turn a dime in profit.
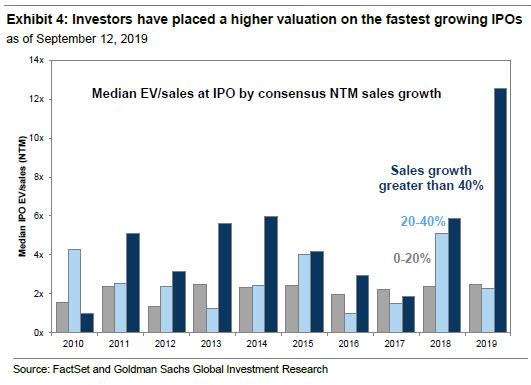
One other notable observation: in a time of growing recession fears, in 2019 investors assigned a greater valuation premium than usual to IPOs with the fastest expected sales growth. 2019 IPOs projected to grow revenues by more than 40% annually during their first twelve months as a public company are valued at EV/sales multiples (12.5x) that are six times greater than those IPOs with slower expected sales growth (2.5x). In other words, the valuation bubble among “fast growing” companies has never been greater.
Tyler Durden
Sun, 09/15/2019 – 20:42
via ZeroHedge News https://ift.tt/2O5GS4b Tyler Durden
