The Myth Of The “Great Cash Hoard” Of 2019
Authored by Lance Roberts via RealInvestmentAdvice.com,
Tell me if you heard this one lately:
“There’s a trillion dollars in cash sitting on the sidelines just waiting to come into the market.”
No.
Well, here it is directly from the Wall Street Journal:
“Assets in money-market funds have grown by $1 trillion over the last three years to their highest level in around a decade, according to Lipper data. A variety of factors are fueling the flows, from higher money-market rates to concerns over the health of the 10-year economic expansion and an aging bull market.
Yet some analysts say the heap of cash shows that investors haven’t grown excessively exuberant despite markets’ double-digit gains this year, and have plenty of money available to buy when lower prices prevail.”
See…there is just tons of “cash on the sidelines” waiting to flow into the market.
Except there isn’t.
The Myth Of Cash On The Sidelines
Despite 10-years of a bull market advance, one of the prevailing myths that seeming will not die is that of “cash on the sidelines.” To wit:
“’Cash always makes me feel good, both having it and seeing it on the sidelines,’ said Michael Farr, president of the money-management firm Farr, Miller & Washington.
Stop it.
This is the age-old excuse why the current “bull market” rally is set to continue into the indefinite future. The ongoing belief is that at any moment investors are suddenly going to empty bank accounts and pour it into the markets. However, the reality is if they haven’t done it by now, following 4-consecutive rounds of Q.E. in the U.S., a 330% advance in the markets, and ongoing global Q.E., exactly what is it going to take?
But here is the other problem.
For every buyer there MUST be someone willing to sell. As noted by Clifford Asness:
“There are no sidelines. Those saying this seem to envision a seller of stocks moving her money to cash and awaiting a chance to return. But they always ignore that this seller sold to somebody, who presumably moved a precisely equal amount of cash off the sidelines.”
Every transaction in the market requires both a buyer and a seller with the only differentiating factor being at what PRICE the transaction occurs. Since this is required for there to be equilibrium in the markets, there can be no “sidelines.”
Think of this dynamic like a football game. Each team must field 11 players despite having over 50 players on the team. If a player comes off the sidelines to replace a player on the field, the player being replaced will join the ranks of the 40 or so other players on the sidelines. At all times there will only be 11 players per team on the field. This holds equally true if teams expand to 100 or even 1000 players.
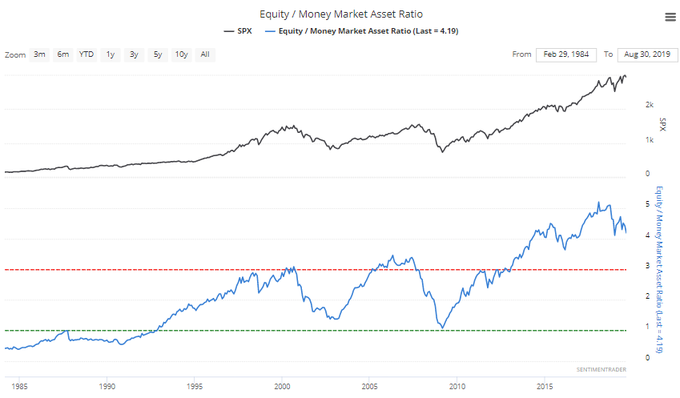
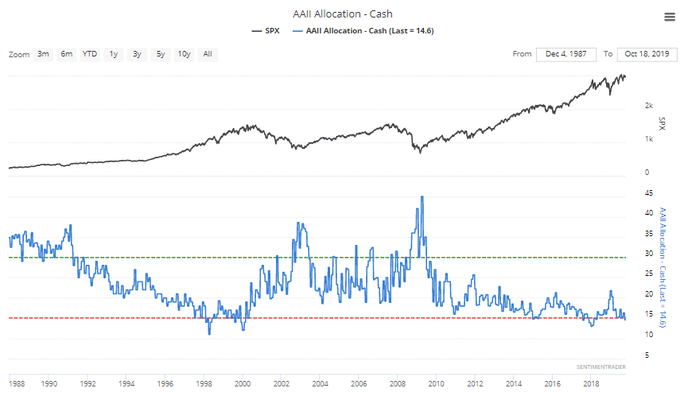
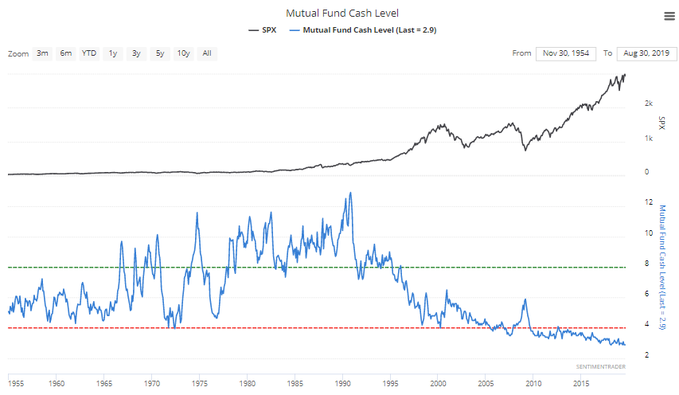
Furthermore, despite this very salient point, a look at the stock-to-cash ratios (cash as a percentage of investment portfolios) also suggest there is very little available buying power for investors currently. As we noted just recently with charts from Sentiment Trader:
“As asset prices have escalated, so have individual’s appetite to chase risk. The herding into equities suggests that investors have thrown caution to the wind.
With cash levels at the lowest level since 1997, and equity allocations near the highest levels since 1999 and 2007, it suggests investors are now functionally “all in.”
With net exposure to equity risk by individuals at historically high levels, it suggests two things:
There is little buying left from individuals to push markets marginally higher, and;
The stock/cash ratio, shown below, is at levels normally coincident with more important market peaks.
But it isn’t just individual investors that are “all in,” but professionals as well.
Importantly, while investors are holding very little ‘cash,’ they have taken on a tremendous amount of ‘risk’ to chase the market. It is worth noting the current levels versus previous market peaks.”
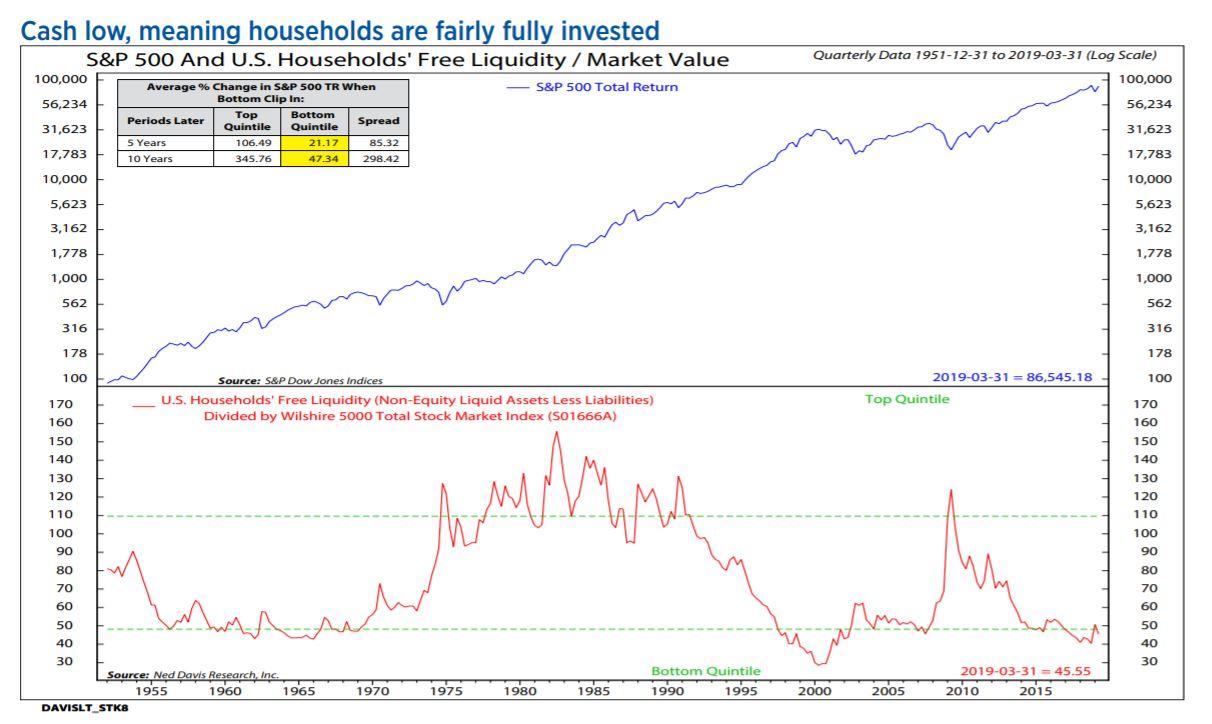
Even Ned Davis noted that investors remain more invested in riskier assets than has historically been the case.
“Cash is low, meaning households are fairly fully invested.”
So, Where Is All This Cash Then?
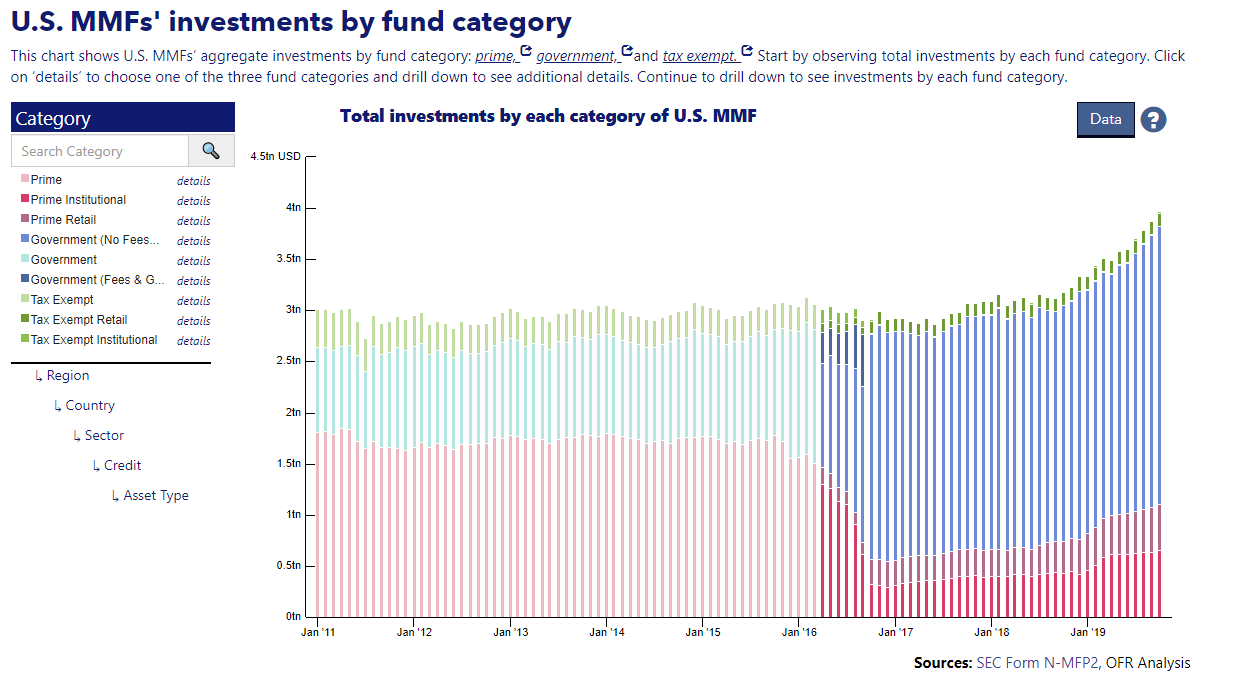
The Wall Street Journal was correct in their statement that money market cash levels have indeed been climbing. The chart from the Office Of Financial Research shows this:
There are a few things we need to consider about money market funds.
-
Just because I have money in a money market account, doesn’t mean I am saving it for investing purposes. It could be an emergency savings account, a down payment for a house, or a vacation fund on which I want to earn a higher rate of interest.
-
Also, money markets are used by corporations to store cash for payroll, capital expenditures, operations, and a variety of other uses not related to investing in the stock market.
-
Foreign entities also store cash in the U.S. for transactions processed in the United States which they may not want to immediately repatriate back into their country of origin.
The list goes on, but you get the idea.
If you take a look at the chart above, you will notice that the bulk of the money is in Government Money Market funds. These particular types of money market funds generally have much higher account minimums (from $100,000 to $1 million) which suggests that these funds are predominately not retail investors. (Those would be the smaller balances of prime retail funds.)
So, where is all that cash likely coming from?
Hoarding Cash
You are already most likely aware that Warren Buffett is hoarding $128 billion in cash, and that Apple is sitting on a cash trove of $100 billion, with Microsoft holding $136.6 billion, and Alphabet amassing $121 billion.
Yes, some of that cash has been used for share buybacks, but much of it is sitting there waiting for acquisitions, R&D, capital expenditures, etc. However, that cash is primarily sitting in short-term and longer-term dated treasuries, AND, you guessed it, money market funds.
However, as noted above, there is also a flood of money coming into U.S. Dollar denominated assets for better yield and safety than what is available elsewhere in the world.
At RIAPRO.NET we regularly track the U.S. Dollar for our subscribers. (You can access these reports with a FREE 30-day Trial.)
-
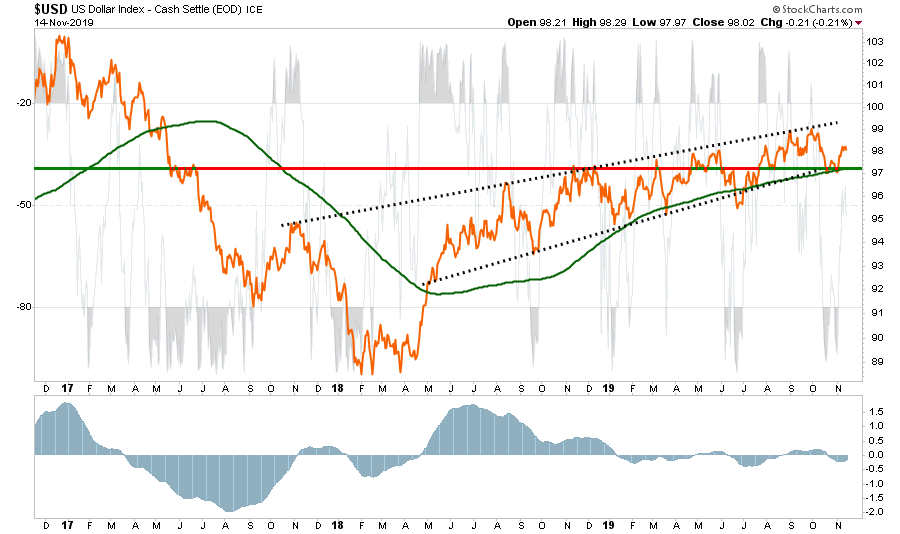
Despite much of the rhetoric to the contrary, the dollar remains in a strongly rising uptrend. Given a “strong dollar” erodes corporate profits on exports (which makes up 40% of corporate profits overall) a strong dollar combined with tariffs isn’t great for corporate bottom lines. Watch earnings carefully during this quarter.
-
Furthermore, the dollar bounced off support of the 200-dma and the bottom of the uptrend. If the dollar rallies back to the top of its trend, which is likely, this will take the wind out of the emerging market, international, and oil plays.
-
The “sell” signal is also turning up. If it triggers a “buy” the dollar will likely accelerate pretty quickly.
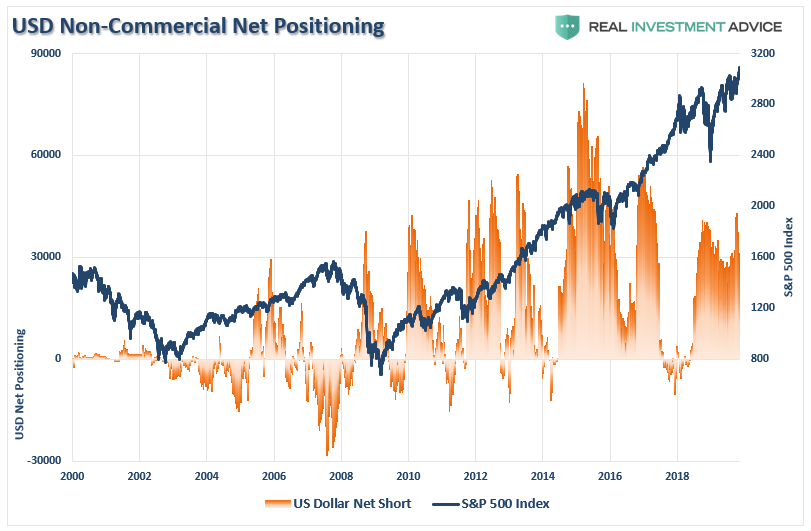
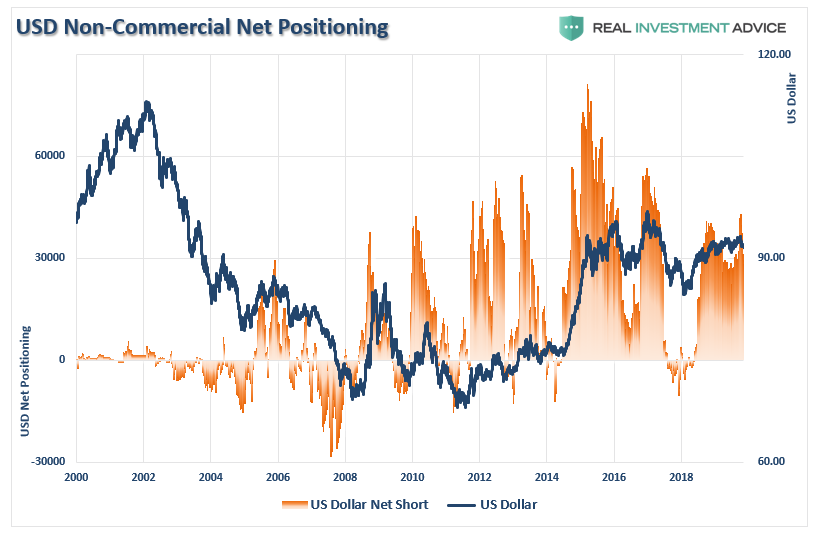
Much of the bulls rallying cry has been based on the dollar weakening with the onset of QE, but as shown above, that has yet to be the case. However, US Dollar positioning has been surging as of late as money has been flowing into US Dollar denominated assets. Importantly, it is worth watching positioning in the dollar as a reversal of dollar-longs are usually reflective of short- to intermediate-term market peaks.
As shown above, and below, such net-long positions have generally marked both a short to intermediate-term peak in the dollar. The bad news is that a stronger dollar will trip up the bulls, and commodities, sooner rather than later.
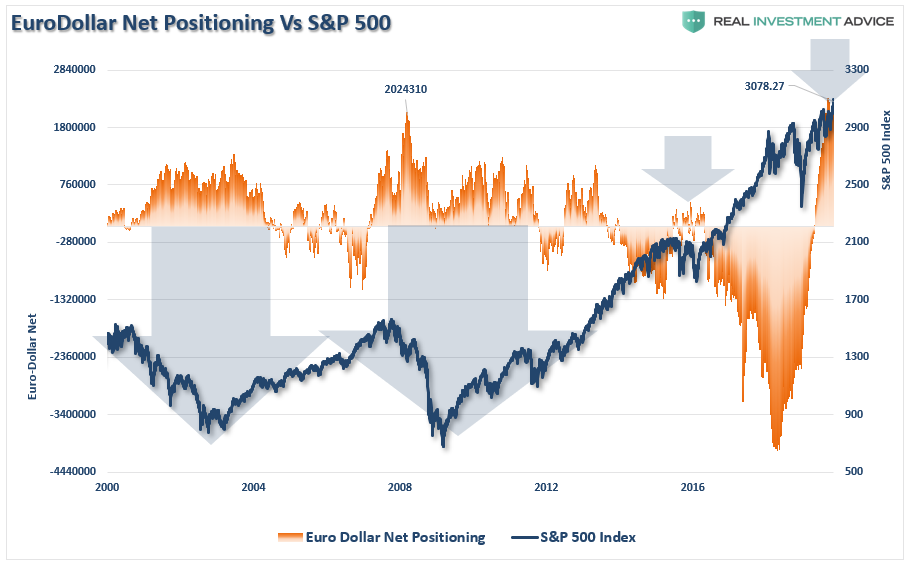
However, as it relates to foreign positioning, it is worth noting that EURO-DOLLAR positioning has been surging over the last 2-years. This surge corresponds with the surge in dollar-denominated money market assets.
What are Euro-dollars? The term Eurodollar refers to U.S. dollar-denominated deposits at foreign banks, or at the overseas branches, of American banks. Net-long Eurodollar positioning is at an all-time record as foreign banks are cramming money into dollar-denominated assets to get away from negative interest rates abroad.
Importantly, when positioning in the Eurodollar becomes NET-LONG, as it is currently, such has been associated with short- to intermediate corrections in the markets, including outright bear markets.
What could cause such a reversal? A pick up of economic growth, a reversal of negative rates, a realization of over-valuation in domestic markets, which starts the decline in asset prices. Then, the virtual spiral begins of assets flowing out, lowers asset prices, leading to more asset outflows.
While the bulls are certainly hoping the “cash hoard” will flow into U.S. equities, the reality may be quite different.
That’s how the bear markets begin.
Slowly at first. Then all of a sudden.
Tyler Durden
Mon, 12/09/2019 – 17:40
via ZeroHedge News https://ift.tt/38pplM3 Tyler Durden
