Visualizing The Global Inequality Gap, And How It’s Changed Over 200 Years
What makes a person healthy, wealthy, and wise? The UN’s Human Development Index (HDI) measures this by one’s life expectancy, average income, and years of education.
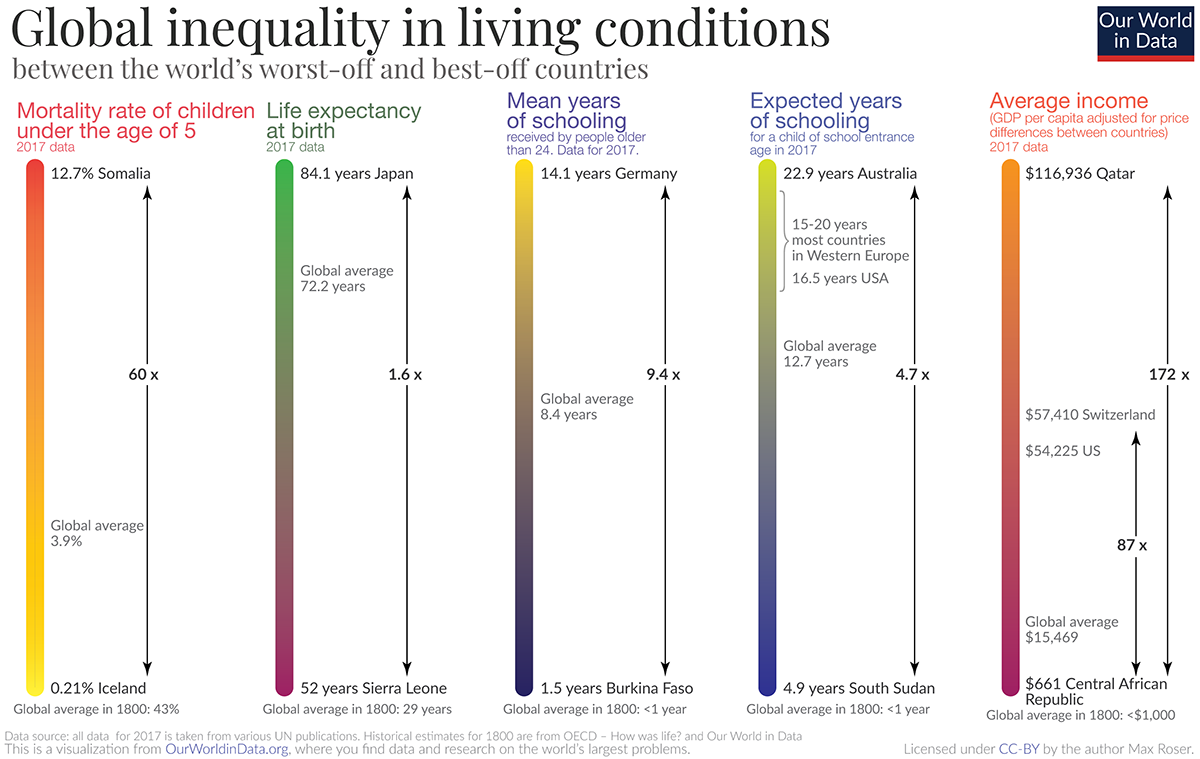
However, as Visual Capitalist’s Iman Ghosh notes, the value of each metric varies greatly depending on where you live. Today’s data visualization from Max Roser at Our World in Data summarizes five basic dimensions of development across countries—and how our average standards of living have evolved since 1800.
Health: Mortality Rates and Life Expectancy
Child mortality rates and life expectancy at birth are telltale signs of a country’s overall standard of living, as they indicate a population’s ability to access healthcare services.
Iceland stood at the top of these ranks in 2017, with only a 0.21% mortality rate for children under five years old. On the other end of the spectrum, Somalia had the highest child mortality rate of 12.7%—over three times the current global average.
While there’s a stark contrast between the best and worst performing countries, it’s clear that even Somalia has made significant strides since 1800. At that time, the global average child mortality rate was a whopping 43%.
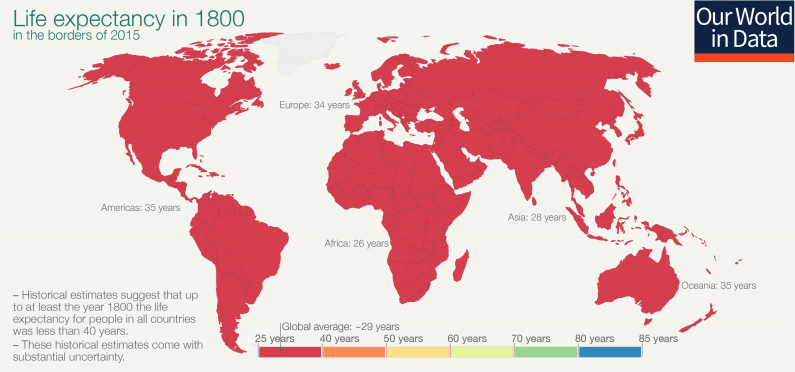
Lower child mortality is also tied to higher life expectancy. In 1800, the average life expectancy was that of today’s millennial—only 29 years old:
Today, the global average has shot up to 72.2 years, with areas like Japan exceeding this benchmark by more than a decade.
Education: Mean and Expected Years of Schooling
Education levels are measured in two distinct ways:
-
Mean years: the average number of years a person aged 25+ receives in their lifetime
-
Expected years: the total years a 2-year old child is likely to spend in school
In the 1800s, the mean and expected years of education were both less than a year—only 78 days to be precise. Low attendance rates occurred because children were expected to work during harvests, or contracted long-term illnesses that kept them at home.
Since then, education levels have drastically improved:
Research shows that investing in education can greatly narrow the inequality gap. Just one additional year of school can:
-
Raise a person’s income by up to 10%
-
Raise average annual GDP growth by 0.37%
-
Reduce the probability of motherhood by 7.3%
-
Reduce the likelihood of child marriage by >5 percentage points
Education has a strong correlation with individual wealth, which cascades into national wealth. Not surprisingly, average income has ballooned significantly in two centuries as well.
Wealth: Average GDP Per Capita
Global inequality levels are the most stark when it comes to GDP per capita. While the U.S. stands at $54,225 per person in 2017, resource-rich Qatar brings in more than double this amount—an immense $116,936 per person.
The global average GDP per capita is $15,469, but inequality heavily skews the bottom end of these values. In the Central African Republic, GDP per capita is only $661 today—similar to the average income two hundred years ago.
A Virtuous Cycle
These measures of development clearly feed into one another. Rising life expectancies are an indication of a society’s growing access to healthcare options. Compounded with more years of education, especially for women, this has had a ripple effect on declining fertility rates, contributing to higher per capita incomes.
People largely agree on what goes into human well-being: life, health, sustenance, prosperity, peace, freedom, safety, knowledge, leisure, happiness… If they have improved over time, that, I submit, is progress.
As technology accelerates the pace of change across these indicators, will the global inequality gap narrow more, or expand even wider?
Tyler Durden
Sun, 12/08/2019 – 23:25
via ZeroHedge News https://ift.tt/2t0KbBt Tyler Durden


