Platts: 5 Commodity Charts To Watch This Week
Via S&P Global Platts Insight blog,
Oil markets are digesting the latest OPEC announcement on production cuts this week, while regional LNG prices converge and nickel continues on a bearish streak, in S&P Global Platts editors’ pick of energy and commodity trends.
1. OPEC, allies agree to new oil output cuts at eleventh hour
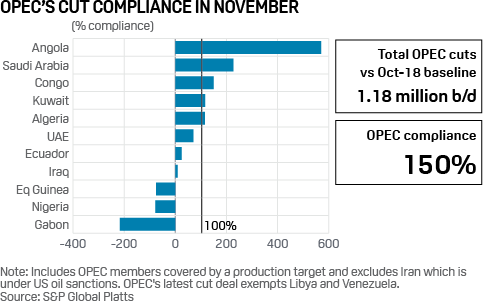
What’s happening? OPEC, Russia and nine other allies delivered a new production cut deal November 6, just hours after it appeared their pact was close to unravelling. OPEC+ will deepen collective output cuts by 503,000 b/d to 1.7 million b/d from January through March, with Saudi Arabia voluntarily slashing another 400,000 b/d of production beyond its new quota. “We already believed market fundamentals warrant $66/b Brent in January, even assuming the existing agreement simply rolled over through end-2020,” said S&P Global Platts Analytics following the decision. “Needless to say, a lower supply forecast provides more support.”
What’s next? The coalition’s inability to agree on extending the deeper cuts beyond March sets the stage for another potentially tough meeting three months from now. OPEC members Iraq and Nigeria have been serial violators of their quotas, and Russia has also had patchy compliance, though its condensate exemption should help it improve its performance. Whether these producers deliver could be pivotal to the current deal and the pact’s ability to bring down oil stocks in a period of weak demand.
2. Nickel continues to slide as supply concerns recede
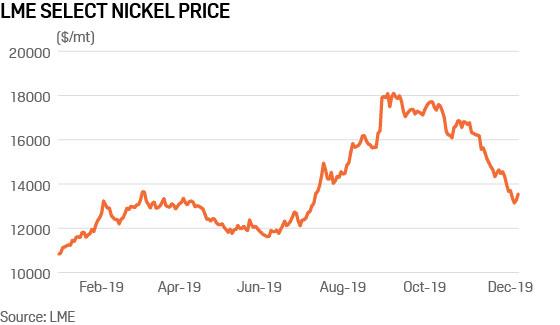
What’s happening? The nickel price has been riding high throughout 2019, on supply fears related to an export ban from the world’s number one producing nation Indonesia. It was detached from other base metals, which suffered from the US/China trade spate. Nickel hit a high of $18,850/mt in September. However, the ban suddenly seemed to be less of a concern than poor demand, and the price rapidly corrected, reaching a low of $13,115/mt, December 4. It seems the metal was a target for the old trading tactic, “buy the rumour, sell the fact.”
What’s next? With the price now trading in a range of $13,000-$14,000/mt, and year-end on the horizon, it is doubtful there will be any return to stellar form for nickel in 2019. Physical traders seem to be neutral on the metal, with no new bookings being fielded even with the price crash. Eyes will be on what Indonesia actually does in 2019, what it means for supply and how bad demand really is from the stainless steel sector.
3. As regional hub prices converge, Europe attracts US LNG
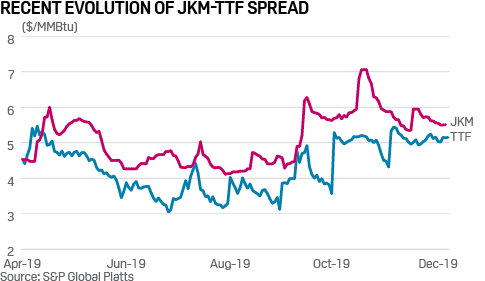
What’s happening? The JKM-TTF spread has narrowed again, making Europe a more attractive destination for US LNG amid subdued Asian demand. About half of the cargoes that were delivered last month from US LNG export facilities landed in Europe, reflecting a shift in trade flows that appears to favor proximity, liquidity, and the ability to hedge, over traditionally more robust end-user markets in Asia.
What’s next? That Europe has become a home for US LNG beyond just a means to balance the global supply market has taken on added importance amid the ongoing trade dispute between Washington and Beijing. A continued wave of US LNG coming to European shores could help keep a lid on European gas prices through the winter.
4. Nordic hydro concerns ease in a bearish European power market
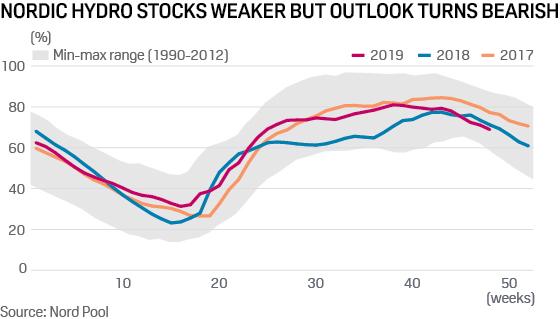
What’s happening? German and French generation tend to set European power prices, but Nordic hydro can be a big winter swing factor too. A few colder, drier weeks in Norway have taken stocks down below norms, with the hydro “deficit” put at over 10 TWh. Nordic hydro matters: peak regional stocks of over 100 TWh equate to all coal generation in Germany to end-September this year, while annual inflow in Norway alone can vary by 65 TWh.
What’s next? A material change in the Nordic weather forecast looks set to reverse the recent above-average decline in stocks. Milder, windier conditions could see net outflows decrease on reduced demand and strong wind production. Nordic spot prices are trending down below Eur40/MWh, having been over Eur45/MWh in late November.
5. US refinery restarts put pressure on gasoline crack spreads
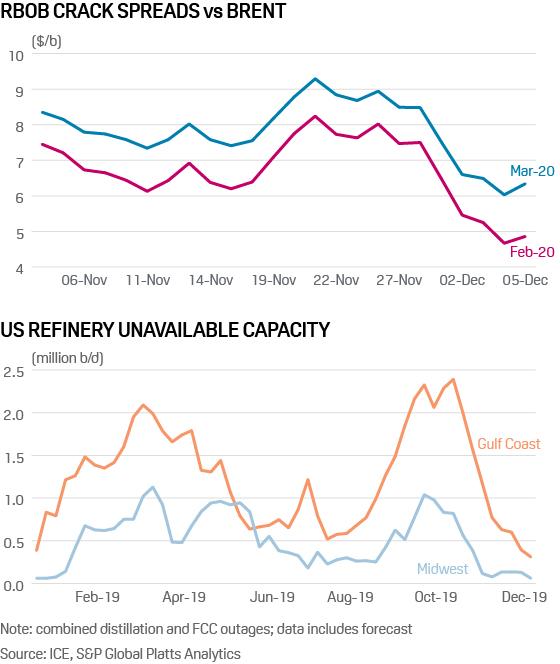
What’s happening? Crack spreads for NYMEX RBOB, an indicator of profitability for gasoline production, have weakened since late November, as the return of refineries from fall maintenance is adding barrels of gasoline to storage. The RBOB crack spreads for February 2020 against ICE Brent ended Thursday at around $4.86/b, down $3.16/b on week. The decline followed a surprisingly large US gasoline stock build. Stocks rose by 12 million barrels between the first and last week of November, based on US Energy Information Administration data. US refiners are restarting after maintenance season. At its peak, the week ended October 11, a combined 3.36 million b/d of distillation and FCC capacity was down in the US Gulf Coast and Midwest, according to S&P Global Platts Analytics.
What’s next? By end-November, outages had fallen to 847,000 b/d, and by end-December they are expected to decline to just 372,000 b/d. Refineries are also returning from maintenance in Europe and parts of Asia, which should add to global gasoline supplies in December.
Tyler Durden
Mon, 12/09/2019 – 22:20
via ZeroHedge News https://ift.tt/2P5XxVx Tyler Durden
