There Is Only One Thing That Can Close The “The Widest In History” Profits Gap
Earlier this week, we asked a question whose answer in 2020 may finally spell the end of the record-long bull market: “Is It Possible That S&P 500 Companies Make Money And No One Else Does?” The question – and answer – will become especially relevant in a year in which both the US-China trade deal and central bank market intervention are no longer front and center and fundamentals matter once more (if only briefly, until there is a 5%-10% drop, and the Fed launches NIRP/QE5).
The issue boils down to the following: according to the Bureau of Economic Analysis (BEA), in Q3 2019 the annualized after-tax operating profits of all US companies, large and small, public and private, was well below the level of after-tax operating profits recorded in 2015. Over the same 4-year period, after-tax operating profits for S&P 500 companies increased from $885 billion to an annualized rate of $1.327 trillion in the third quarter of 2019, an increase of $442 billion. The key takeaway is that over the past 4 years S&P 500 companies after-tax profits increased 50%, while the earnings of everyone else recorded a decline of roughly 30%.
Visually this is represented as follows:
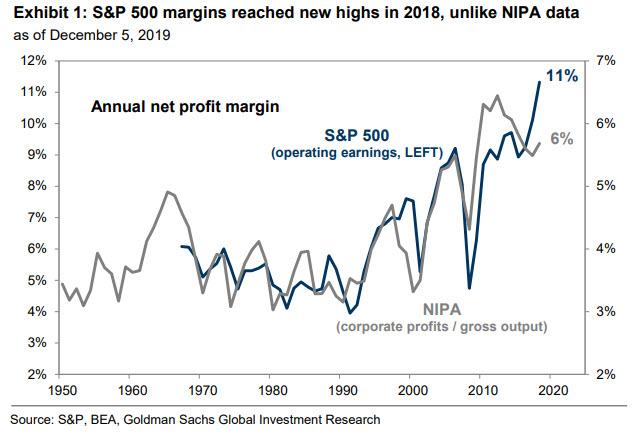
Incidentally, this wasn’t the first time we noted the record divergence between NIPA and S&P profits: at the end of November, we wrote that “Real Corporate Profits Are Now The Lowest Since The Financial Crisis” even as adjusted S&P profits are at an all time high.
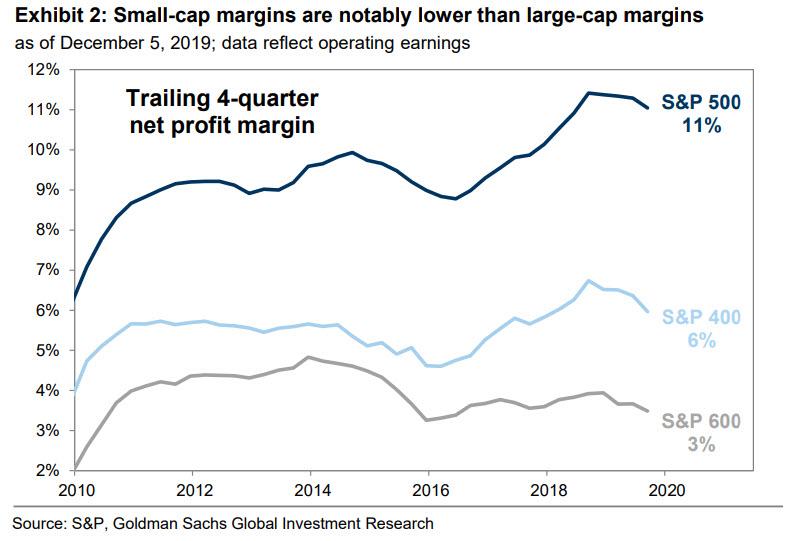
A few days later, none other than Goldman responded with a rather benign “explanation”, stating that whereas this divergence is indeed accurate, it is largely due to the outsized influence of megacap tech companies, or “superstar” names which have larger weights in the S&P500, and whose record high profits serve to offset the decline for everyone else.
To Goldman this wasn’t a major risk as the bank said there is nothing in the near future that suggests tech company profits could soon be adversely impacted, and even if they are, Tech multiples would continue to expand (which however is almost entirely a function of record buybacks).
Needless to say, we disagreed.
Now, another bank has picked up on what we first discussed almost a month ago, and has provided several interesting perspectives on the issue.
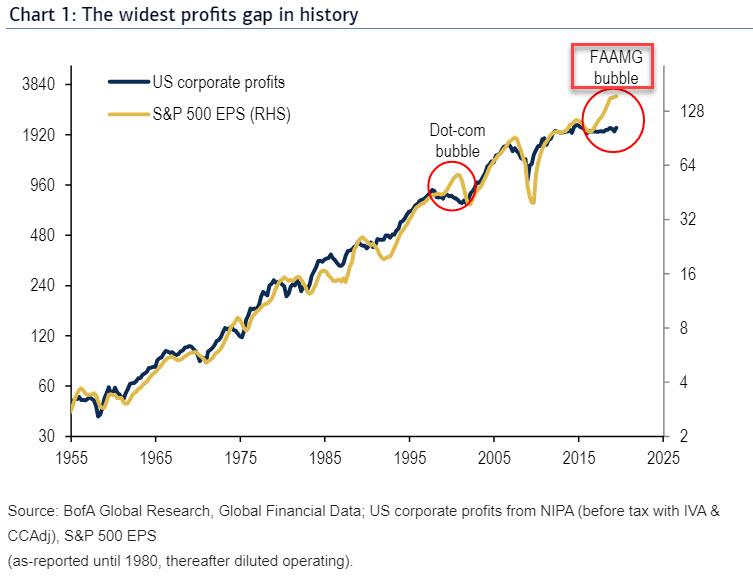
In a note written by Bank of America’s Research Investment Committee earlier this week, the bank published a chart in which for the first time a “respected” establishment institution has pointed out what is has been obvious to all for years: the FAANG names are in a bubble, as shown below:
Yet while we appreciate BofA’s Freudian Slip – we are confident that someone in compliance will lose their job for the glaring oversight of telling the truth – what we found more remarkable is that BofA confirmed verbatim what we said earlier this week, and referring to the chart above, stated that “today we see the greatest profits divergence in US history” adding that “over the past 5 years, corporate profits across the whole US economy have been flat, while the largest companies have seen EPS surge 38%.”
This is a problem for the following reason: whereas in 2018, the Fed hiked 100bps, global EPS grew 8%, and global equities fell 11%, in 2019, the Fed cut 75bps, EPS grew 1%, and equities rose 20%. In short, for the past two years fundamentals did not matter; only monetary policy did.
Looking ahead, in 2020, BofA Global Research expects no Fed hikes, 5% global EPS growth, and for global equities to rise 7%. While the bearish positioning in 2019 meant markets climbed a wall of worry, with sentiment now neutral, 2020 upside needs a profits rebound.
BofA next provides a benign explanation of how this is possible, and gives five reasons why the record profit spread would close to the upside, to wit:
- Trade peace & capex rebound: the US/China “skinny” trade deal may do nothing for the long term (import substitution, espionage, forced tech transfers…) but everything for short-term planning, and capex is the area with the most upside risk.
- Inventory restocking: early-stage consumable inventories are also very low which is bullish for cyclicals, also note Dalian iron ore +17% in past 4 weeks; rising new orders across major economies to confirm the global PMI inflection.
- The Frozen Fed boosts housing & consumption: the last three US expansions ended with the Fed hiking to throttle wage growth, but in 2020 BofA expects no hikes despite rising wages. Meanwhile, the mortgage refi boom is on pace to 6yr highs with room to run as household debt ratios are at 18yr lows; Separately, Powell, Brainard, Kashkari (& Wozniak) want to induce structural change via hot labor markets, benefiting groups that have historically been “left behind”
- Global central banks are not dead yet: 51 rate cuts over the past 6 months = the most since the GFC and $0.7tn of G4 QE expected in 2020…all very bullish for risky assets.
- Fiscal surprise: the US administration has already prioritized a push for middle- & low-income tax cuts in 2020 if needed; is near completion of paid family leave for 2.1mn federal workers; and can add new infrastructure spending to individual highway, water etc. renewal bills instead of a big, loud package.
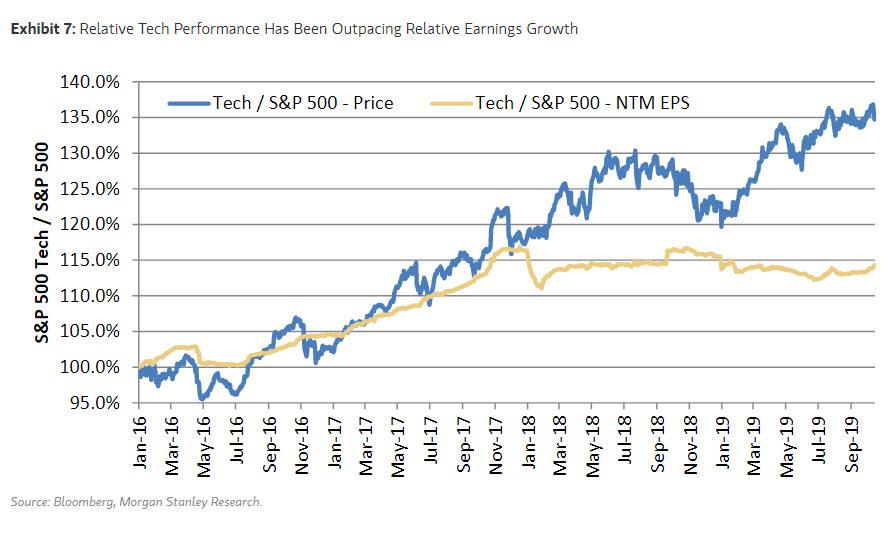
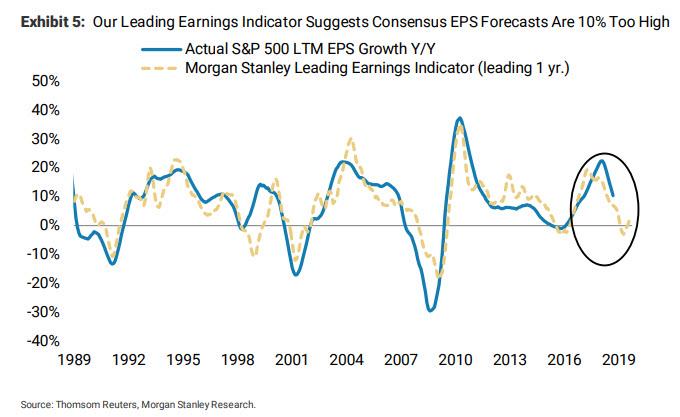
While we could refute each of these arguments point by point, we will instead that to Morgan Stanley who did a far better job than us of explaining why corporate profits – even for S&P 500 companies – will be lower, resulting in the first full earnings recession.
So if NIPA earnings can’t catch up to the S&P from the bottom, what is the alternative? According to BofA, it is a simple, one-word answer: recession.
But before we dig in, here are the three factors which, according to BofA, are often cited to explain the record profits gap:
- Buybacks: corporates have been the only big buyer of US equities since the Global Financial Crisis; but buybacks cannot be key factor, since the gap persists when we replace EPS with net income;
- Accounting: in an age of “community-adjusted EBITDA” it is tempting to blame creative bookkeeping by firms with incurious owners, though again the gap persists on a GAAP basis, and rules are stricter now than in the dot-com bubble;
- Composition: the best explanation comes from the difference between all tax filers of all sizes (law firms & laundromats) vs. large companies dominated by tech & e-commerce.
Whatever the causes, BofA correctly observes that “the gap is troubling”, and adds that “the most important question is how it will close.” And since MS already debunked the positive spin, i.e., how profits can ramp up higher into the next year, we will focus solely on the one factor that will push S&P earnings to catch down to NIPA profits…
A recession.
As Bank of America writes, the gap can close “down” via a War on (profits) Inequality, in which the losing sectors from secular stagnation (energy, industrials, materials, financials) ally with middle- and low-income households to bring deflation “winners” (tech & healthcare) to heel via redistributive policies, e.g. Medicare 4 All, Occupy Silicon Valley, and a ban on buybacks.
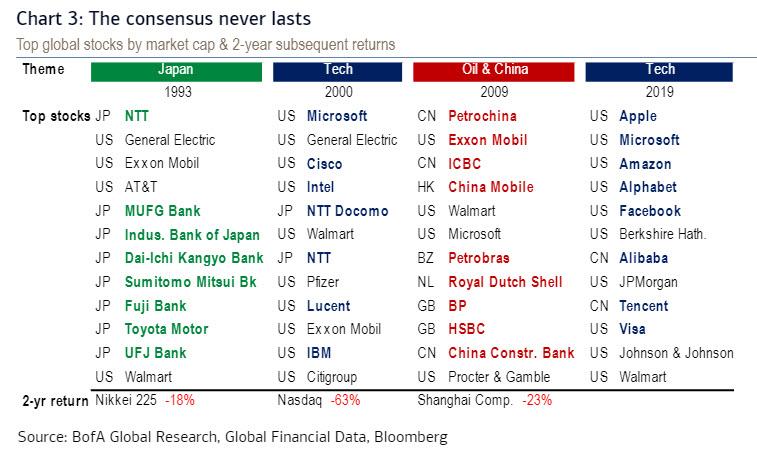
The rise and rise of tech is a clear symptom of a slowing economy; tech & e-commerce now account for nearly a third of all US profits. This at a time when tech remains the least regulated part of the US economy…manufacturing faces 215k regulations vs. just 27k for tech. Recent conversations with policymakers confirm the bipartisan push to regulate tech is not going away. And, as BofA, adds history shows consensus views about sector/country “dominance” never last: prior bubbles in Japan, dot-com, & oil/China ended promptly in bear markets, while the 2019 consensus has been about tech supremacy once again.
Meamwhile, A resilient bipartisan consensus has also formed to reduce incentives for share repurchases. Whatever the merits, it is true that without corporate buybacks, 2019 would have likely seen a US profits recession:
- In the past 2 years US companies spent $114 on buybacks for every $100 of capex (vs. just $60 for every $100 of capex in the prior 19 years);
- Over the last 5 years, 92% of S&P 500 companies have reported quarterly EPS growth despite falling net income on at least one occasion…impressive.
Putting it together, once S&P profits converge to the NIPA downside, based on their historical relationship a reversion lower in S&P 500 EPS to the “whole-economy” profits trend implies 30% downside, from $177 to $124, a drop that is “certainly enough to spark layoffs and a recession.“
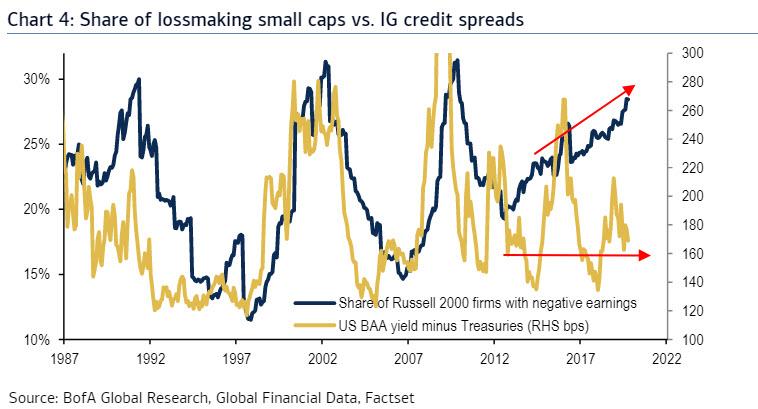
How to trade this outcome? According to Bofa, one should buy the “sunlight” via quality in equities (Best of Breed), credit (AA corporates & munis), & duration (2-year Treasuries); sell the “shadows” e.g. illiquid shadow banks (private equity/VC), poor governance (firms w/ non-voting shares), credit junk & buyback bandits. Meanwhile, a decade of monetary easing ($12tn CB asset purchases & 784 rate cuts) delivered tight credit spreads but not broad growth, with the lossmaking share of more cyclically-sensitive Russell 2000 firms now just 3ppt from record highs. Based on their long-term relationship, small-caps imply crisis-like BBB spreads well above 250bps.
And while it is certainly our view that a profit and economic recession is now unavoidable, BofA also has several Plan B trade ideas – and suggestions which key items to watch for – in case we do in fact see a miraculous surge in profits next year: if the growth-to-value false starts in 2019 portend “the big one” in 2020, investors know what do; buy cyclicals, value, small caps & real assets, including e.g. banks, energy, industrials, leveraged loans & HY bonds.
Finally, for confirmation the recession can be avoided again, “watch WTI > $65, SOX >1800, BKX > 117, US B HY <350bps (H0A2).“
Tyler Durden
Fri, 12/13/2019 – 07:57
via ZeroHedge News https://ift.tt/2PEVPti Tyler Durden
