Females & Births, As Rudimentary As We Can Get
Authored by Chris Hamilton via Econimica blog,
First, chart of the century…literally. For those engrossed in the current and engulfing repo fiasco, QE, and monetization…it is helpful to pull back and clarify what it is that is causing the existing economic and financial system to fail?
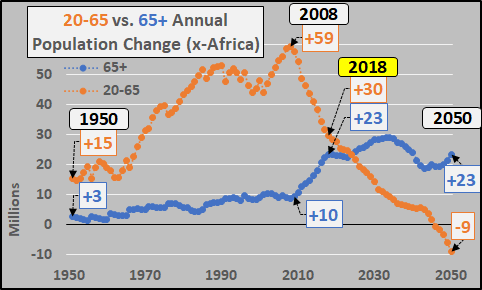
It was, is, and will be a Ponzi to its last day and Ponzi’s fail for lack of new suckers. In this case, those willing and able to undertake new credit (debt) that enlarges the money supply in our fractional reserve system. The chart below shows the global annual growth of the 20 to 65 year-olds versus 65+ year-olds (both excluding Africa). 20 to 65 year-olds world over utilize credit (debt) while 65+ year-olds extinguish debt (deleverage).
So long as the growth of those levering up outstripped those deleveraging, the system could continue. But as you’ll note, in 2008, the entire global system shuddered as accelerating growth of potential workers ceased and began decelerating…while the growth of non-workers accelerated.
By about 2024, the annual growth of non-workers (deleveragers) will overtake annual growth of potential workers (debtors). Those rapidly extinguishing debt in old age will outnumber those undertaking the new debt. Those in retirement or in death offloading assets will outnumber those buying those assets.
The non-technical name for this is a “shit-show” and this is why central banks, federal governments, and ultra wealthy are aligning ever tighter to save themselves.
This was never going to work…but that doesn’t mean everybody has to lose. And the ever tightening circle of winners are attempting to lock in their gains at the expense of the vast majorities losses. QE is the salve for inadequate credit and money growth due to decelerating population growth among young versus accelerating population growth among elderly. The forces of elderly deflation are outstripping the inflationary forces of growth among the young.
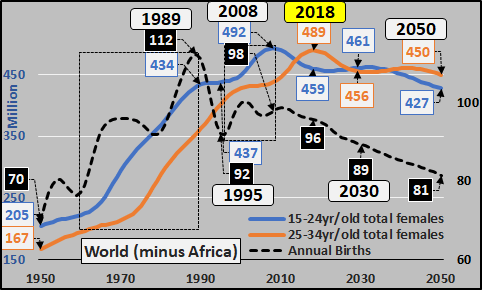
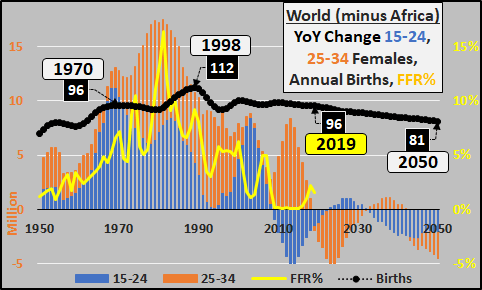
Whether you agree, disagree, or are still pondering…the charts below show the global population of 15 to 24 year-old and 25 to 34 year-old potential childbearing females (excluding Africa) and total annual births (excluding Africa), dashed lines. Why exclude Africa? As a continent, Africa consumes just 3% of global energy, imports about the same in finished goods, and generally consume so little as to be a rounding error…but they are the bulk of population growth. However, Africa provides a very low level of emigration compared to Mexico, India, and the rest of the world. The geographic barriers from sub-Saharan Africa (where the vast majority of high fertility nations exist) and extreme levels of poverty have constrained emigration thus far.
So, when the global population growth among 15 to 24 year-old females (x-Africa, blue line) simply stalled from 1989 through 1995 and annual births declined by 20 million (black dashed lines), there may have been good reason to pay a little closer attention. When the final impetus of 15 to 24 population growth concluded in 2008 and the echo rise in births likewise concluded, even closer attention should have been warranted. Since 2008, the final piece of demographic energy came through the 25 to 34 year-old population (brown line) and peaked in 2018. Now, from a childbearing standpoint, it is all downhill indefinitely. By 2050, the 15 to 24 female population will decline by another 32 million while the 25 to 34 female population will fall by 39 million. The UN projects births (x-Africa) will slowly and steadily decline as the childbearing population is in decline. Something far more dramatic is more likely.
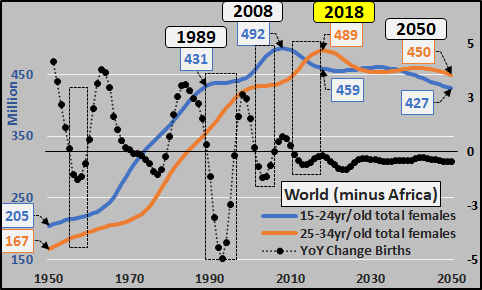
The chart below flips the births (black line) from total annual to year over year change, against total female 15-24 (blue) and 25-34 (brown) female populations. The 18% deceleration in births from ’89 to ’95 coincided with low childbearing growth after decades of high growth. What comes now as the entire female childbearing population begins declining is likely an asymmetrical decline. The lack of growth coupled with the accessibility of birth control is likely to lead to a birth dearth unlike anything the world has previously seen. A species choosing not to reproduce for a myriad of reasons.
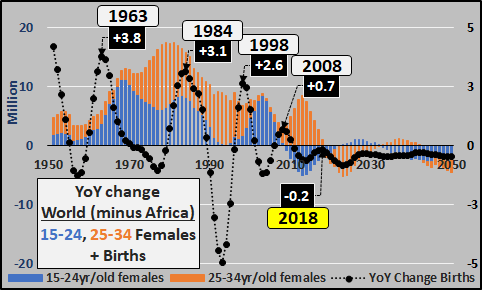
Next, the global (x-Africa) year over year changes in both the childbearing populations and the year over year change in births. The decelerating growth of females of childbearing age is plain enough and the large gyrations in births a confluence of population change, war, economic policies, birth control, etc.
And just in case the shape of the annual change in the global childbearing population (x-Africa) looks familiar (as it is the foundation of demand growth and inflation), I add the Federal Funds rate (yellow line)…plus the impact upon annual births. As an aside, strangely, from 1950 to 1981 as global demand growth was accelerating, the Federal Reserve chose to restrict the availability of money by raising rates thus choking the creation of new capacity to meet the rising demand?!? This was highly inflationary. And then, on decelerating demand growth from 1981 to 2019, the Federal Reserve has made money more available, creating over-capacity and deflation!?! Now as demand begins to outright decline, the return of ZIRP and likely NIRP inflating asset prices and costs of living far faster than incomes, further reducing demand and births. Honest mistake or has the Fed long held yet another unstated mandate?
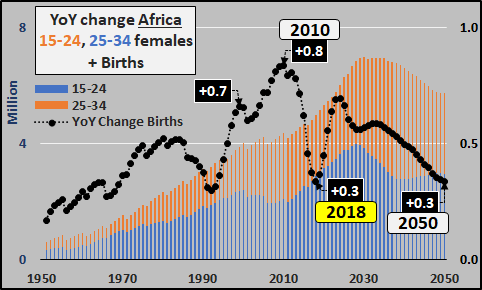
Year over year change in childbearing and births in Africa. Is the strong deceleration in the growth of births in Africa from 2010 through 2018 an aberration or has something more significant begun? Getting accurate and real time data from Africa can’t be easy so I won’t overreact or suggest a major change is underway. I can only surmise it is possible that slowing first world activity is potentially trickling down upon African’s determination to have more children and if this data is correct and sustained…the last bastion of population growth would go poof!?!
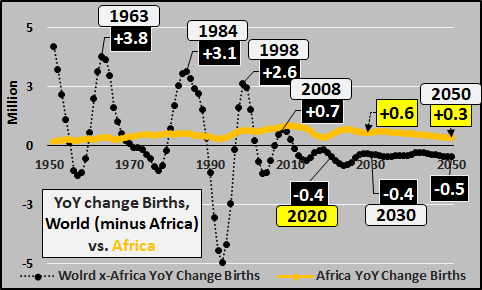
Viewing historical and projected year over year changes in births of the world (excluding Africa, black line) versus Africa (yellow line). The declining births and resultant declining demand represented by the world will surely impact Africa and result in a far lower growth path (or no growth?) than presently projected by the UN. So many of the global economic and environmental models presuming ten or eleven billion persons on earth with far more consuming at “middle class” levels are garbage. An entirely alternate reality of massive over-supply and over-capacity against fast falling demand is so much more realistic.
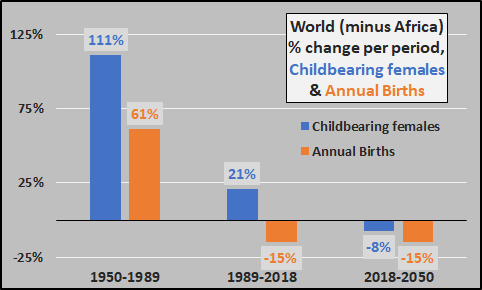
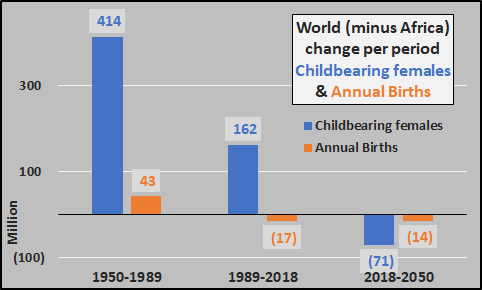
A quick look at the change per period of 15 to 35 year old females (x-Africa) versus the change in annual births (x-Africa). From 1950 through 1989, the childbearing female population rose by 111% and annual births by 61%…from 1989 through 2018, the childbearing female population rose by 21% but annual births fell 15%. The UN projection from 2018 through 2050 is an 8% decline in females of childbearing age while births implausibly “only” fall 15%. Magnitudes greater decline is far more realistic.
Next, same as above in terms of change in millions. A projected decline of 71 million females of childbearing age is likely to result in a far greater decline than presently suggested.
As a point of reference, I am using data from the UN World Population Prospects 2019, released in June of 2019. This is important because it means that 2018 is the last year of actual observed inputs versus projections and assumptions thereafter. For the 15 to 34 year old female population, the UN has a long runway to simply advance an existing population forward. But projecting births forward is trickier. Large global fluctuations have been more the norm than the exception.
For the truly curious, I chart out the childbearing female populations and births, by region, from 1950 through 2050. Like real estate, while the global trends are clear, they vary widely by region. The first chart for each region is total 15 to 24 year-old and 25 to 34 year-old females versus total annual births. Second chart is the year over year change in both childbearing females and births. Knowledge is power.
Western Asia (Middle East)
Azerbaijan, Bahrain, Cyprus, Georgia, Iraq, Israel, Jordan, Kuwait, Lebanon, Oman, Qatar, Saudi Arabia, Palestine, Syria, Turkey, UAE, Yemen. Although presently in a decade long lull in growth among the childbearing, there is still some demographic energy yet to come. Still, UN projects no further growth in births.
Year over year changes. Again, like Africa, hard to know if the declines seen since 2008 are real and sustained…but highly noteworthy as nothing like this has been seen since WWII. Of course, the UN projections assume this is an aberration and return their projections back to “normal”.
Stans
(Kazakhstan, Kyrgyzstan, Tajikistan, Turkmenistan, Uzbekistan). Rising childbearing populations and declining births in the short term, flat to slightly up through the mid century.
The Stans are in the midst of declining childbearing and declining births last seen around the break-up of the Soviet Union. Still, some demographic juice yet to come through that may temper the declining births.
South Asia
(Afghanistan, Bangladesh, India, Iran, Nepal/Bhutan, Pakistan, Sri Lanka). The most populous region of the world has rolled over and a far more significant decline in births than the UN projects is likely over the upcoming decades.On a year over year basis, India (et al) are witnessing the decelerating growth among females of childbearing age and the impact of little growth among the childbearing and ongoing declining fertility rates is likely to see a far faster decline in births than the UN suggests through 2050.
East Asia
(China, Japan, S/N Korea, Taiwan, Mongolia).
-
China’s female childbearing population has fallen 25 million since 1989 and births down over 50% (-16 million) and yet far larger declines in those capable of childbirth are still upcoming and ongoing. Those willing to engage in childbirth seems to be falling even faster, as the aftermath of the 2016 “two-child” fiasco highlights. The female childbearing population will decline by another 50 million by 2050 and fertility rates are likely to go even lower. Unlike the UN projection below, annual births below 10 million are likely in the near term…and how much further it goes from there is the question. What will a country with 50 million unoccupied units of housing do as their population continues collapsing from the bottom-up (rhetorical question, Chinese government will be the buyer of everything eventually).
With Chinese childbearing population and fertility rates tanking, significantly greater declines in births are nearly a sure thing than projected by the UN.
- Japan, patient zero in depopulation, has been watching their annual births collapse since 1950, down over 60% from peak births, and resultant childbearing population decline for fifty years now, down almost 40%. There really is nothing to stop or even slow the decline as this daisy-chain continues. An honest question to pose at this point is, when do we start to consider the likelihood that Japan as a state and society is in true peril of going into terminal decline or are we already passed that point?
Looking at Japan on a year over year basis, it is easy to see there is only further declines among the childbearing and the UN projected mild declines in birth through 2050 aren’t credible. A far more realistic viewpoint would be births tumbling below a half million within the next decade…and a more pessimistic viewpoint puts Japan’s future as a functioning nation entirely in question.
- South Korea, like Japan…but much worse. South Korea is in population freefall with births down almost 70% since the 1960 peak and the childbearing population down almost 30% from the late 1980’s peak. But the declines are just getting warmed up and the UN projection of flattish births against collapsing females of childbearing age is just silly. An unbelievable but more realistic scenario will put births down half again from here over the next decade and children in South Korea will be nearing endangered species status?!?
Below, South Korea on a year over year basis, and the upcoming large declines in females of childbearing age are hard to miss, but strangely, the resultant decline in births through the mid-century aren’t depicted by the UN. Perhaps the economic, national, and societal implications are too serious to depict?
South East Asia
(Cambodia, Indonesia, Laos, Malaysia, Myanmar, Philippines, Singapore, Thailand, Vietnam). Annual births peaked here in 1985 and have flatlined for three decades, but now the flatline is coming through the childbearing population and resultant declining births are projected…the only question will be how large the declines will be?
S.E. Asia year over year, below. Why this time is different isn’t hard to see as the demographic momentum flips from growth to decline.
Central America
Like South and South East Asia, Central America’s births have long been flat…so long that now the childbearing population is likewise flat. How steep the resultant decline in births will be is the trillion dollar question.
Year over year change in Central America, below. The historic deceleration and projected declines are very clear.
South America
South America’s population is more mature and the declines are already well underway.
Year over year changes in S. America below…the demographic deceleration is over and now come the outright declines.
Western Europe
(Europe minus East Europe). Births peaked five and half decades ago and have fallen by 1/3 since. The childbearing population peaked in the mid ’80’s and has fallen by a quarter. There is nothing but more of the same in the future.
Western Europe year over year, below. Despite all the immigration, really no demographic light out there. Persistent declines in the childbearing population and likely even greater declining births than projected by the UN below.
East Europe
(Belarus, Bulgaria, Czechia, Hungary, Poland, Moldova, Romania, Russia, Slovakia, Ukraine). The impact of the Soviet Union break-up is still pre-eminent in this part of the world but the in the aftermath of the GFC coupled with a significant decline in the childbearing, a similar decline in births is likely beyond the rather minor decline projected by the UN.
The year over year view of Eastern Europe, below. The major impact of the declining childbearing population through the next decade is evident.
Canada / Australia / New Zealand
The combined Canadian, Australian, New Zealand childbearing and births are among the more demographically positive. Some further growth is likely despite negative fertility rates, based on growing childbearing populations thanks to ongoing immigration.
The days of heady growth are gone, but some demographic growth likely remains.
United States
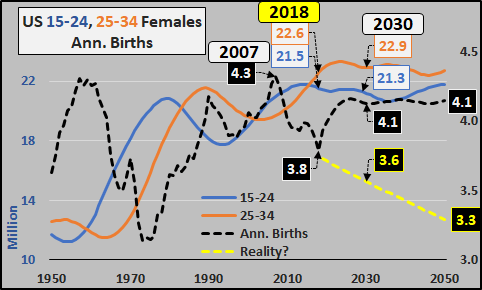
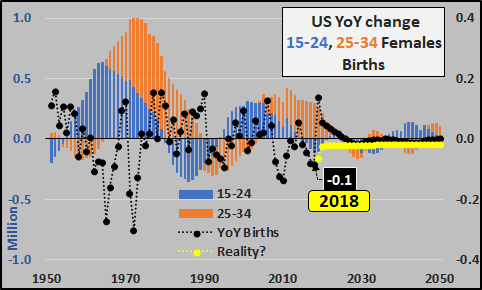
As for the US, the days of a growing childbearing population are done and thanks to ongoing immigration, a flat childbearing population is likely to persist. However, with ongoing declining fertility rates, declining births are far more likely than the strange UN projection of an imminent birth burst. This is the same burst that the Census and UN have been projecting since 2008 while births continue moving in exactly the opposite direction. My best guess for births is the continued path of decline, in dashed yellow below.
Year over year, two different views…one based on observation and one based on theory.
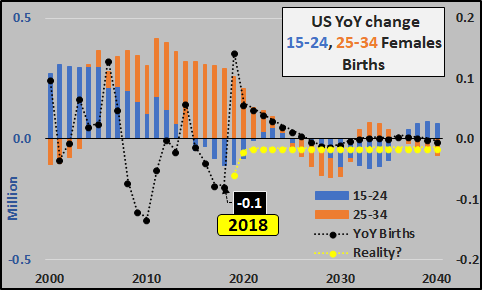
Finally, a close up of annual change in US childbearing and births from 2000 through 2040…and the difference between the UN and my projection from 2020 through 2040, about 12 million fewer births. But in truth, my best guestimate could be far too optimistic as 2019 is likely to see a new record low in births, according to CDC data through 2019 Q2.
Knowledge is power.
Tyler Durden
Wed, 12/18/2019 – 19:45
via ZeroHedge News https://ift.tt/36Q6BnE Tyler Durden
