“The Other 1 Percent”: Morgan Stanley Spots A Market Ratio That Is “Unprecedented Even During The Tech Bubble”
Authored by Morgan Stanley’s chief equity strategist, Michael Wilson
The Other 1 Percenters
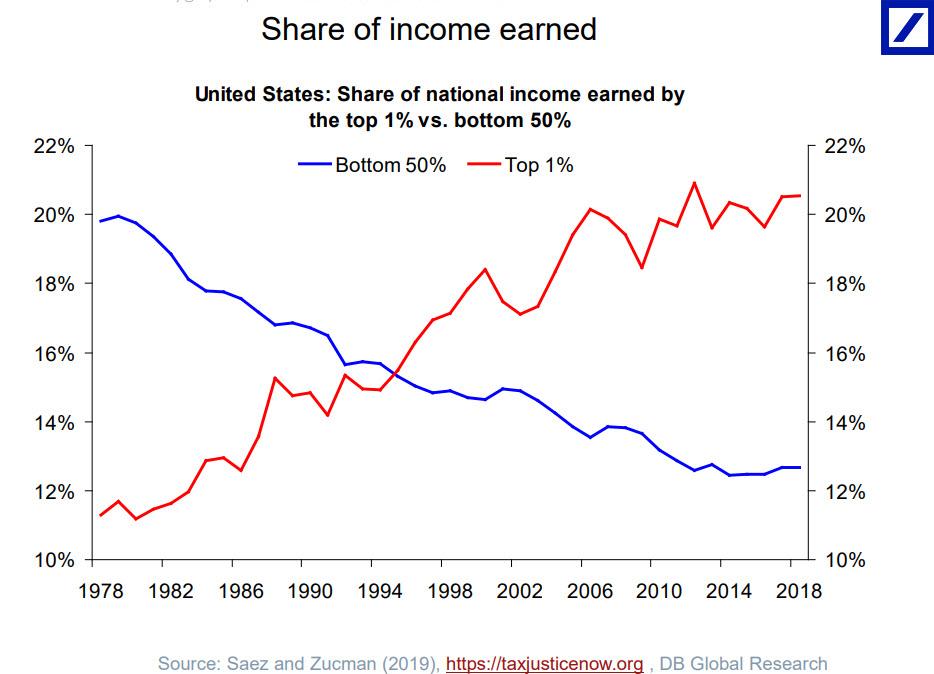
Income inequality has become a hot topic. The top 20% has done exceptionally well over the past several decades, while the average American has not kept pace. Though this is a political issue, it’s also an economic one. As legend has it, Henry Ford paid his workers more so they could afford to buy his cars. Whether that was his real goal or it was just PR, paying employees a better wage is good for the economy, if not the bottom line.
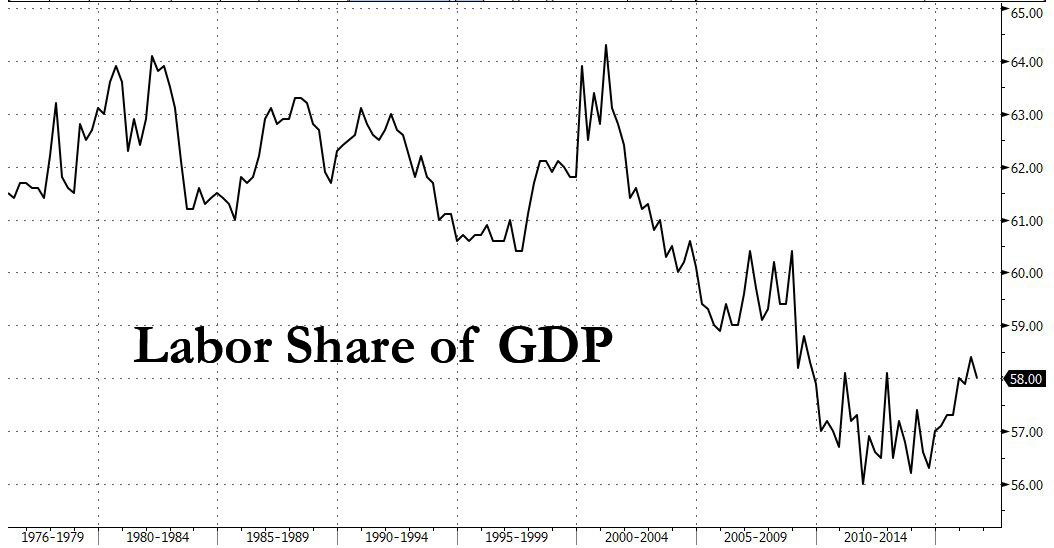
American workers did pretty well during the second half of the 20th century with regard to getting their fair share. Based on the National Income and Products Accounts, employee compensation as a percentage of Gross Value Added held fairly steady between 61% and 65%. But after 2001 that all changed, and labor’s share began to drop until it reached below 57% in 2012.
What happened? While I wouldn’t attribute all of the decline to just one factor, a big driver was globalization. Companies also faced increasing pressure to be more efficient in a world of deflationary pressures. Since 2012, employee compensation has climbed back the the low end of the old range. As the economy recovered from the financial crisis, labor markets tightened and workers have gotten more of the pie. But we’ve also seen a backlash against globalization and further outsourcing. This reaction has resulted in legislation to increase the minimum wage by 20-50% in many states, with inflation-indexed increases in the future.
We have written a great deal about the rise in labor costs over the past year and the negative impact on corporate margins. In fact, this is the primary reason why earnings growth in 2019 was negative for most US companies while the economy enjoyed another strong year of growth driven by, you guessed it, the consumer. In fact, this shift of profits from capital to labor has led to an unbalanced economy in which consumption boomed in 2019 but capital investment growth actually went negative in the second half of the year.
The bottom line is that the average worker is doing well, thanks in part to the higher ratio of corporate earnings coming their way and a tax cut that benefited the middle class more than the rich, given the $10,000 limitation on real estate and state income tax deductions. Generally speaking, this is a good-news story that suggests we are in the process of dealing with income inequality, even if it’s long overdue and may be happening too slowly.
There’s another form of inequality – corporate – that is much less appreciated.
In a world of low growth, limited pricing power and now rising costs, it’s clear that bigger is better and scale matters. This is also the main reason why we’ve been underweight US small caps since July 2018, a relative trade that is now up close to 20%. Small-cap companies can’t offset rising labor costs with technology as easily as large caps, nor do they have the same access to the record-low cost of capital.
Finally, the rising regulatory and cyber costs over the past decade favor larger-cap companies, who can spread such costs across a larger revenue base. Against this backdrop, it should come as no surprise that new business formation is still well below pre-crisis levels. In short, the big get bigger as they continue to eat the small guy’s lunch. To me, this is unsustainable and potentially a bigger risk to the economy and markets than the very important issue of individual income inequality.
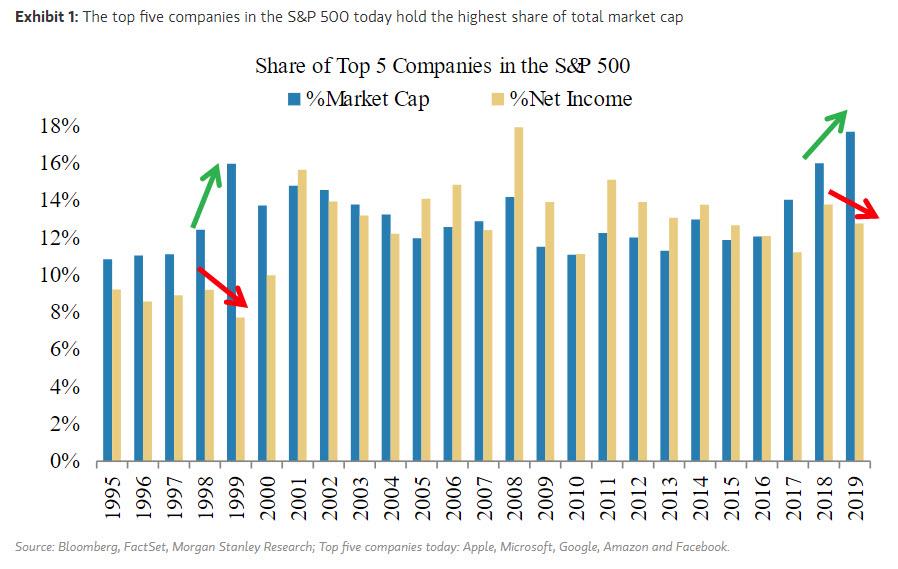
Markets understand this dynamic, which is why small caps have underperformed so significantly over the past 18 months and, quite frankly, over this entire cycle. But this phenomenon is manifesting itself in other ways. Capital concentration is following corporate inequality like never before. Currently, the top five companies in the S&P 500 (the other 1 percenters) make up 18% of the total market cap.
A ratio like this is unprecedented, including during the tech bubble. During 2019, the net income concentration for the 1 percenters didn’t keep pace with their market cap concentration, similar to what happened during the 1999 concentration peak.
I think this divergence is the result of the extraordinary liquidity being provided by the world’s central banks, which is flowing to the most liquid and largest names in the S&P 500. This also recalls 1999, when the Fed expanded its balance sheet at the end of the year and early in 2000 as a precaution against Y2K disruption.
The bottom line: this income/market cap divergence looks likely to continue over the near term, given the Fed’s expected balance sheet expansion through April. More importantly, if we’re right, these companies will then need to deliver on the income side of the inequality divide or risk a sharp decline in price.
Tyler Durden
Sun, 01/12/2020 – 16:00
via ZeroHedge News https://ift.tt/36NWpfK Tyler Durden


