Resistance Is Futile – When Does The FOMO Momo Say No Mo’?
Authored by Sven Henrich via NorthmanTrader.com,
Does a liquidity driven momentum market that seemingly does not care about valuations, risk, open gaps and technical extensions face any resistance at all? Are there technical limits for a market that goes up every day, every week and every month?
History teaches us that there are such limits and I’ll share a few charts to provide some context.
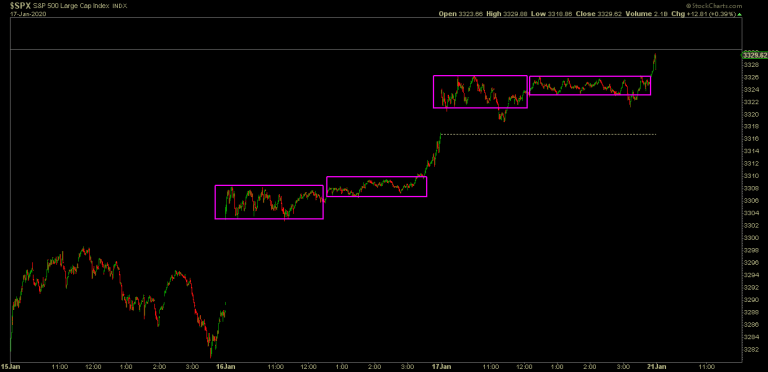
As it were this most recent OPEX week did what happens more often than not: Compress volatility further offering little to no 2 way price discovery exhibiting some of the most intra-day compressed price ranges ever:
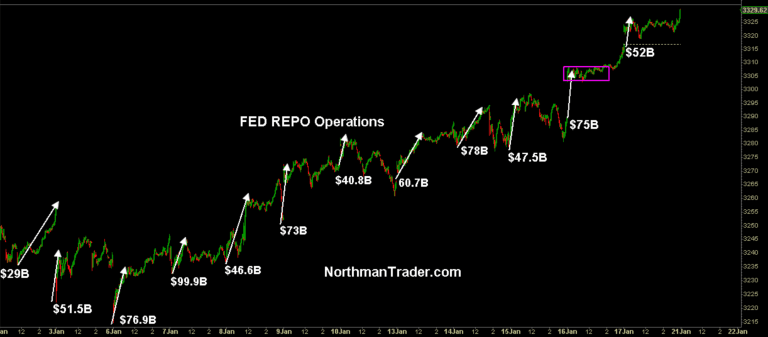
The discussed repo and liquidity machine continues to relentlessly drive the market action:
As a result of the continuous one way action many individual stocks are not only historically valued, but also overbought.
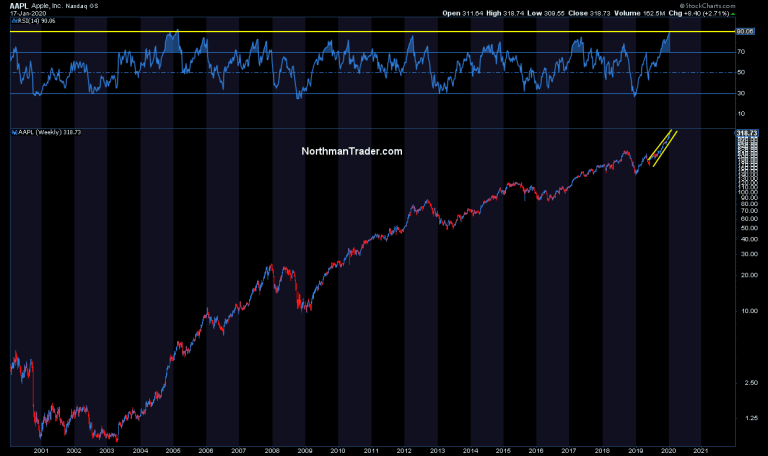
These conditions have persisted for weeks, so little new on that front, but to give historic recognition its due a weekly chart of $AAPL showing a weekly 90 RSI has to be appreciated:
What’s the appropriate term here? Piling in? Buy till you die?
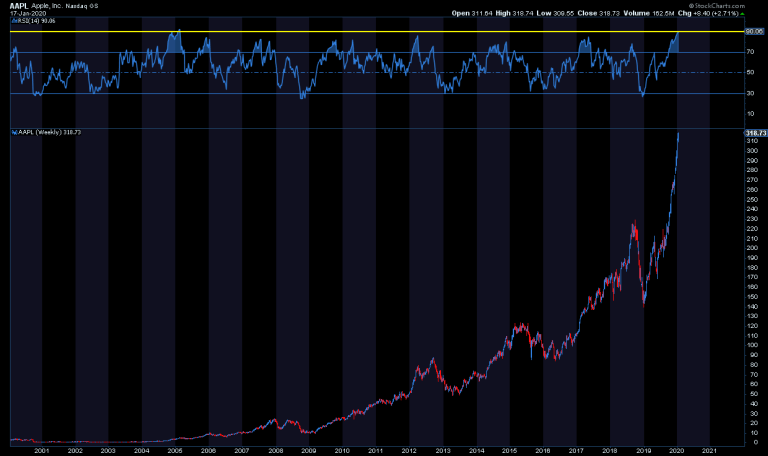
And yes I can’t resist but also show the same chart on a linear basis:
It is this point in time we get the FOMO treatment courtesy of Barron’s and Forbes:
#FOMO weekendhttps://t.co/HHlwj4qUNN
— Sven Henrich (@NorthmanTrader) January 18, 2020
Don’t be left behind, get on board. Reckless as far as I’m concerned, but nobody cares.
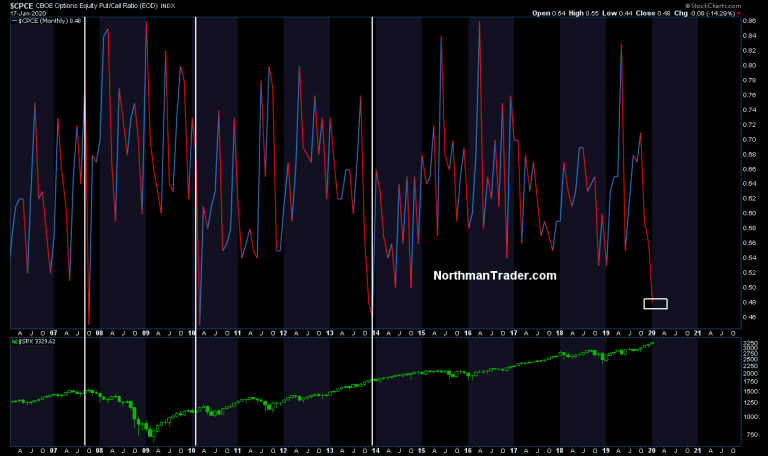
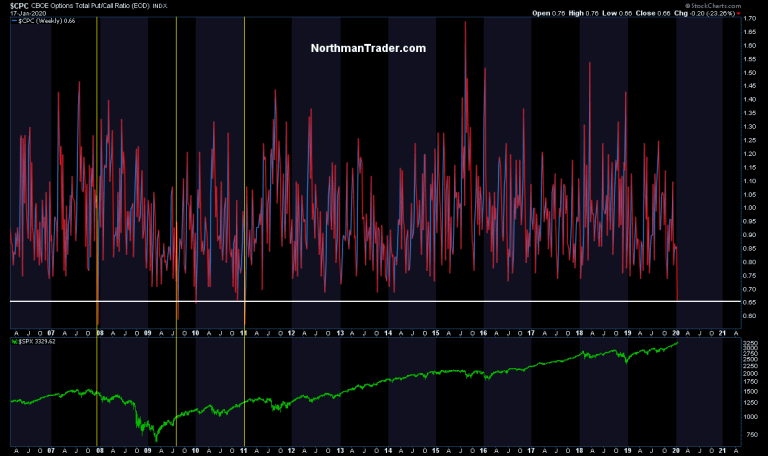
How do I know that nobody cares? Because demand for protection of any sort is scrapping at the bottom of the barrel.
See some of the put/call ratios:
Sometimes extreme complacency gets punished, sometimes it does not.
The faith in the Fed remains absolute, too strong is their influence on equity prices via their liquidity injections which do not appear to stop for months on end, so who’s to say when the dynamic shifts. Not until they withdraw liquidity is the conventional wisdom at the time.
Yes charts like $APPL leave little doubt that this market his very much overbought and reversion risk keeps increasing. Hence I maintain that the higher this market stretches without breathing the more dangerous it becomes.
So are there any signs of technical resistance?
Firstly recognize we have some of steepest and narrowest channels in history. One sizable down day or week and all of these patterns break to the downside with technical consequences:
$NYSE:
$NDX:
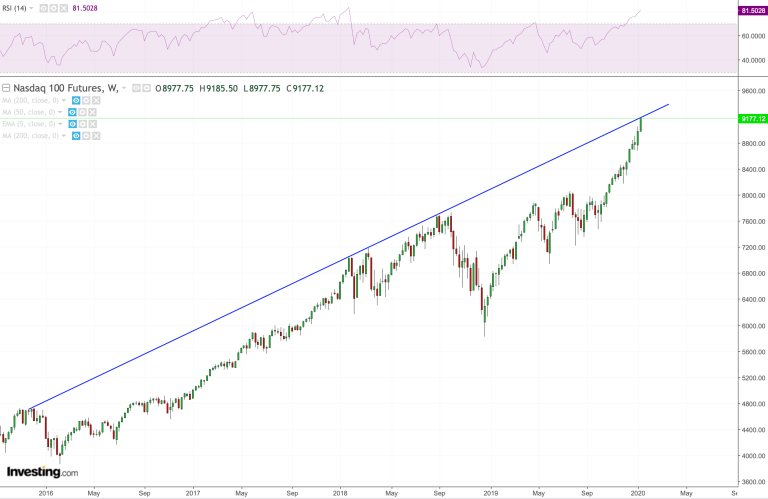
$NDX is of particular interest here as the furious rally has accomplished something very interesting on Friday:
$NDX futures tagged its 4 year trend line that has proven to be resistance time and time again. And $NDX has raced toward that trend line with a weekly RSI north of 81. Ironically an RSI not unlike the one seen in January 2018 when the index also tagged that very same trend line.
To expand on the historical rhyme $NDX components above their 200MA have reached 87 exceeding even the January 2018 level:
In 2017 readings of that magnitude did not mean the end of the bull run then, but these types of readings can clearly lead to trouble.
It is then the same measure for the 50MA that is of interest:
A negative divergence versus the year end highs in 2019. These divergences can persist, but are an early signal that something is amiss.
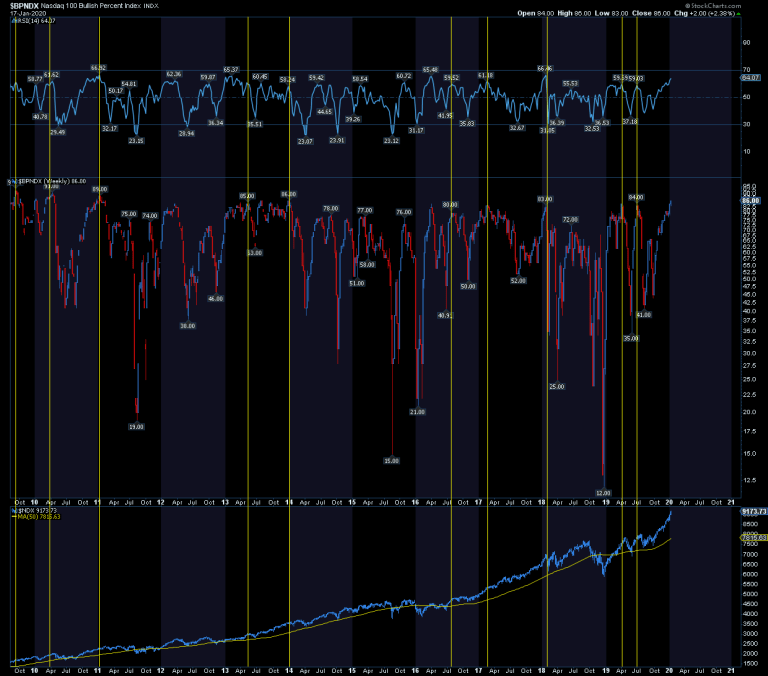
Another signal indicator, the $BPNDX also has reached a level historically consistent with coming reversals:
All of these speak of resistance reached on the internal front.
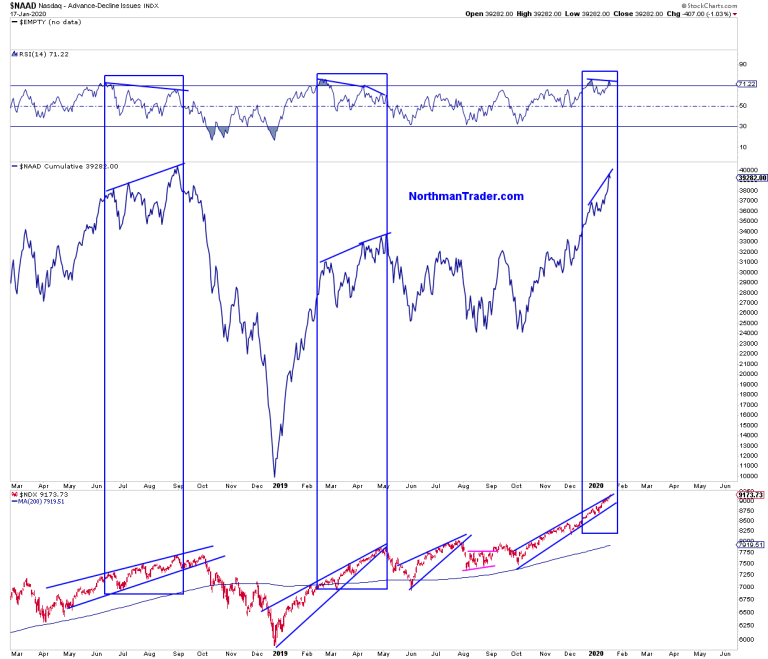
Indeed its the cumulative advance/decline index for the Nasdaq that sends that same message clearly:
Not only overbought, but divergent as well.
All of these readings and signals are coming in context of a yearly chart for $NDX that has precisely zero price precedence in being able to sustain such a vast extension without ending in tears:
But don’t be left behind. Just jump on board they say.
No, it’s not different this time. This cycle is exactly like the previous ones. And hence it’ll end the same way as the previous ones: With bears being mocked while bulls being reckless and greedy throwing all caution to the wind.
We may not know the outcome for a while, but in the here and now markets are approaching some notable points of resistance while demand for protection is at a historic low.
Don’t be left behind? Don’t be left holding the bag more likely.
* * *
For the latest public analysis please visit NorthmanTrader. To subscribe to our market products please visit Services.
Tyler Durden
Sun, 01/19/2020 – 11:30
via ZeroHedge News https://ift.tt/2TFSnCb Tyler Durden

