The Strongest Seasonal Advance In Precious Metals Stocks Begins Now
Authored by Dmitri Speck via Acting-Man.com,
Bonanza Season
In the 18 December 2019 issue of Seasonal Insights I discussed the strong seasonal advance in precious metals around the turn of the year. In silver it begins in mid December and continues until the end of February. A roughly similar pattern can be observed in platinum and palladium, while seasonal buoyancy is at least to some degree evident in gold as well.
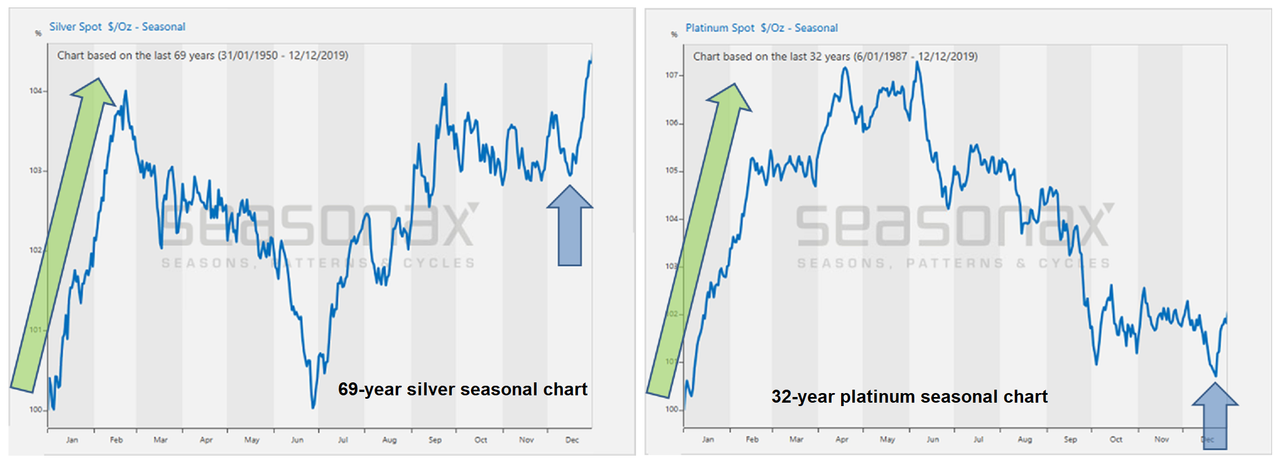
Long-term silver and platinum seasonal charts from the late 2019 issue of Seasonal Insights : the seasonally strongest phase lasts from mid December until late February. [PT]
You may well wonder: what is the trend in precious metal stocks? Are they typically advancing around the same time of the year?
Mining Stocks Track Precious Metals Seasonality
Take a look at the seasonal chart of the HUI gold mining index below. This is not a standard chart depicting price moves over a specific time period. Rather, the seasonal chart shows the moves in the HUI in the course of a calendar year averaged over the past 25 years.
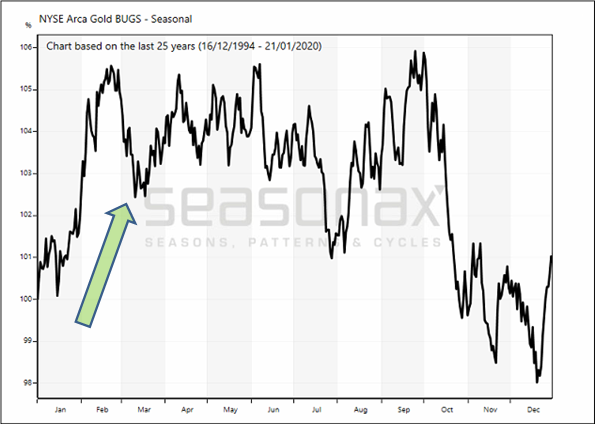
HUI seasonal pattern over the past 25 years: the HUI typically rallies strongly in February
As the chart illustrates, gold & silver mining stocks typically begin to rally in mid December. In January they continue to gain ground in a choppy and somewhat muted advance. Then prices rise very steeply until the end of February. Thereafter the seasonal average declines again.
In short, the strongest seasonal advance in precious metals mining stocks lies directly ahead.
Seasonal Strength is Driven by Fundamentals
Thus gold and silver mining stocks track the seasonal pattern in precious metals. The seasonal advance in precious metals in turn is very likely mainly driven by purchases of industrial users (fabrication demand). Many industrial processors place large buy orders at the beginning of the financial year, once planning for the new year has been completed and new orders to replenish inventory can be booked.
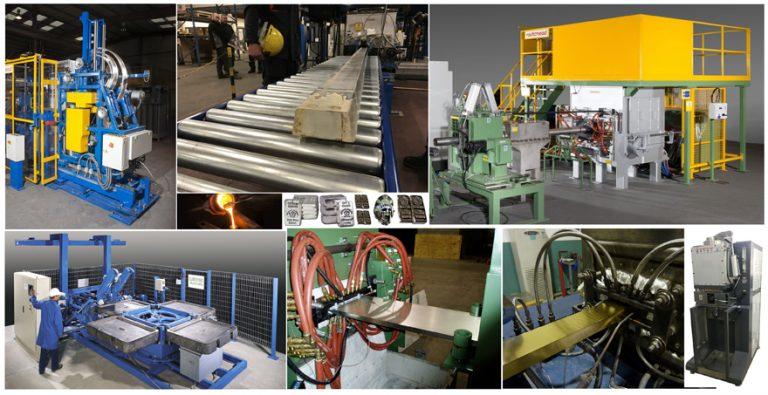
Industrial silver processors in medias res. Clockwise from the top left: silver strip coiling machine, continuous cast LBMA ingot shape, silver billet extrusion, induction vacuum casting machine, gold strip for coins, silver strip, silver dore casting machine. [PT]
By extension the seasonal rally in precious metals mining stocks is therefore underpinned by fundamentals as well.
An Annualized Gain of Almost 100 Percent
The strongest part of the seasonal rally takes place between 28 January and 18 February. The average return achieved in this time period over the past 25 years was 4.03 percent. This is equivalent to an annualized gain of 98.75 percent, which represents an extraordinarily strong seasonal advance.
The following bar chart shows the returns generated between 28 January and 18 February in every single year since 1994. Green bars indicate years in which gains were posted, red bars indicate losses.
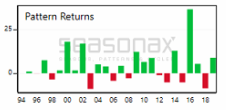
HUI: return between 28 Jan and 18 Feb in every single year since 1994 in percent. Prices often rise very strongly.
As the chart illustrates, the distribution of returns is not exactly uniform. The reasons: the gold mining sector is highly speculative, and it was furthermore frequently mired in bear markets in the past 25 years, which have a negative impact on performance in all time periods of the year.
However, as a result of this, gains achieved in these mere 15 trading days can be all the more spectacular. For example, in 2016 the HUI index rallied by a remarkable 36.65%.
* * *
As can be seen, individual shares or sectors often exhibit unique seasonal patterns on account of various fundamental drivers. As there are a great many listed stocks, it is possible to use seasonality as a diversification tool. Moreover, at any time in the course of a calendar year certain individual stocks stand out in terms of their seasonal performance. In other words, investors can take advantage of numerous opportunities throughout the year. On our web page www.app.seasonax.com or with the help of the Seasonax app on Bloomberg or Thomson-Reuters Eikon you can examine the seasonal patterns of countless individual shares (to be precise: at www.app.seasonax.com you can analyze more than 22,000 different stocks!).
Tyler Durden
Tue, 02/04/2020 – 10:55
via ZeroHedge News https://ift.tt/37ZxZ3h Tyler Durden