Market Bottom Indicators #1 – VIX Futures Term Structure
Submitted by Peter Garnry, Head of Equity Strategy, Saxo Bank
Summary: The current VIX level indicates significantly negative returns ahead for S&P 500 and four times the normal volatility on a daily basis. In addition the VIX futures term structure suggests that traders are rewarded for being long and that VIX is expected to be very high even in May. Speculative positions in VIX options and futures suggest that short volatility positions have been cut aggressively but that 15% of open interest is still short.
* * *
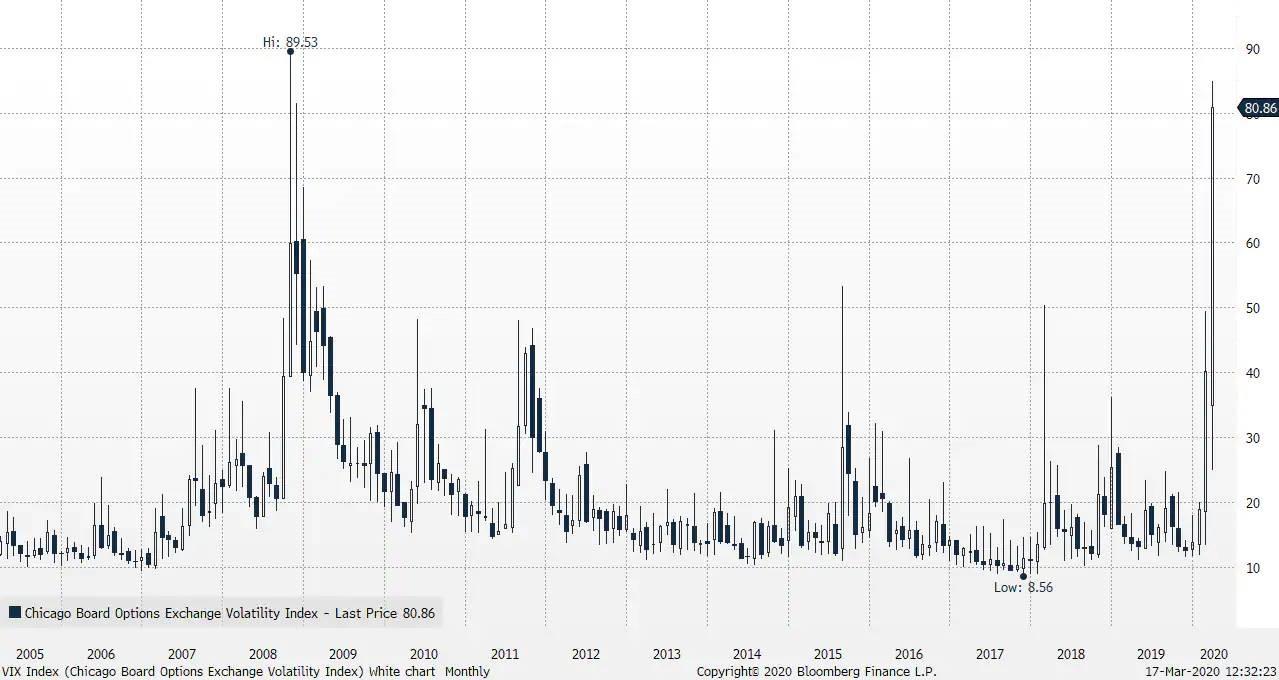
Equity option markets provide investors with valuable information about expectations for volatility and the time value embedded. The VIX Index closed at 82.69 which was a new record close surpassing closing VIX prices during the Great Financial Crisis in 2008. However, the absolute intraday peak of 89.53 in 2008 has not been surpassed yet. Historical analysis of the VIX Index suggest that VIX at these levels puts the market into a state with significant negative return expectations and realized volatility more than four times the normal level combined with extreme large kurtosis. In other words, equities are biased towards more declines from current levels.
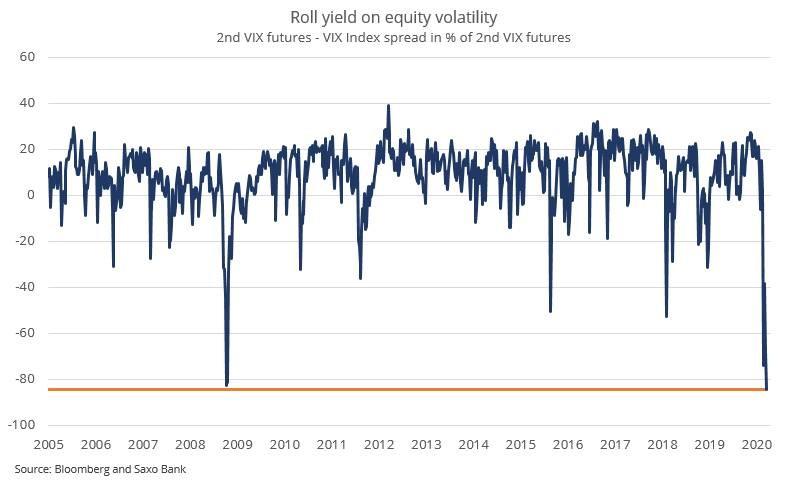
However, hidden in the VIX futures term structure clues for when the equity market bottoms are visible. The term structure of VIX (how the price of future contracts relates to the spot) is normally in contango (upward sloping) meaning that VIX futures have a higher price than the spot. This means that the futures market is pricing on average than volatility will rise from current levels. Historically this premium to spot has been too high relative to the subsequent realized volatility and thus traders have made money by shorting the different VIX futures contracts which then rolls down creating a positive roll yield for being short volatility.
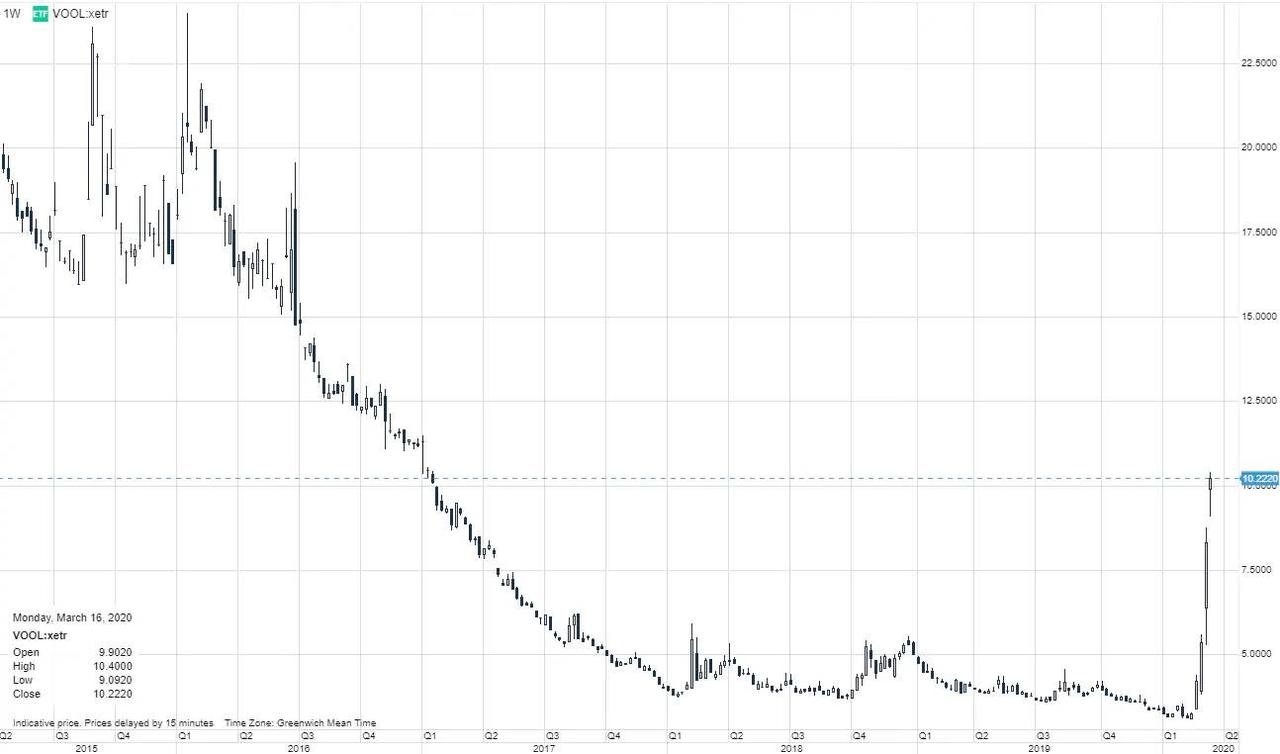
The current spread in percentage between the second futures contract (expires in May) and spot is -84.5% which is lower than during the Great Financial Crisis in 2008. This means that the expecting VIX to fall over the coming months but only to levels around 44 which would still be very high levels. The steep backwardation (downward sloping) creates a tailwind for being long volatility. The Lyxor ETF S&P 500 VIX Futures Enhanced Roll (vool:xetr) is one way to express this. When the VIX futures term structure (2nd VIX contract / VIX Index) has been higher than -10% we typically see positive equity markets. For clients that want to track this spread the VIX Index and the current 2nd month VIX futures contract have the Saxo ticker codes VIX.I and VXK0 respectively.
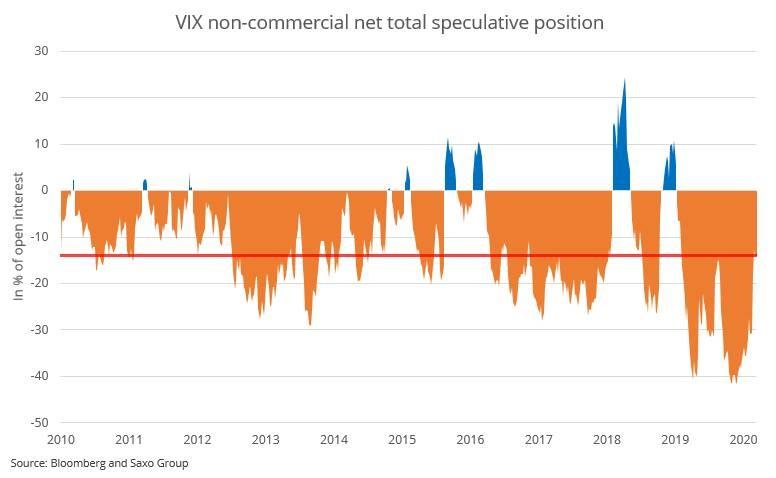
Another way to gauge when the market has exhausted itself is be looking at the speculative positions in VIX options and futures. We have come from the largest short volatility position ever with 40% of open interest being short, that’s yield chasers dominating volatility hedgers. The data is one week delayed but still shows that the short volatility positions have been cut massively but not to zero yet. If speculative positions move into positive then it would be another sign of equity market bottoming.
Tyler Durden
Tue, 03/17/2020 – 17:56
via ZeroHedge News https://ift.tt/2TWyc2E Tyler Durden