Platts: 6 Commodity Charts To Watch This Week
Authored by S&P Global Platts Insight blog,
In this week’s pick of energy and commodity charts to watch, super tankers are in high demand to store oil while prices remain at historic lows. Plus, regional gas prices converge around all-time lows, European steel and aluminum demand plummets, and Asian gasoline markets expect little relief from oversupply.
1. Global crude oil glut creates demand for long-term floating storage
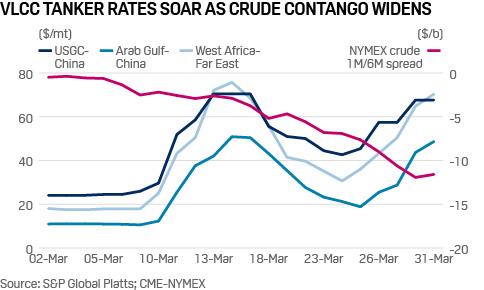
What’s happening? Some super tankers are being booked to store crude for up to three years—potentially the longest ever duration for floating storage—as traders seek to profit from hoarding oil to cope with the current oil demand and supply shocks. The race to secure floating storage has picked up significantly in recent weeks, with up to 40 VLCCs and 20 Suezmaxes already placed on long-term chartering, according to S&P Global Platts estimates.
What’s next? Freight rates and storage costs have ballooned as the market faces the prospect of more oil just as demand destruction due to the spread of coronavirus escalates. This has raised the stakes over how the world’s biggest producers, the US, Russia and Saudi Arabia will confront the challenges of competition over market share, lower prices and potentially a lack of buyers for their crude.
2. Weather, oversupply pressure gas prices across regions
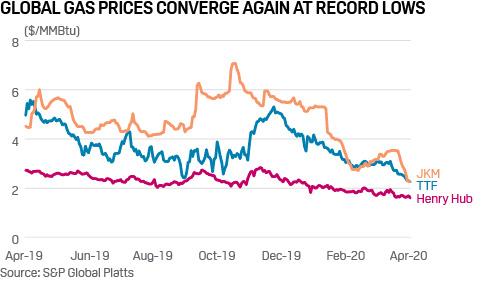
What’s happening? Global gas prices have again converged, this time around record lows, pressured by the mild northern hemisphere winter, high gas stocks and a still oversupplied global market. The JKM benchmark LNG price has fallen to an all-time low of just $2.26/MMBtu for the front month, bringing it down closer toward the prompt TTF and Henry Hub prices.
What’s next? With winter now behind us and the start of the LNG shoulder season, there is little optimism in the market for a recovery in prices, especially with European stocks significantly higher than in previous years and concerns over the demand impact of the coronavirus. Producers are feeling the pinch and industry is watching closely for signs of any supply curtailments in the coming weeks.
3. European aluminum and steel demand decimated by automaker shutdowns
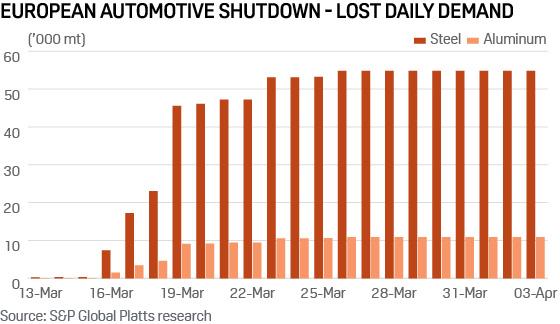
What’s happening? European automakers have been shutting down production since March 13 in response to the outbreak of coronavirus. With the automotive industry a major consumer of both steel and aluminum in Europe, the shutdowns have had a marked impact on demand, reducing daily consumption by an estimated 55,000 mt of steel and 11,000 mt of aluminum.
What’s next? Blast furnaces across Europe have idled in response, and players up and down the aluminum value chain have done likewise. Looking ahead, there is little light at the end of the tunnel as car manufacturers continue to revise dates for restarts.
4. Coronavirus effect could erase expected gasoline demand peaks in Asia
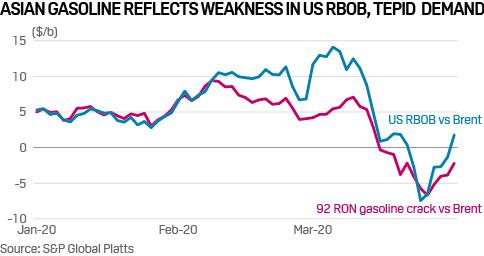
What’s happening? The Asian gasoline market has been hit hard by the coronavirus pandemic. Traditionally, Indonesia’s peak gasoline demand occurs during the Muslim fasting month of Ramadan, which begins toward the end of April and lasts till the end of May this year, followed by the Islamic holiday of Eid al-Fitr. More stringent containment measures could derail this trend. State-owned Pertamina has already tapered its pre-Ramadan intake of gasoline to around 10 million-11 million barrels of gasoline in April, down from the 12.236 million barrels the country imported in April 2019, according to market sources. In India, the country’s transition to Bharat Stage VI fuels from April 1, which was expected to result in a demand surge for motor fuels with low sulfur content, has so far had a muted impact on demand as its “Janta Curfew” and nationwide lockdown have dampened both market sentiment and consumption.
What’s next? Market participants will be closely watching the US RBOB/Brent crack as well global economic growth indicators. Asian gasoline crack spreads closely track movements in the US RBOB/Brent crack, with the latter typically rising during summer, from April to October. However, given the weakness in the US RBOB/Brent crack and global GDP, the downward pressure on the gasoline market is likely to persist in Q2.
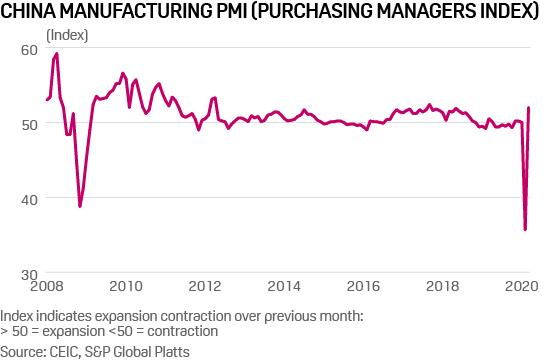
5. China’s PMI: A V-shaped recovery?
What’s happening? After falling to an all-time low of 35.7 in February, China’s manufacturing PMI, a keenly-watched indicator of economic health, rebounded to 52.0 in March, exceeding many analysts’ expectations. That doesn’t mean China’s economy is roaring back to life, just that over half of companies surveyed reported that their production, employment, new orders and the like were higher than last month – hardly an achievement given the economy was at a virtual standstill in February. Even the National Bureau of Statistics noted this reading did not mean that China’s economy had returned to normal.
What’s next? Government action to prevent a second wave of infections is likely to be a drag on economic activity. China has cut the number of international flights allowed into the country and closed cinemas again. Shanghai’s government has gone further, ordering tourist attractions to close in April. Sinopec, the country’s largest refiner, expects domestic oil product consumption to more or less recover in the second-half of the year. An S&P Global Platts survey found that Sinopec’s refinery operating rate was 72% in March, well up from the historical low of 64% in February, but still well under Sinopec’s average utilization rate last year which was more than 90%. More measures to close the economy will be a drag on demand meaning that, unlike the PMI, the shape of the recovery is likely to be far from V shaped.
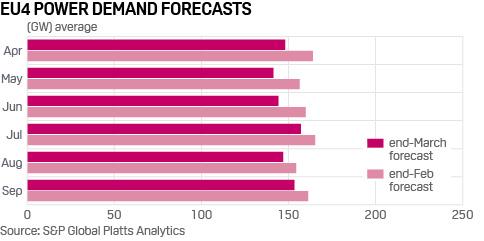
6. EU power demand set to dive 10% in Q2 on shutdowns
What’s happening? European power demand is expected to fall 10% over the coming months due to coronavirus restrictions, with Italy and Spain the worst hit by extended lockdowns to non-essential activities. S&P Global Platts Analytics has cut its Q2 demand forecast for the four big Eurozone economies (Germany, France, Italy and Spain) by 16 GW, down 11% on year. Early indications for the second half of March show Italian demand down over 20%, while Germany was down 9%.
What’s next? April and May are generally low demand months for electricity, so additional cuts could be a challenge for system operators, as renewables’ share in the mix rises. A demand cut of 10% across the EU4 would be the energy equivalent of 70 standard LNG cargoes over the quarter. On the flipside, hydro resources are healthy and Europe’s wind and solar parks on a sustained run of output increases, reflecting on-going capacity additions. Daily load curves are changing as solar hours increase and morning peak demand flattens, reflecting the absence of industrial load. A low-demand, high-supply scenario tests system operation just as much as the reverse.
Tyler Durden
Mon, 04/06/2020 – 12:45
via ZeroHedge News https://ift.tt/3e1ba2T Tyler Durden
