Morgan Stanley Spots Something Very Strange About This Rally
Following an earlier note from Morgan Stanley’s quants which observed that the rally in stocks and the plunge in the VIX has been abnormally fast for a country sliding into a deep recession, something which Reuters picked up on later in the day…
… a follow up report has found something outright bizarre about the current bear market rally: namely, that while both the S&P the SX5E rally from 2300 to 2600 lacked participation, it was even worse beyond 2600. In other words, not only is there no buying, but there isn’t even short covering or forced “stop outs.”
Among the observations highlighted by the bank, there has been:
- ZERO HF re-grossing (fundamental or systematic)
- ZERO covering of the $33bn net short in Futures (and volumes falling)
- ZERO new build in call ownership (and volumes falling).
Furthermore, the moves have been “gappy” and there is little evidence investors are being “stopped in.” And while the improving virus-related data and some optimism about exit-strategies had put a floor on the market, the economic impact (as yet unknown) remains a major headwind for bullish flow and Morgan Stanley expects the SX5E to be in a range between 2400-2900 for the time being.
Some more details: on Monday, SX5E spot rallied +5% but for a move >4.5% it was the lowest volume rally since 2010 (sample size = 10 days). Meanwhile, the participation on the way down was ~3x larger than on the way up (left chart below), a legacy pattern observed when either central banks or stock buybacks are the dominant buyers of stock.
At the same time, on the cash side, hedge fund re-grossing simply isn’t happening, and historically, as long as HF P&L Volatility remains greater than 7v, re-grossing is unlikely (10 day HF P&L vol is 18v, 30 day is 14v).
Going further back, the 2300 to 2600 rally saw at the end of March a lot of short covering in SX5E futures (~$20bn worth) but beyond 2600 Morgan Stanley estimates clients actually started to re-hedge adding ~$2bn of net new shorts., We estimate total outstanding short balances (net) are now -$35bn (left chart below).
Another remarkable observation: the “digging in” on the short futures is linked to a lack of options activity. Tactical Put and Call volumes continue to drop, with on average just $550MM/day of gamma trading in the last week (lowest in 2Y, right chart below). In delta terms, call volumes are now 60% below the March peak of $14bn/day, Put volumes are 90% lower vs. the $40b/day March peak.
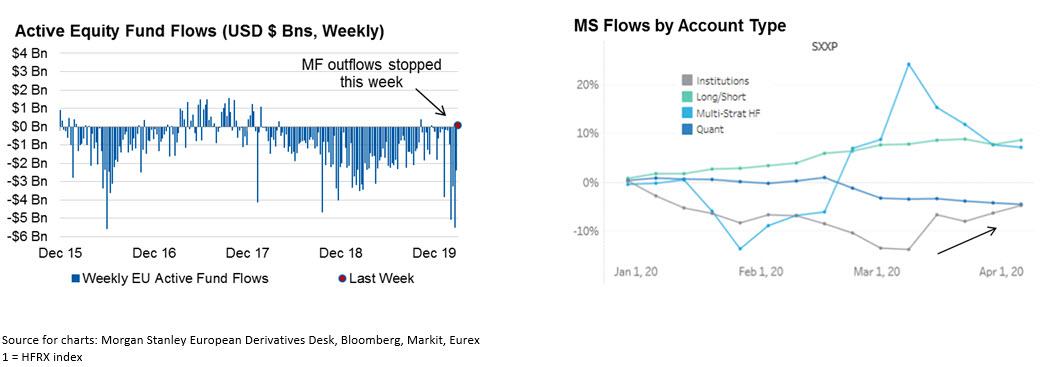
There was one bright spot in all the confusing flows: after a record $17BN of Actively Managed EU Equity Funds saw redemptions in March, the first week of April saw that come to an end indicating that supply from retail investors is slowing, at least in the near term.
One final note: we previously flagged that systematic accounts were the quickest to de-lever: the last 2 weeks of Feb were the biggest outflows since 2014, coinciding with a period where Quantitative directional funds P&L fell -7%. And while systematic flows are still mildly negative but have slowed sharply since (right chart below), the one group net accumulating equity over the past 2 weeks are Real Money/Institutional Accounts (bottom right chart).
Tyler Durden
Wed, 04/08/2020 – 15:30
via ZeroHedge News https://ift.tt/2Rn7Gy2 Tyler Durden


