The FAAMGs Are Up 15% In 2020; The Remaining 495 S&P Stocks Are Down 8%
Tyler Durden
Sun, 05/31/2020 – 21:33
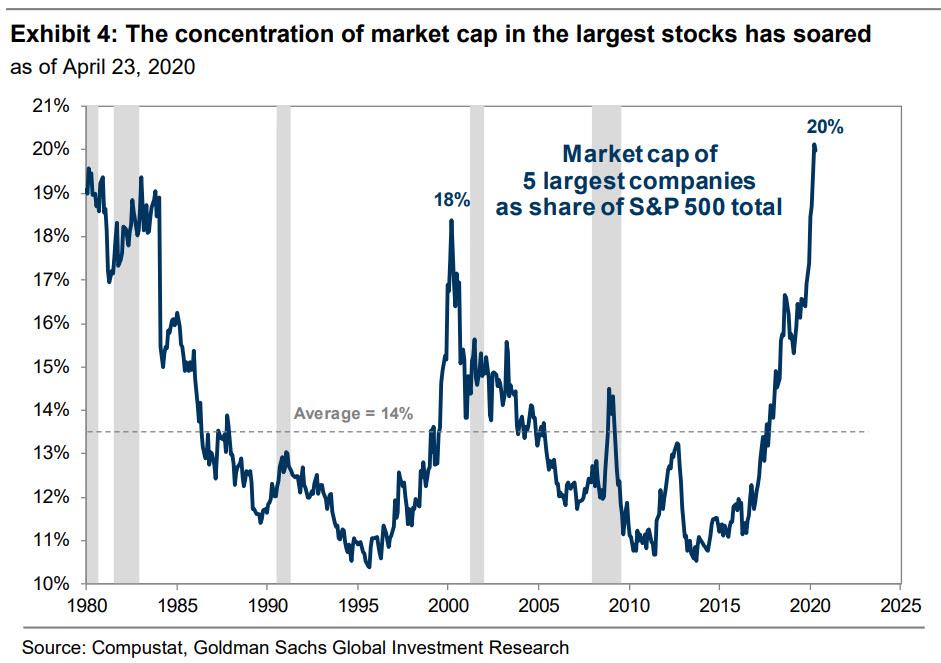
One month ago, Goldman triggered a selloff in growth and momentum stocks, when it pointed out that the five largest S&P 500 stocks, the FAAMGS (or MSFT, AAPL, AMZN, GOOGL, FB) have risen to account for 20% of index market cap, representing the highest concentration on record…
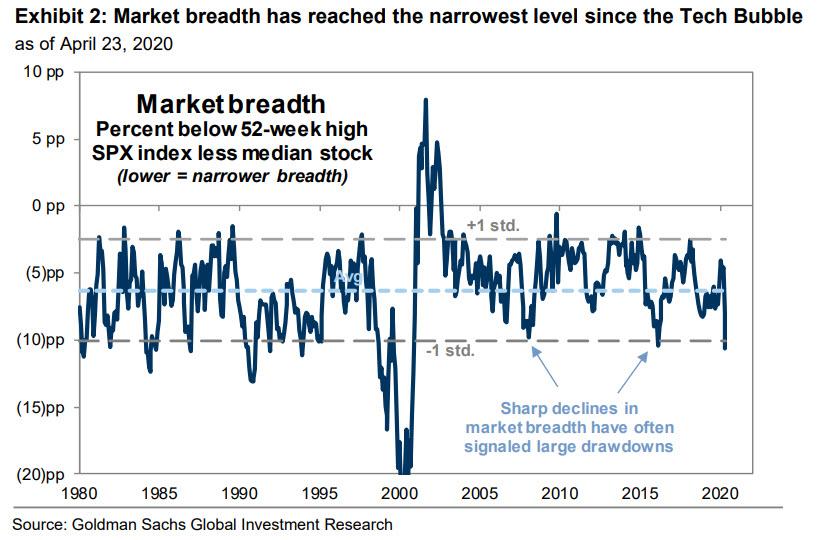
… and warning that “narrow market breadth is always resolved the same way” as “narrow rallies lead to large drawdowns as the handful of market leaders ultimately fail to generate enough fundamental earnings strength to justify elevated valuations and investor crowding. In these cases, the market leaders “catch down” to weaker peers.”
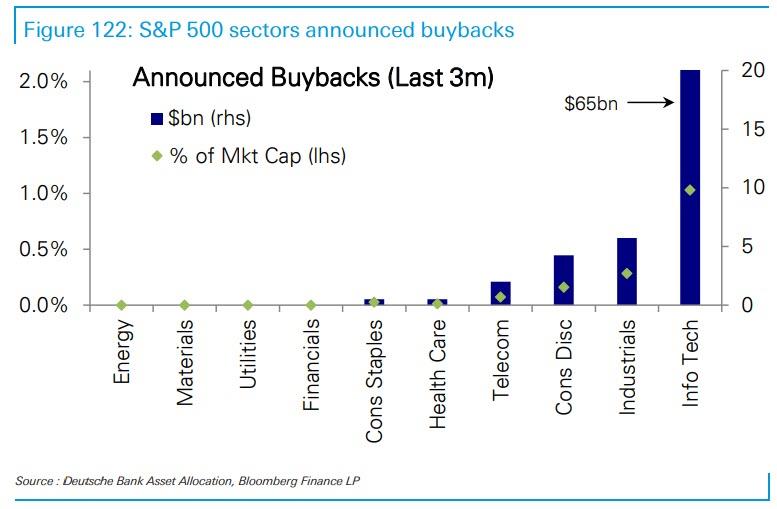
In short, as we wrote – somewhat jokingly – in April that “The Market Is Now Just 5 Stocks“, that’s precisely what has happened, with investors flooding into the buyback-funded momentum of the largest tech names …
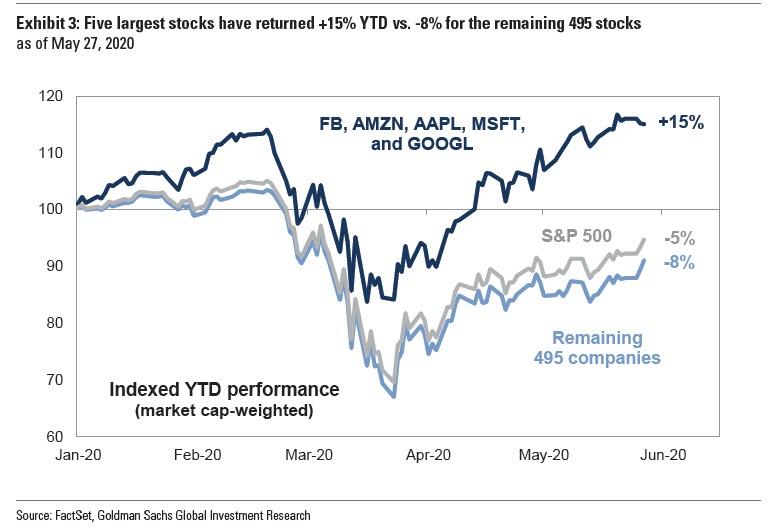
… and creating the biggest “hedge fund/mutual fund/retail/momentum hotel” ever assembled in the FAAMGs. And here is an update to one of the most amazing statistics of 2020 from Goldman: YTD the 5 biggest stocks are up 15% while the remaining 495 S&P500 companies are lower by a collective 8%, with the overall S&P400 index is down 5% YTD (compare to four weeks ago here).
Here are Goldman’s comments on this bifurcation in the market:
The return of the S&P 500 index overstates the performance of the typical stock. The equity capitalization-weighted S&P 500 index has rebounded by 35% from its low and now trades just 11% below its all-time high. The index return since the start of the year is -6%.
The average stock has returned -13% YTD. The equal-weighted S&P 500 index trades 15% below the record high and has lagged the cap-weighted index by 650 bp this year.
The stellar return of the five largest stocks in the S&P 500 — MSFT, AMZN, AAPL, GOOGL, and FB — is the primary explanation for the large difference between the cap-weighted index and the average stock.
While the FAAMGs may grow further, there is a hard limit on just how much bigger they can get:
At 20%, the current aggregate index weight of the five stocks with the largest market caps is the highest in history, exceeding the previous peak of 18% at the apex of the Tech Bubble in March 2000. However, we are approaching the practical maximum concentration of 25% given most long-only portfolio managers have diversification requirements and individual stock position limitations of roughly 5%.
Incidentally, this historic bifurcation of the “market” into two sets of stocks is also why Goldman is skeptical about further upside:
Broader participation in the rally will be needed in order for the aggregate S&P 500 index to climb meaningfully higher. Goldman Sachs equity research analysts currently forecast just 1% upside for the cap-weighted group of the five stocks. The modest upside for the largest stocks means the remaining 495 constituents will need to rally to lift the aggregate index.
Luckily, there is nothing like a weekend of nationwide looting and violence to spark a broad-based market rally and push the policy tool formerly known as the S&P500 back to all time highs to convince everyone that nothing is fucked here.
via ZeroHedge News https://ift.tt/2MjfzRT Tyler Durden


