Will A Democratic Sweep Crash The Market: Here Are The Facts
Tyler Durden
Tue, 06/23/2020 – 13:10
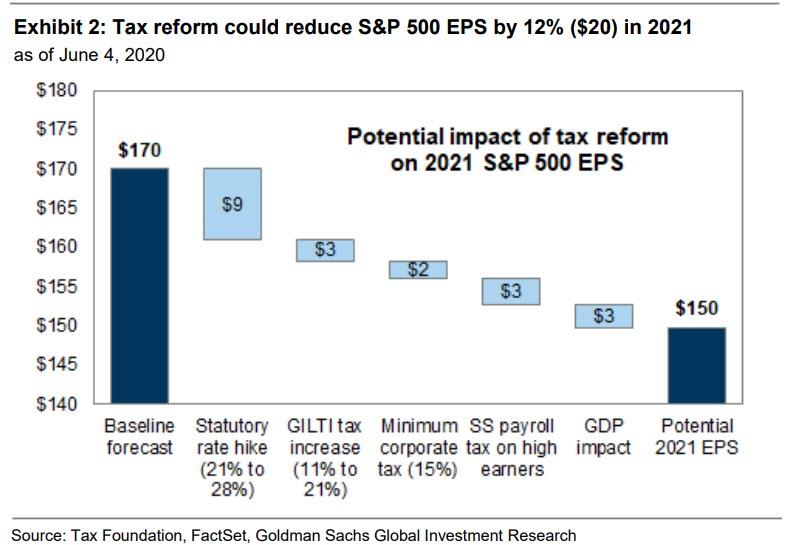
Over the weekend we published “A Democratic Sweep Is Also Bullish As Nothing Can Stop Printer Going Brrrr” in which we highlighted Morgan Stanley’s retort to a Goldman Sachs analysis from earlier this month according to which a Biden victory and Democratic sweep would i) lead to higher corporate taxes and ii) wipe out about 20 EPS points from the S&P in 2021.
Morgan Stanley disagreed, saying that more fiscal stimulus this year is coming probably before the elections, while even a Democratic sweep “win doesn’t have to be ‘risk off’.” while “investors may be too focused on the tax side of the equation, overlooking the support for aggregate economic demand from fiscal expansion.” In short, we concluded “no matter who ends up victorious on Nov 3, there is no stopping the Fed’s printer from going Brrrrrrrrrr.”
DataTrek’s Nicholas Colas is on the side of Morgan Stanley, which also happens to be counter to Donald Trump’s
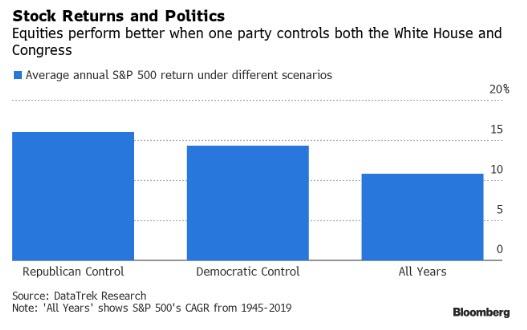
In his latest Morning Briefing note writes that “US equity markets do better when one party controls both the White House and Congress. Since 1945 the S&P 500 has risen by an average of 16.0% under all-Republican governments and 14.3% under all-Democrat ones. The 1945 – 2019 average S&P 500 return is 10.8%.”
Below we lay out how he reached this conclusion which suggests that when it comes to capital markets, there really is no difference between republicans and democrats.
There is a lot of buzz in capital markets just now about the November US general election. Some people say equities will decline if President Trump loses. Others say they will rally.
We vividly remember the night of Mr. Trump’s 2016 win because stock futures initially sold off hard but then came roaring back later in the evening. One reason for that reversal: Republicans had managed to maintain control of the House and Senate. One party would “own” the economy for the next 2 years. That got us to thinking about US stock market returns in the context of whether the White House and Congress are politically aligned (same party controlling both chambers and the Presidency) or not.
Three points on this, using the post-World War US political experience and annual S&P 500 returns:
#1: There have been 30 years since 1945 when one US political party has control of Congress and White House:
- Republicans. 8 years total, average return +16.0%. Worst return: -4.3% (2018); The years and their S&P 500 returns: 1953 (-1.2%), 1954 (+52.6%), 2003 (+28.4%), 2004 (+10.7%), 2005 (+4.8%), 2006 (+15.6%), 2017 (+21.6%), and 2018 (-4.3%)
- Democrats. 22 years, average return +14.3%. Worst return: -10.0% (1966); The years and their S&P 500 returns: 1945 (+35.8%), 1946 (-8.4%) 1949 (+18.3%), 1950 (+30.8%), 1951 (+23.7%), 1952 (+18.2%), 1961 (+26.6%), 1962 (-8.8%), 1963 (+22.6%), 1964 (+16.4%), 1965 (+12.4%), 1966 (-10.0%), 1967 (+23.8%), 1968 (+10.8%), 1977 (-7.0%), 1978 (+6.5%), 1979 (+18.5%), 1980 (+31.7%), 1993 (+10.0%), 1994 (+1.3%), 2009 (+25.9%), and 2010 (+14.8%).
Takeaway: A small sample size, but it does seem to show that having one party in control of Congress and White House is good for US stocks. The S&P 500’s compounded annual growth rate from 1945 – 2019 is 10.8%. Both parties outperform that benchmark, with Republicans holding a slight lead. Again, this is a small and noisy sample but interesting history nonetheless.
#2: The greatest post-World War II bull run for US stocks mostly occurred with a split White House/Congress.
- 1981 – 1986. Republican President and Senate, Democratic House: S&P 500 CAGR: +15.0%
- 1987 – 1992. Republican President, Democratic House and Senate: S&P 500 CAGR: +14.0%
- 1995 – 1999: Democratic President, Republican House and Senate: S&P 500 CAGR: 23.1%
Takeaway: this is a good example of why we are always cautious about attributing stock market returns to political environments. President Reagan’s pro-business policies certainly helped stocks in the early/mid 1980s, but so did Paul Volcker’s successful fight with inflation and sharply lower oil prices. President Clinton was thoughtful about deficit reduction, but the 1990s stock market run was just as much about Internet 1.0 as lower rates. And neither Reagan nor Clinton ever saw their party control both chambers of Congress.
#3: All the S&P 500’s worst years since World War II came when neither political party had complete control:
- 1973 – 1974 (-36.5% combined): Republican Presidents, Democratic House and Senate
- 2000 – 2002 (-31.2% combined): Republican President, Republican House and Democratic Senate for much of the period (50/50 post-election, 51/49 after Senator Jeffords switched caucuses).
- 2008 (-36.5%). Republican President, Democratic House and Senate.
Takeaway: the old saying about markets liking gridlock is only true when things are going well (prior point), not when there is a geopolitical shock (1973 – 1974 oil crisis, 9-11 attacks and Gulf War II) or a Financial Crisis (2008). In that respect equity investors have been fortunate during the 2020 COVID Crisis, which temporarily brought the 2 parties together to enact strong fiscal stimulus.
Bottom line to all this: the historical data points to a good future US equity investment environment even if Democrats sweep the White House and Congress this November. If nothing else, this does explain why equity markets have been resilient even as the odds of this outcome have risen in recent weeks.
via ZeroHedge News https://ift.tt/2BvGojK Tyler Durden

