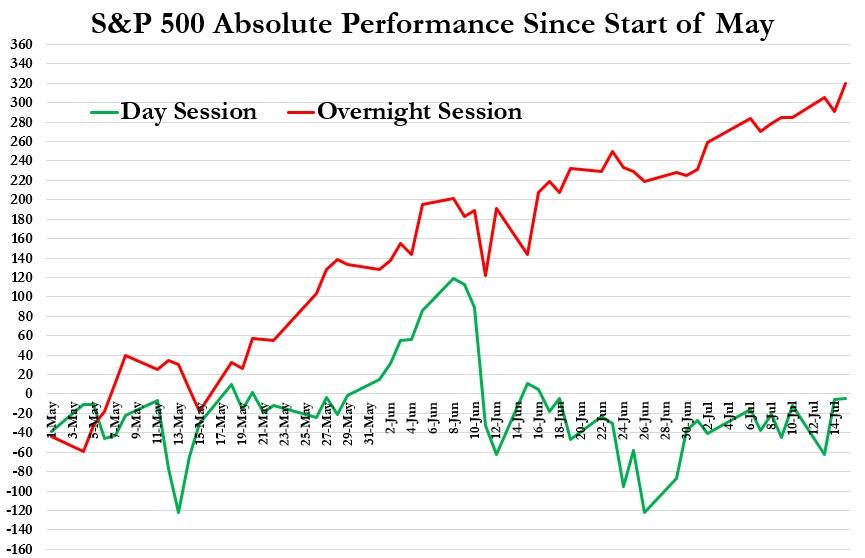
This Is The Craziest Chart You’ll See Today
Tyler Durden
Fri, 07/17/2020 – 08:20
In a world of incredulity, to suggest one chart is the “craziest” may seem a little braggadocio but we suspect after reading below, you will agree…
Something very odd is going on.
Since the beginning of May, the S&P 500 has risen 314 points – a significant surge.
However, as the chart below shows, more than all of those gains have come when the US equity market is closed.
Yes you are reading that correctly: During the US day session, the S&P has lost 5 points; and during the overnight session (from the cash close to the cash open), the S&P has gained 319 points.
Trade accordingly.
via ZeroHedge News https://ift.tt/3jhoOBE Tyler Durden
