This Time Is Different: The Death of Valuation – The Intellectual Calamity Of “Big Data”
Tyler Durden
Mon, 08/03/2020 – 15:20
Submitted by Kailash Concepts
Introduction: An Old Story
A recent article from Bloomberg counted a leading quant from one of the world’s largest asset managers as a believer that there is “no way to tell if betting on ostensibly cheap companies will work again.” Noting that Tesla’s valuation, at 10,392x trailing earnings, 33x book value, and 11x sales made no sense on those metrics, the article suggests the secret to pricing Tesla, ostensibly, lies in using big data to tap into “…social media to gauge employee sentiment…”1 Kailash would like to note the following: if the price paid relative to cash flows is no longer the primary bridge to valuation, capitalism has changed. If markets will now allocate capital based on novel new metrics then corporations have a disincentive to seek profitability.
Unfortunately, Kailash believes the idea that things are different this time to be a very old and very flawed story big-data or no. For investors betting with managers purporting to glean market-beating information from big-data, we encourage you to read the brilliantly written “Everybody Lies”2 by Harvard trained and former Google data scientist Seth Stephens-Davidowitz. Familiarizing yourself with the curse of dimensionality might be important for you and your portfolio. To summarize the book’s finding regarding stocks, Big Data cannot predict which way stocks are headed.
Figure 1 below shows that growth’s lead over value has exploded since we first published the chart in Growth vs. Value: A Predisposition towards the Importance of Price has been Painful. Despite this, Kailash will not abandon a previous approach whose logic we understand (although we find it difficult to apply) even though it may mean foregoing large, and apparently easy, profits to embrace an approach which we don’t fully understand, have not practiced successfully and which, possibly, could lead to substantial permanent loss of capital. As any student of the markets will instantly see – the bolded statement is plagiarism. Those words were written by Warren Buffett in 19673 in response to pressure to pursue the “nifty fifty” whose exorbitant valuations were rationalized using a slew of new valuation methods.
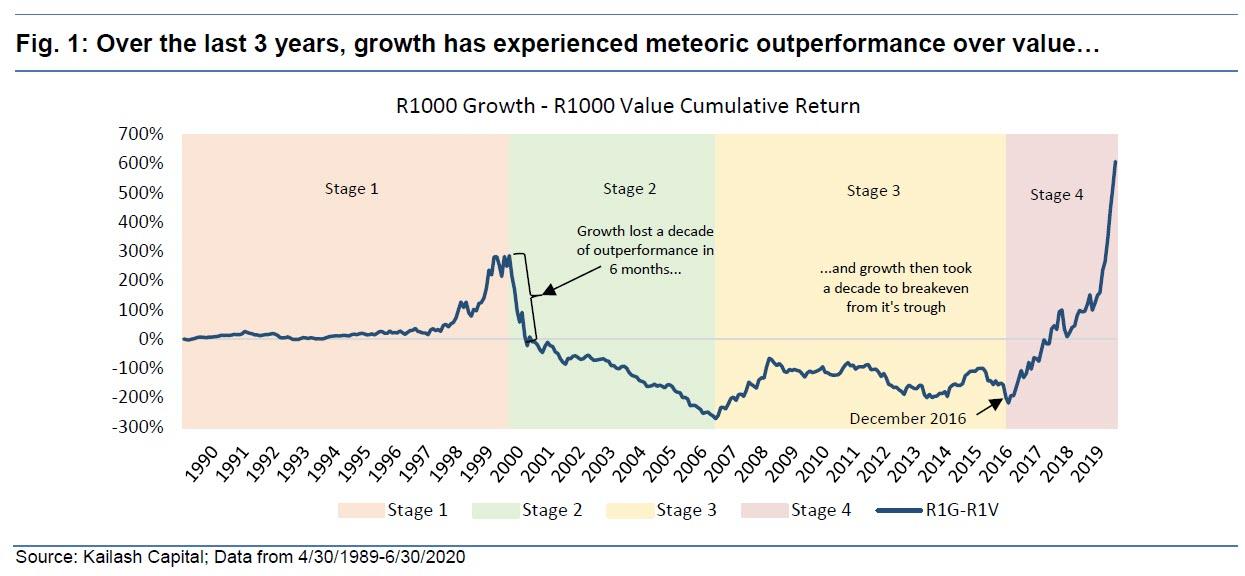
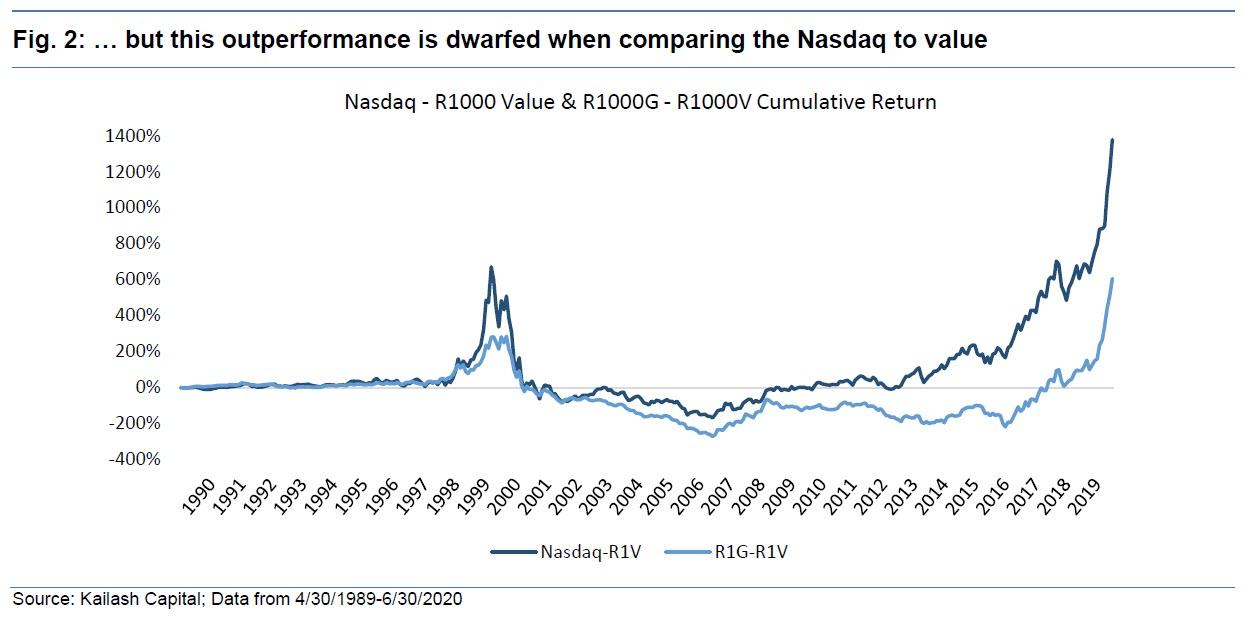
Figure 2 below shows the already dramatic performance discrepancy between growth and value is dwarfed by the return spread between the Nasdaq and the Russell 1000 Value. Causality is difficult to establish, but Kailash believes much of Nasdaq’s manic run is simply a wall of money chasing what was already racing higher. For context, in mid-September of 2008, with the market already down 24%, the Fed began to intervene. Through the trough in March of 2009, the Fed’s balance sheet grew just over $1 trillion or $7.7bn per day. In contrast, the Fed began the largest expansion of its balance sheet at this market’s peak in mid-February. From Feb 17th through June 1st, the Fed added $3 trillion or a staggering $39bn a day, swelling the balance sheet to about $7 trillion as of the end of June.
In our June publication, Value Investing & Manias, Kailash gave readers market-beating advice. First, we explained that the immense outperformance of growth stocks over value stocks placed performance spreads and market concentration in the 99th percentile of history. But then one of our conclusions was that investors, convinced “this time was different” (not a conclusion Kailash is comfortable with), should “…buy the ~25% of firms with the highest price to sales ratios that have driven growth’s performance to valuations last seen at the peak of the internet bubble.” In so doing, we encouraged people who thought value was “dead” to chase growth stocks that must contend with simple math, as explained in a terrific article written by Fortune’s Shawn Tully.4 In the few weeks since growth has risen at a 37% annualized rate while value has declined at a 37% annualized rate.5
The Rich (expensive growth) Get Richer…and Poorer
Kailash wanted to see if our contention that the market’s most richly valued stocks are growing richer was, in fact, correct. In our 2012 publication The Siren Song of Growth, Kailash documented that the world of growth investing was prone to more diffuse outcomes with the percent of names that were the biggest winners and losers dominating the group at the expense of firms with more prosaic outcomes.
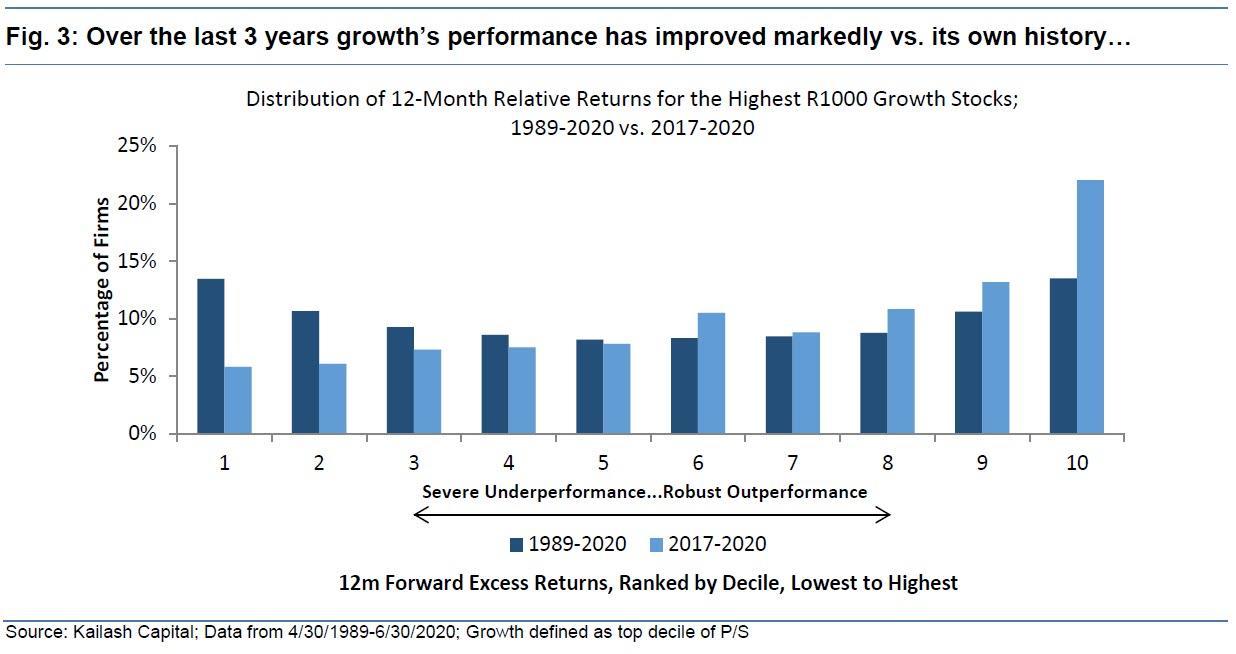
The horizontal axis in Fig. 3 is broken up into the deciles of 12-month relative returns ranked from worst to best. The navy-blue bars show the distribution of the highest growth6 firms’ performance from worst (decile 1) to best (decile 10) between 1989 and today. You can see that over the long-haul, the high growth cohort has fat tails with 14% ending up in the worst decile and 14% in the highest decile. This is similar to our 2012 finding in Mid Cap Growth. When you buy into the most richly priced firms, you are more likely to win big or lose big.
The light-blue bars show the distribution of high growth firms in the 2017-2020 period. The change is startling. In the last 3.5 years, buying the highest growth firms has been an extraordinarily successful tactic. Just shy of 25% of the most expensive firms have been in the best decile of returns (decile 10) while only 6% have landed in the worst returns. Investors that believe this time is different are betting that highly unusual payoffs like this are the “new normal” and therefore, likely to persist.
Although denizens of Big Data might be dismissive of our historically informed approach to valuation, Kailash is going to join the crowd currently so out of fashion. In a CNBC article dismissing concerns expressed by Jeremy Grantham, David Tepper, Stanley Druckenmiller, Cliff Asness, and Howard Marks that today’s market was in bubble territory, the author gave a healthy endorsement of Jim Cramer’s view that retail investors could successfully speculate.7 Kailash is not here to judge the abilities of a broad cohort of investors we cannot identify. We will state that dismissing the views of a long list of the world’s most successful investors with a statement that these “…prophecies of doom…could dissuade smaller investors from participating in the market – participation that, yes, often brings tough but useful lessons in short-term loss”8 might be a dubious argument. [Emphasis ours]
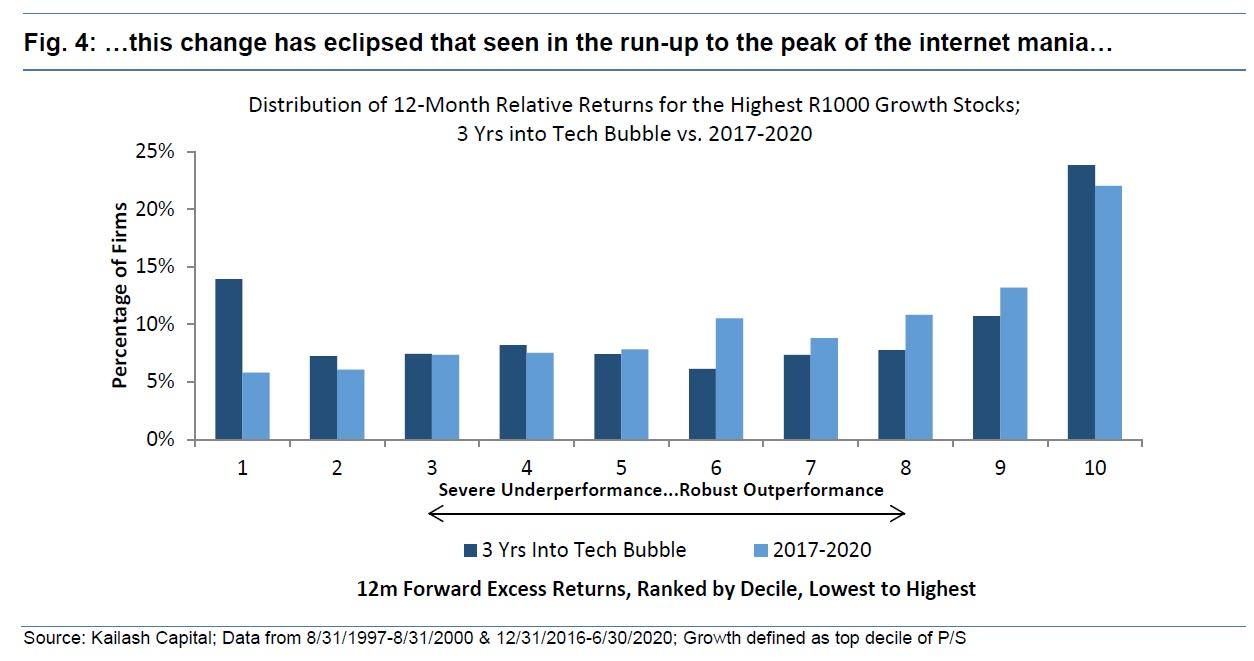
Figure 4 keeps the distribution of returns of the most expensive stocks in the 2017-2020 period from above (light blue bars). The chart swaps out the 1989-2020 distribution of the market’s most expensive firms with the performance of the most expensive firms distribution in the three years leading up to the peak of the internet bubble. Incredibly, the payoffs to buying the market’s most expensive firms in the post-2017 period are better than they were in the internet mania. Investors betting on the most expensive firms in the recent past had only a 5% chance of ending up in the bottom decile of returns, whereas even at the height of the internet mania, nearly 15%, or 3x as many firms, ended up in the worst decile. The performance of today’s highfliers has eclipsed their performance into the height of the internet bubble.
Kailash refers our readers to Fig. 5 below to bring concrete proof to CNBC’s Michael Santoli’s comment that retail speculation does indeed “…often bring tough but useful lessons in short-term loss.” Figure 5 below shows the distribution of the high-flyers in the three years following the peak of the internet bubble. The winning strategy of buying the high-flyers turned into a proverbial blood-bath with nearly 50% of the firms landing in the worst two deciles of returns and less than 5% making an appearance in the top decile.
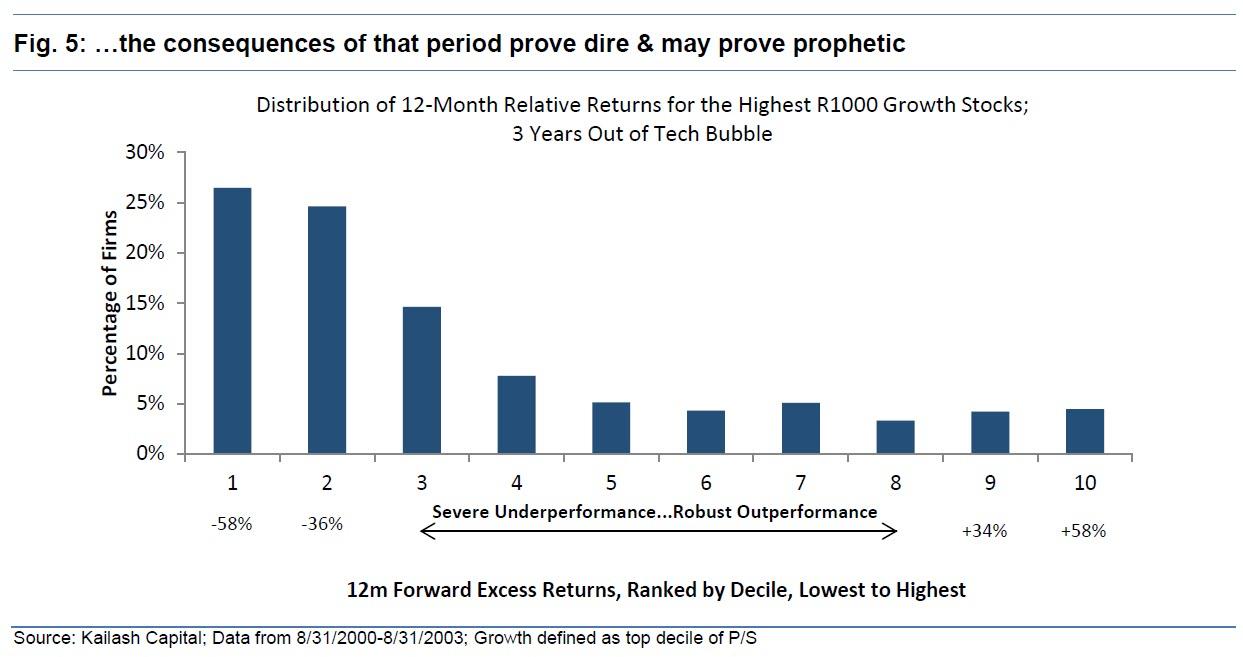
Figure 6 below shows the basic fundamental features of the firms in the top decile of price to sales at the peak of the internet mania, today, and the historical average. Looking at the data below is informative of just how similar today is with the peak of the internet mania. The most expensive firms in the market today, like in August of 2000, generate no FCF, are loss-making and carry the associated negative ROEs and ROAs, and are diluting shareholders to fund operations. At first pass, the price to sales ratio of 21.1x might seem “cheap” sitting right under the 90.1x multiple at the peak of the internet bubble. Kailash would note the following:
-
21.1x sales is a level seen in less than 10% of all months
-
In the internet mania, the mechanics of the move from ~20x sales to 90x sales was not all returns-driven multiple expansion (much of it was due to rebalancing)
-
The most expensive decile of price to sales jumped from 30x sales to 87x sales in only 1 month before peaking at 90x sales 2 months later
-
For those interested, please see our upcoming paper which will explain in detail how 20x price to sales offers limited if any, improvement for investors over firms at 90x price to sales

Conclusions:
This market has been very similar to prior manias, specifically the internet bubble, that prove time and again just how difficult market timing can be. As demonstrated in the simple exhibits above, our conclusions are:
-
Growths run vs. value is greater today than into the peak of the internet mania
-
Similar to the dot.com bubble, most of the outperformance has occurred in the last 3 years
-
The distribution to returns is even more extreme than into the peak of the internet mania
-
Post the peak of the internet mania, the incredibly high returns to growth reversed with disastrous consequences
-
Valuations for the highest growth firms appear nearly as vulnerable today as they did at the peak of the internet bubble
With spreads between value and growth at record levels and an explosion of speculative listings through IPOs and SPACs underway, today’s market environment shares numerous features with prior peaks in 2000 and 2007.9,10,11 Kailash will be publishing a piece within the next two weeks taking a more detailed look at just how precarious the market’s most promiscuously priced growth stocks are despite what some would suggest is a difficult economic, political, and social backdrop.
* * *
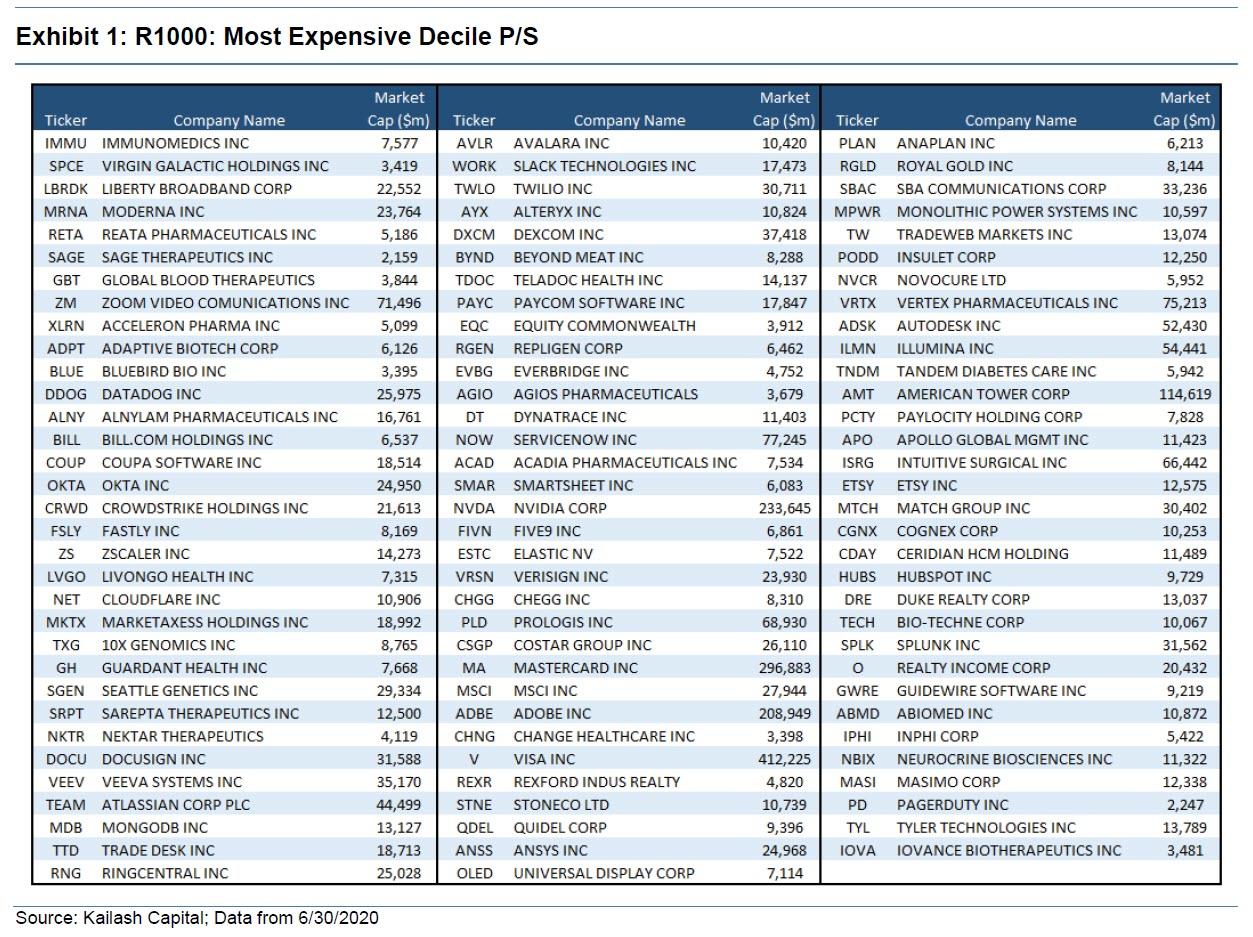
For a list of the Most Expensive Decile on P/S in the Kailash R1000 universe, please see the exhibit below.
Footnotes:
1 BlackRock Quant Sees Stock Valuation a Mystery Not Worth Solving
2 Everybody Lies, Big Data, New Data, and What the Internet Can Tell Us About Who We Really Are, -Seth Stephems-Davidowitz
3 Buffett Letter to Partners, 1967, Page 4
4 Fortune Magazine, June 30 2020, “After Apple’s stratospheric rise, investors are facing a new threat: Simple math”, by Shawn Tully https://fortune.com/2020/06/30/apple-stock-aapl-shares-whats-next-coron…
5 06/08-07/24, R1G rose 4% while R1V fell -5.66%, 36.52% and -37.04% respectively
6 High growth is defined as the top decile of price to sales, a method we used in Growth vs. Value to avoid the academically inclined and needlessly complex (in our view) price to book ratio
7 https://www.cnbc.com/2020/06/19/the-stock-market-may-be-pricey-but-its-…
8 https://www.cnbc.com/2020/06/19/the-stock-market-may-be-pricey-but-its-…
9 https://www.wsj.com/articles/blank-check-ipos-hit-new-record-11574441671
10 https://www.bloomberg.com/news/articles/2020-07-14/ipos-boom-with-pande…
11 https://news.bloomberglaw.com/bloomberg-law-analysis/analysis-ipo-marke…
via ZeroHedge News https://ift.tt/31dMdM2 Tyler Durden