3 Reasons Treasury Rates Can Still Hit 0%: Part II
Tyler Durden
Wed, 08/05/2020 – 17:40
By Eric Basmajian of EPB Macro Research
- Deflation remains a more credible risk, not inflation. The output gap suggests core inflation could sink below 0.5% in the coming years.
- FX hedged Treasury yields remain higher than yields at home. This will increase foreign appetite for US rates.
- From a longer-term secular standpoint, economic growth will fall into a new regime, sub 2%, which will weigh on bond yields.
- Further stimulus from the fiscal side will delay the full extent of the deflationary output gap but will not change the end result in the final analysis.
- As part of your balanced portfolio, long-term Treasury bonds are still a valuable holding as the path to 0% remains a probable scenario.
In Part II of this three-part series, we continue to explore three main factors that will continue to push Treasury rates lower, possibly near 0% on the long-end of the curve.
In Part I, we covered the inflation vs. deflation debate and argued that deflation was the more immediate risk. First, we covered a variety of the common inflationary arguments and debunked many of the poorly formed hypotheses before highlighting the output gap as the most reliable variable for long-run inflation analysis.
Part II will cover FX-hedged Treasury yields and show that US yields are higher than yields at home for Japanese and European investors after considering the currency hedge. Many analysts make the mistake of comparing US yields to Japanese yields without accounting for the currency hedge, which is not an “apples to apples” comparison.
Below we’ll cover the current situation regarding FX-hedged US rates and why this is another factor that will help keep a lid on US interest rates or continue to push them closer to the zero-lower-bound “ZLB.”
FX-Hedged Treasury Rates
When comparing cross border investments, accounting for fluctuations in the currency cross rate is a critical yet overlooked part of the puzzle.
If an investor in Japan wants to consider buying 10-year Japanese government bonds “JGBs” or 10-year US Treasury bonds “USTs,” comparing the yield on each is not sufficient.
If a Japanese investor buys JGBs, they take on interest rate risk. If the same Japanese investors cross the border and buy USTs, they now take both US interest rate risk and the risk of currency fluctuation between the US Dollar and the Yen. Therefore, we cannot compare two risks to one risk.
The chart below shows the 10-year US Treasury yield (white) and the 10-year JGB yield (yellow).
For the last 10-years, UST yields were higher than JGB yields, but this does not mean that “Japanese yields were keeping US rates low” as the common argument flows.
US Rates Vs. Japanese Rates (10-Year %):

To make a direct comparison between one risk factor, interest rates, we must account for the cost of hedging the currency fluctuation between the US Dollar and the Yen.
This applies less to individual retail investors looking to invest their savings in various global bonds as compared to institutional investment funds allocating billions of dollars.
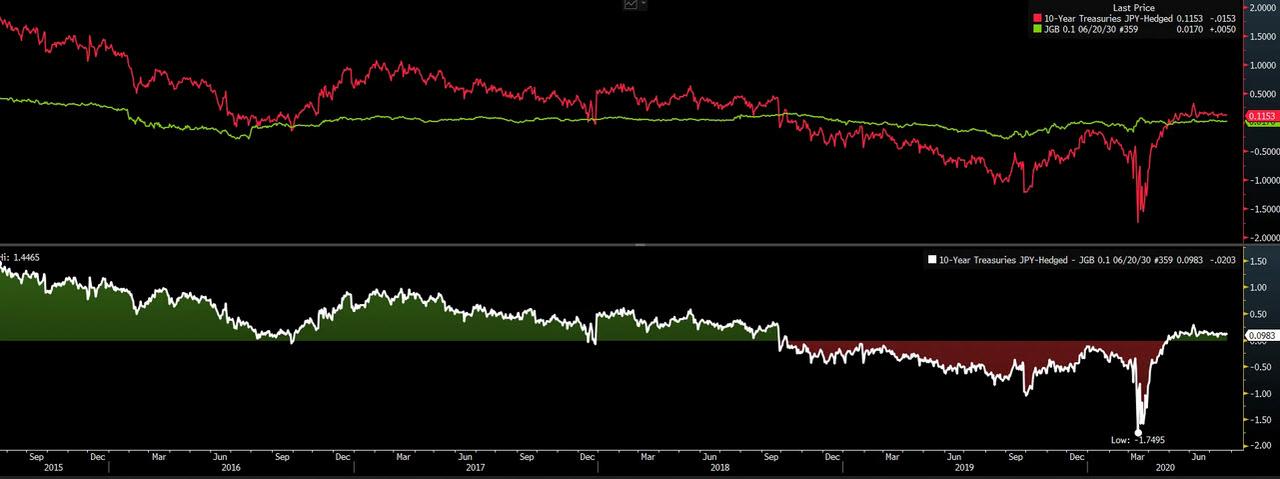
If we net out the cost of the currency hedge and therefore remove the currency risk of the USD vs. Yen, we can see that the remaining yield on a UST drops from its current ~60bps to ~11bps (red line). The Japanese investor now can consider US interest rate risk and a yield of ~11bps or Japanese interest rate risk for a yield of ~1bps. The currency risk is hedged.
The bottom panel in the chart below takes the difference between US yields after the currency hedge and Japanese yields. When the bottom panel is in green, UST yields are higher than JGB yields even after accounting for the currency hedge. A set up in which foreign investors can take no currency risk but gain extra yield with US rates will increase flows into US assets, all else equal.
US Rates (Hedged) Vs. Japanese Rates (10-Year %):

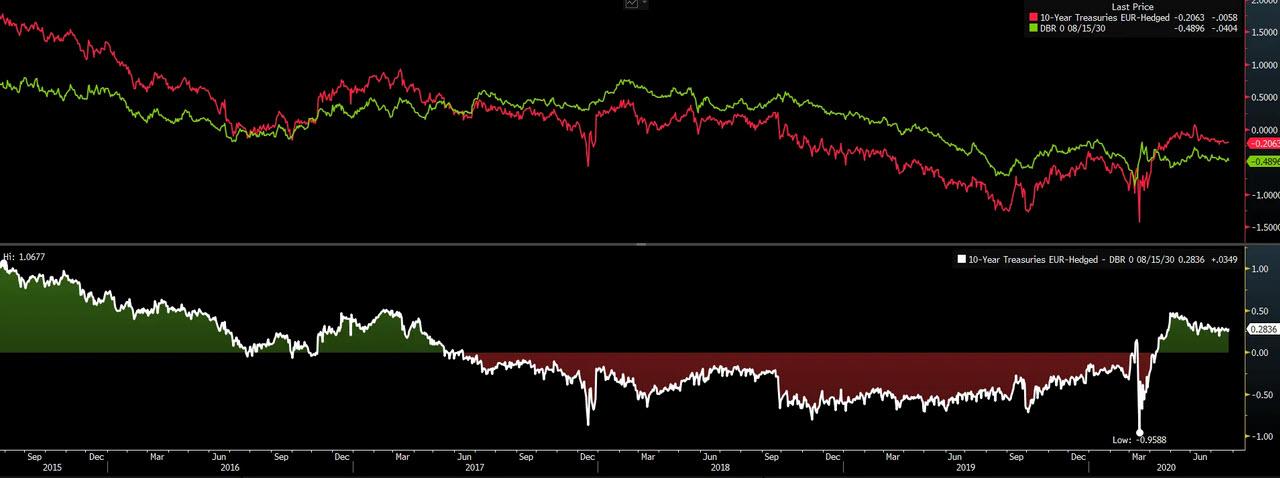
A similar dynamic can be observed below when comparing UST yields to German Bund yields and accounting for the cost of hedging the moves between the USD and the Euro.
US Rates (Hedged) Vs. German Rates (10-Year %):

While the same concepts apply, for the rest of this note, we’ll be analyzing USTs vs. JGBs.
A classic currency hedge takes the difference between 3-month LIBOR rates and adds the cross-currency basis.
The chart below shows USD 3M LIBOR (in pink), JPY 3M LIBOR (in yellow), and the difference between the two rates (in green).
When US short-term interest rates were rising, the spread between USD 3M LIBOR and JPY 3M LIBOR was several hundred basis points wide, adding to what was a costly currency hedge.
USD 3M Libor vs. JPY 3M LIBOR:

The chart below shows the JPY-USD basis, the last factor in the standard currency hedge.
A “blow-out” in the currency basis in March increased the hedging cost for foreign investors and may have contributed to a sharper sell-off in US Treasury bonds.
JPY-USD BS (3M v 3M) 3M:

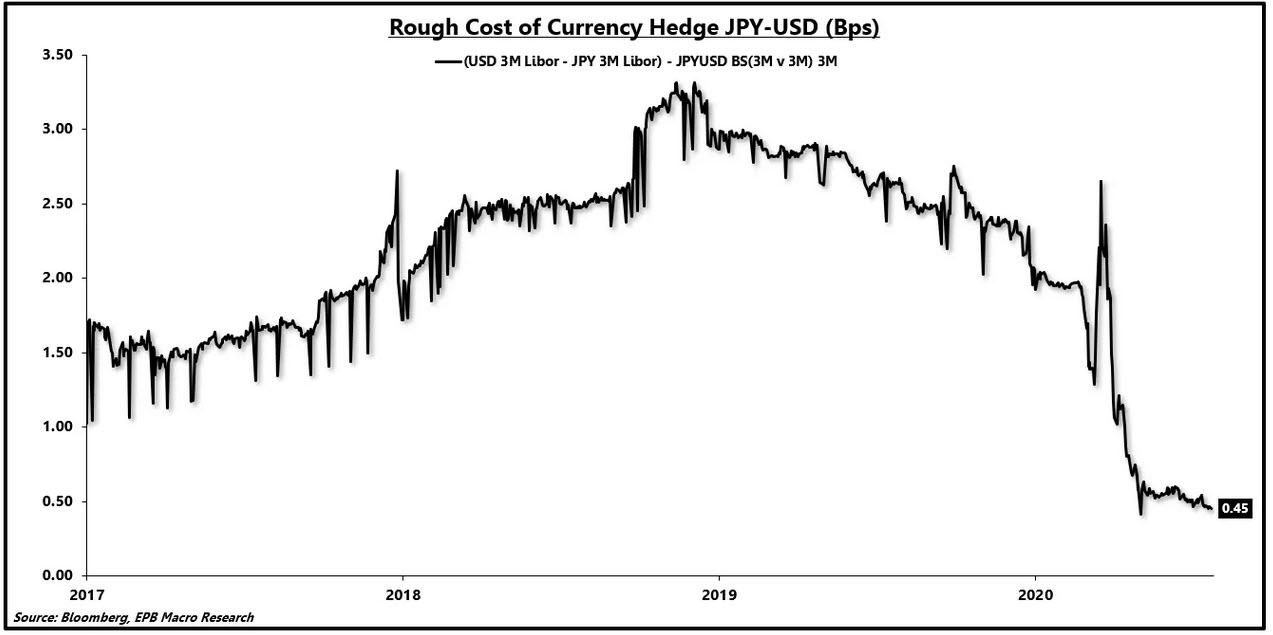
The chart below shows the estimated cost of the currency hedge for a Japanese investor in US Treasury bonds. At the end of 2018, when US short-term interest rates peaked and held the widest spread over Japanese short-term rates, the currency hedge was over 300bps.
Chris Whalen of The Institutional Risk Analyst recently wrote an article on MMT and negative interest rates. In that article, Whalen quotes Ralph Delguidice of Pavilion Global Markets discussing the interplay between the Treasury General Account “TGA,” the Federal Reserve Balance Sheet, and USD funding markets.
Delguidice forecasts:
”The key takeaway here now becomes clear. If a 25% contraction in system-wide reserves was insufficient to raise USD funding costs in any of the money markets used to provide leverage to buyers of US assets, what is the likely impact of a huge reversal in these liquidity flows when the Treasury spends down the account? Funds will flow back into a global USD market still saturated with cheap funding, and carry trades will become that much more attractive to foreign buyers as hedge costs fall and even go negative.”
Estimated Cost of Currency Hedge JPY-USD (Bps):

Delguidice is suggesting that the cost of the currency hedge, which has fallen from over 3% to under 50bps, may continue to fall and even move into negative territory.
Such a development would entice foreign buyers to push UST rates lower until the hedged rate no longer looked attractive.
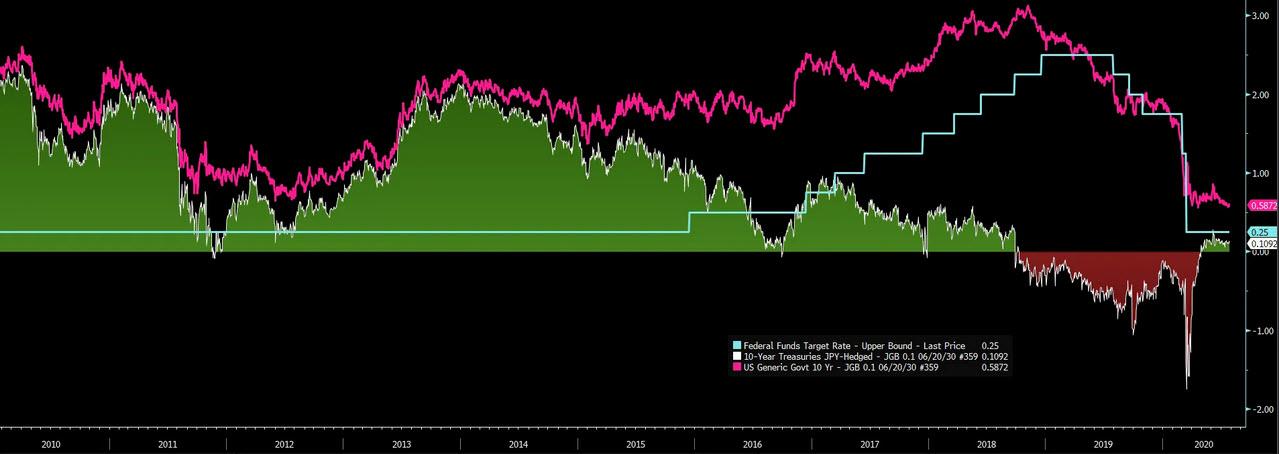
The chart below shows the difference between unhedged UST rates and JGB rates (in pink) and hedged UST rates vs. JGB rates (in green/red). The effective Federal Funds rate is graphed in blue.
Despite the widest spread between unhedged yields (in pink) at the end of 2018, the spread between hedged yields was negative and thus suggested that foreign buyers found US rates unattractive. Federal Reserve custody data of Foreign holdings of USTs corroborated that view.
10-Year Yield vs. 10-Year JBG Yield (Nominal & Hedged) & EFFR:

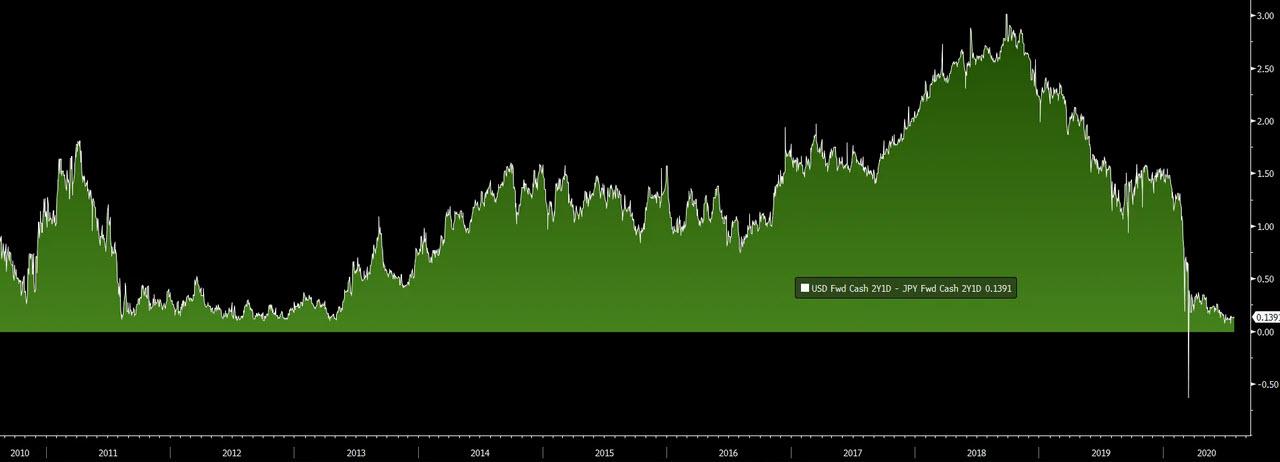
The following chart shows the spread between the market-implied policy rate two years ahead for the US and Japan. As the bond market becomes increasingly convinced that the Fed will be unable to raise short-term interest rates again, the spread between the US and Japan implied policy rates will converge to zero.
US & Japan 2-Year Forward Market Implied Policy Rate (Spread):

As Delguidice notes, among other factors, this will continue to reduce the hedging cost and allow foreign investors to pick up “free” extra yield with US rates until the market removes the delta between hedged USTs and JGBs. If the hedging cost moves closer to 0%, this implies that UST rates may also compress near JGB yields around the ZLB.
Other factors play into UST rates, including future policy expectations and inflation expectations. If the market becomes convinced that US short-term rates are going to be stuck at zero, and the US continues on a path of disinflation outlined in Part I, we should see the belly of the UST curve compress to the ZLB.
To read more and learn how we translate this research into a low-volatility portfolio, click the link for a two-week free trial of EPB Macro Research on Seeking Alpha.
via ZeroHedge News https://ift.tt/3gAiJOE Tyler Durden