“Panic-Buying…”
Tyler Durden
Mon, 08/31/2020 – 13:41
Authored by Sven Henrich via NorthmanTrader.com,
The panic buying we’re seeing in $TSLA and $APPL today, following the historic runs into the stock splits effective today, firms my view that we are setting up for something sinister in markets.
To be sure we live in strange times, even some bulls are capitulating giving up completely on rationalizing the Fed induced bubble price action. Today Tony Dwyer suspended all efforts to give price targets, in essence acknowledging that traditional valuations metrics no longer apply:
Tony Dwyer at Canaccord, who’s been bullish and has carried a “3300+” S&P 500 target, says this morning he is “withdrawing SPX targets because there is no precedent to how high valuations can go.”
— Michael Santoli (@michaelsantoli) August 31, 2020
Unlimited upside in a risk free market that keeps ignoring everything.
And hence it should come as no surprise that the market cap expansion machine keeps creating value out of nothing:
$TSLA and $AAPL adding another combined $94B in market cap in the first 90 minutes of trading.
— Sven Henrich (@NorthmanTrader) August 31, 2020
Extended buying pure and hence we end up with charts such as this:
On the last day of the month $NDX is trading 987 points or 8.9% above its upper monthly Bollinger band and 1,493 points or 14.1% above its monthly 5 EMA. pic.twitter.com/EWES3KTHL9
— Sven Henrich (@NorthmanTrader) August 31, 2020
This is the circus the Fed has unleashed.
So let’s all acknowledge that sentiment is vastly bullish and people are piling into select stocks with no regard to risk.
I say select stocks because the internal picture keeps showing dreadful weakness underneath, even in the almighty Nasdaq:
All of which brings me to a historic irony. Let’s recognize that the Fed has produced a liquidity machine that has pushed select indices to all time highs with most gains coming from a few tech stocks. Take those stocks out of the equation and $SPX is still flat on the year and most stocks are down on the year.
Viewed with this lens this multi month rally is not all that different than what we’ve seen in the past.
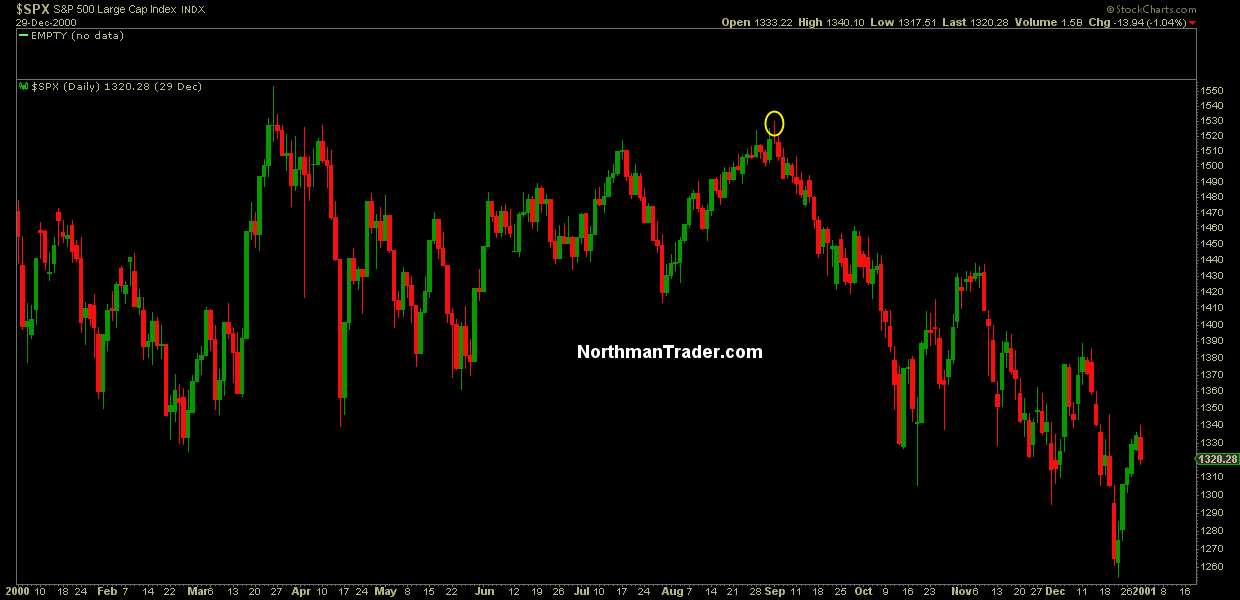
In fact, the precedence is striking in that the counter rally in the year 2000 peaked on September 1st following a furious rally in August. Sound familiar?
$SPX hit a peak of 1530 on that day as the worst was assumed to be over and optimism had come back roaring following the initial tech crash in March of that year.
But it was after September 1 that the real fun started and $SPX then commenced its long journey down that ended in October 2002 when $SPX bottomed at 798.55:
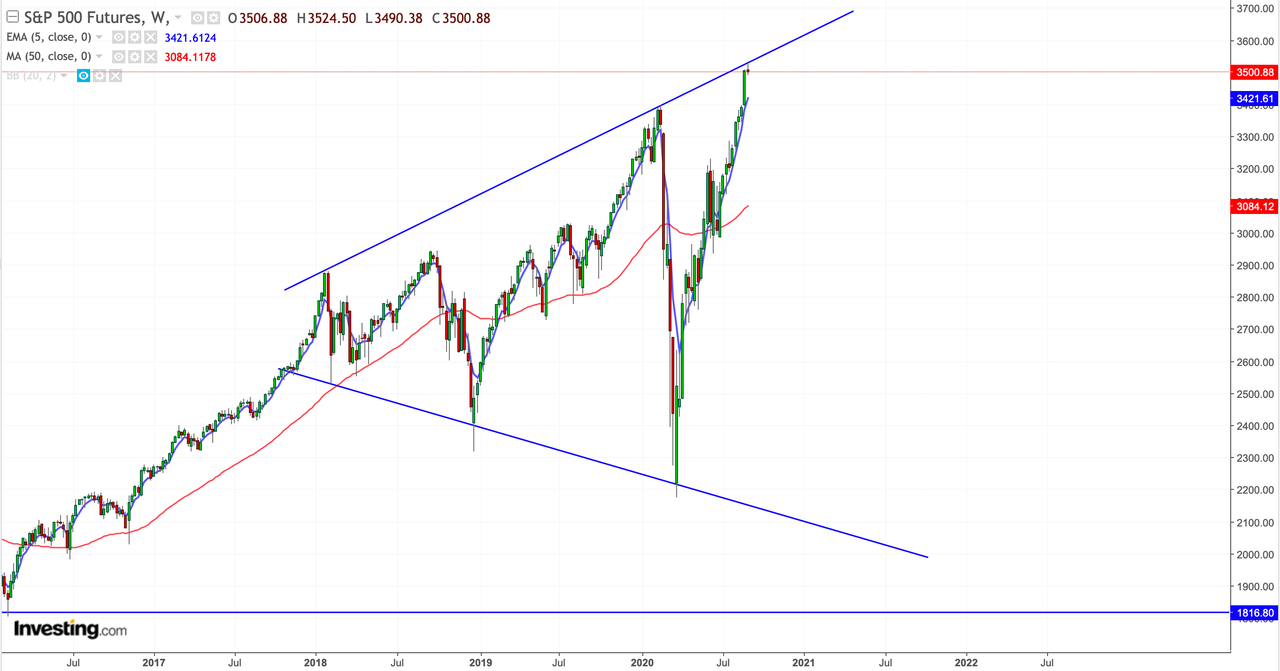
It is hence notable that $SPX is coming into the end of August and beginning of September approaching historic resistance. Indeed $ES tagged that resistance line in overnight and has sconce rejected as $NDX continues to make new all time highs:
It is the very chart I discussed in context and detail in The Jaws:
On the last day of the month $NDX is trading 987 points or 8.9% above its upper monthly Bollinger band and 1,493 points or 14.1% above its monthly 5 EMA. pic.twitter.com/EWES3KTHL9
— Sven Henrich (@NorthmanTrader) August 31, 2020
Who knows if history is still any guide in these times. If it is then the panic buying and optimism of these days is laying the groundwork for the tears that are to follow.
* * *
For the latest public analysis please visit NorthmanTrader. To subscribe to our market products please visit Services.
via ZeroHedge News https://ift.tt/2EyeYf9 Tyler Durden


