Goldman: This Is The Main Reason For “Meaningful Polling Errors”
Tyler Durden
Fri, 10/30/2020 – 12:25
With just 4 days left until the election, there are just two questions everyone is asking: 1) what are the polls showing and 2) are the polls even credible after the catastrophic experience in 2016.
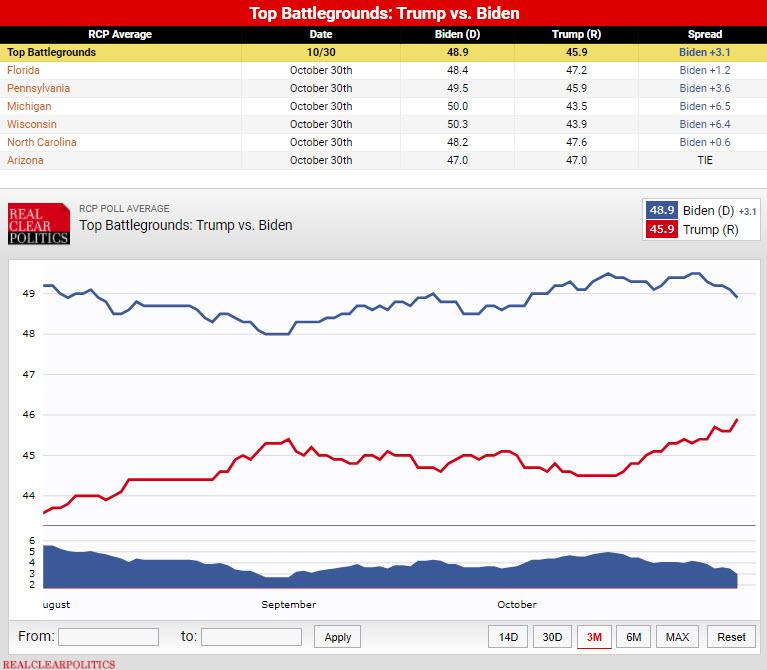
The answer to Q.1 is easy: with the electoral college contingent on the outcome of just a handful of battleground states, Biden continues to lead Trump across the must win states of FL, PA, MI, WI NC and AZ but his lead is shrinking according to the latest daily battleground polling summary from RCP:
Why are battleground states all that matter? Because while national polls – where Biden has a substantial lead – are indicative of popular vote outcomes, the Electoral College determines the winner, and as such polling margins in likely tipping point states are more important. Exhibit 1 shows the polling margin in three states that, when ranked in order of polling margin, would provide one candidate with the 270th electoral vote, averaged with the state ranked one higher and one lower. Using this method shows Joe Biden leading Donald Trump by around a 5pp margin, 4pp below his average margin in national polls, which rose sharply following the first Presidential Debate and President Trump’s coronavirus infection.
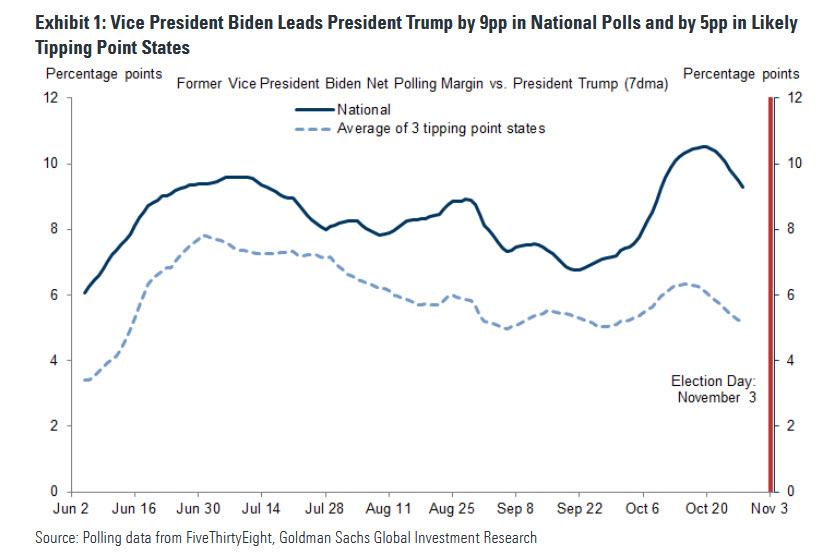
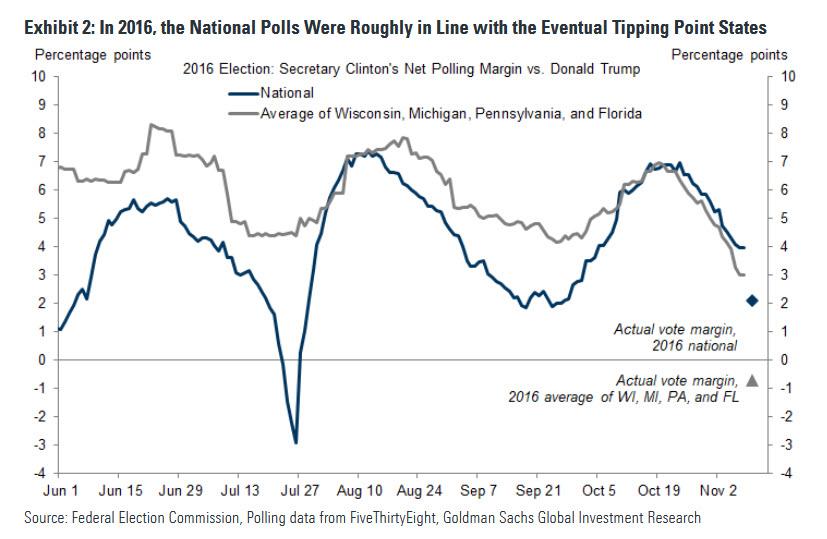
And although the national margin is higher this year compared to one week before Election Day in 2016, the eventual tipping point states polled at only a slightly narrower margin one week before Election Day. Compared to actual vote margins, in 2016 polls were off by 1-2pp nationally but by 4pp on average in Wisconsin, Michigan, Pennsylvania, and Florida.
Which leads us to “question 2”, or just credible are the polls, and here the answer is far more complex as becomes clear when looking at the wide gap between prediction markets and polls. According to Goldman, this gap exists for two reasons.
- First, polls in likely “tipping point states” that will determine the electoral college winner show Biden with a smaller lead than in national polls.
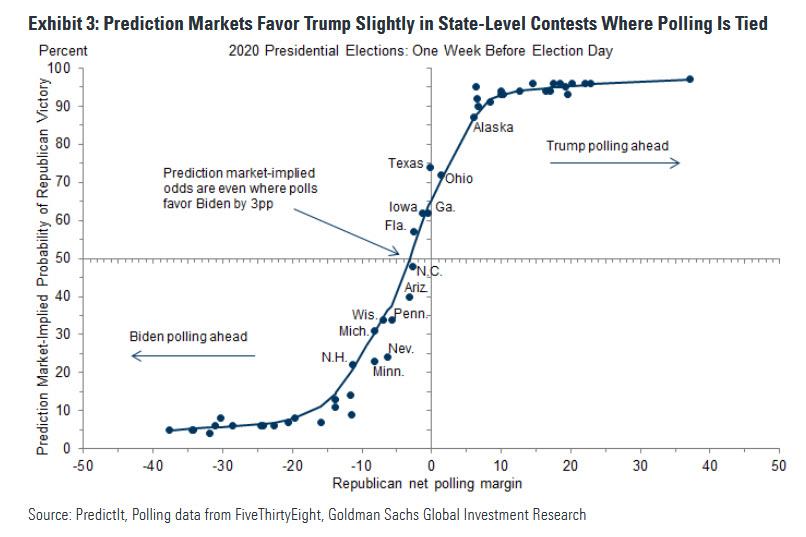
- Second, prediction markets appear to build in an expectation that President Trump will outperform the polls by at least 3pp. For example, they show roughly even odds in states where Biden leads by that much, and they give President Trump the advantage in states where polls are tied.
Stated otherwise, prediction markets to expect President Trump to outperform today’s polls. Remarkably, at the state level, prediction markets on average assign a roughly equal probability that President Trump or Vice President Biden will win states where Biden leads by about 3pp (see the chart below, where the locally-weighted regression line crosses the x-axis). This trend has moved by about 1pp further in President Trump’s favor over the past month. In states where polling averages are basically tied, prediction markets favor Trump with about a 65% chance of winning. By contrast, ahead of the 2016 election, prediction markets did not lean conspicuously in either direction.
Looking closer at historical data, Goldman writes that whereas “state-level polls from presidential elections from 1992 to 2016 show that roughly a week before the election, a candidate leading with a 2pp margin won that state around three times out of four”, all this changed in 2016 when this relationship collapsed.
In fact, the 2016 results account for about a third of all misses since 2000, when errors were almost all to one side: as a reminder, Hillary Clinton led final pre-election polling averages by 6pp in Wisconsin, 3pp in Michigan, 2pp in Pennsylvania, all states that President Trump ultimately won. A similarly lopsided pattern exists for 2008—also an election with no incumbent candidate following a two-term president—when polls missed by understating the level of support for the non-incumbent party (Democratic) candidate.
This year, one explanation for Trump’s understated true level of support is because respondents are reluctant to report their actual views. A recent polling experiment that conducted identical surveys by live callers and anonymous online methods found little evidence for this “shy Trump voter” hypothesis. The chart below shows Goldman’s own simple comparison of the median presidential approval rating obtained through live interviews with the median rating obtained through automated interactive voice response (IVR) and online polls. This shows a gap of 1-2 points over the last few months, though with only 8-9 polls in each group each month this could be statistical noise.

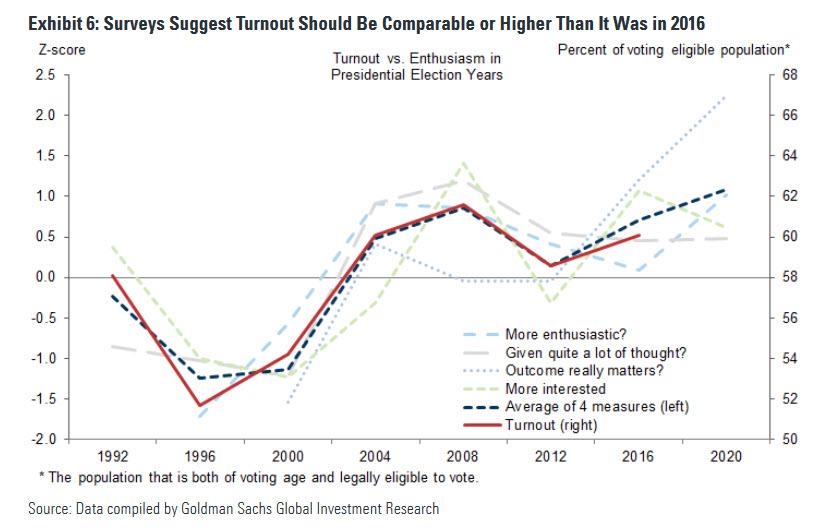
Another likely source of polling error, according to Goldman economists, are the assumptions that pollsters are making regarding turnout. Most survey-based indicators suggest that turnout should be at least comparable, and probably higher than, it was in the 2016 election. Additionally, early voting data suggests turnout is already approaching or exceeding the total vote in 2016 in some regions.
Adding to the complexity, this year the effect of the coronavirus pandemic on voting makes predicting turnout more difficult than usual. In particular, the greater reliance on mail voting increases uncertainty this year, as it is relatively untested on a large scale in some states. 54% of Democrats but only 23% of Republicans in swing states (AZ, FL, MI, NC, PA, and WI) report that they are likely to vote by mail this year. Nationally, mail ballots have been returned in roughly this proportion so far.
According to Goldman, this creates a two-way dynamic of uncertainty:
The large differential in voting method between parties creates additional uncertainty. Problems with mail voting or potential legal challenges would likely disproportionately affect Democratic voters. That said, the recent COVID resurgence could also affect in-person voting on Election Day, which could reduce Republican turnout on net.
Perhaps, but there is yet another reason why the polls may be just as wrong as they were in 2016, as was revealed by a recent AAPOR study which found that some state-level polls failed to weight their samples by education. Specifically, it found that white voters and college graduates have been consistently over-represented in telephone poll samples. The switch from landlines to cellphone-only households has led to an over-representation of older voters as well. Pollsters can weight responses based on census data or voter files to adjust for this, though some polls, particularly those at the state level, did not weight for education in 2016. According to Goldman, “the partisan education gap that has widened in the last few elections has made this a more important factor, and appears to be one the of the main reasons for the meaningful polling errors in Rust Belt states that year.“
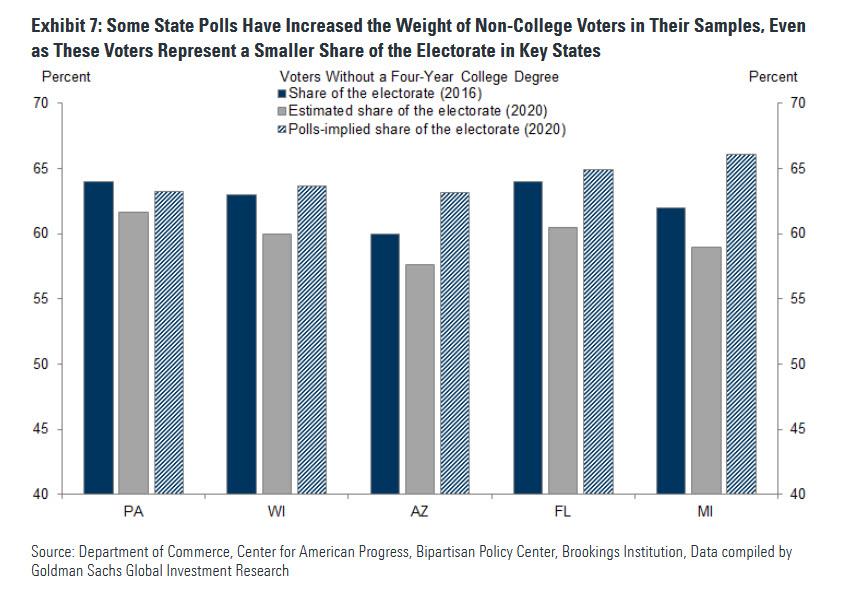
Here Goldman’s Hatzius proposes that more pollsters have weighted state-level polls for education this year than in 2016, and using poll weights data suggest that “pollsters are matching or even slightly overweighting the actual share of the electorate without a college degree compared with 2016” even though he speculates that “all else equal the share of the electorate in 2020 without a college degree should be slightly smaller than it was four years ago.”
Of course, such an assessment is also based on upstream guesses and as 2016 revealed, even one incorrect assumption topples the entire polling framework and leads to false answers.
Finally, Goldman observes that while financial market participants are taking a view on the election outcome which is similar to online prediction markets…
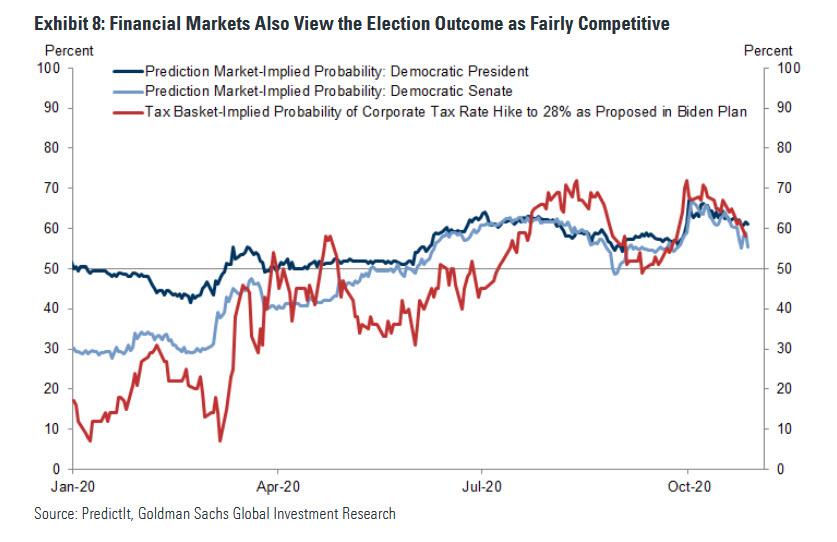
… “the implied probabilities suggest that they, like prediction markets, are taking a somewhat more cautious view of the publicly available polling data.”
In short, it remains virtually impossible to derive firm conclusions and for those seeking to at least follow momentum if not absolute levels, we redirect you to what we published last Friday was the most important chart of the 2020 election, which was from Cascend and showed state-level estimates of outcomes.
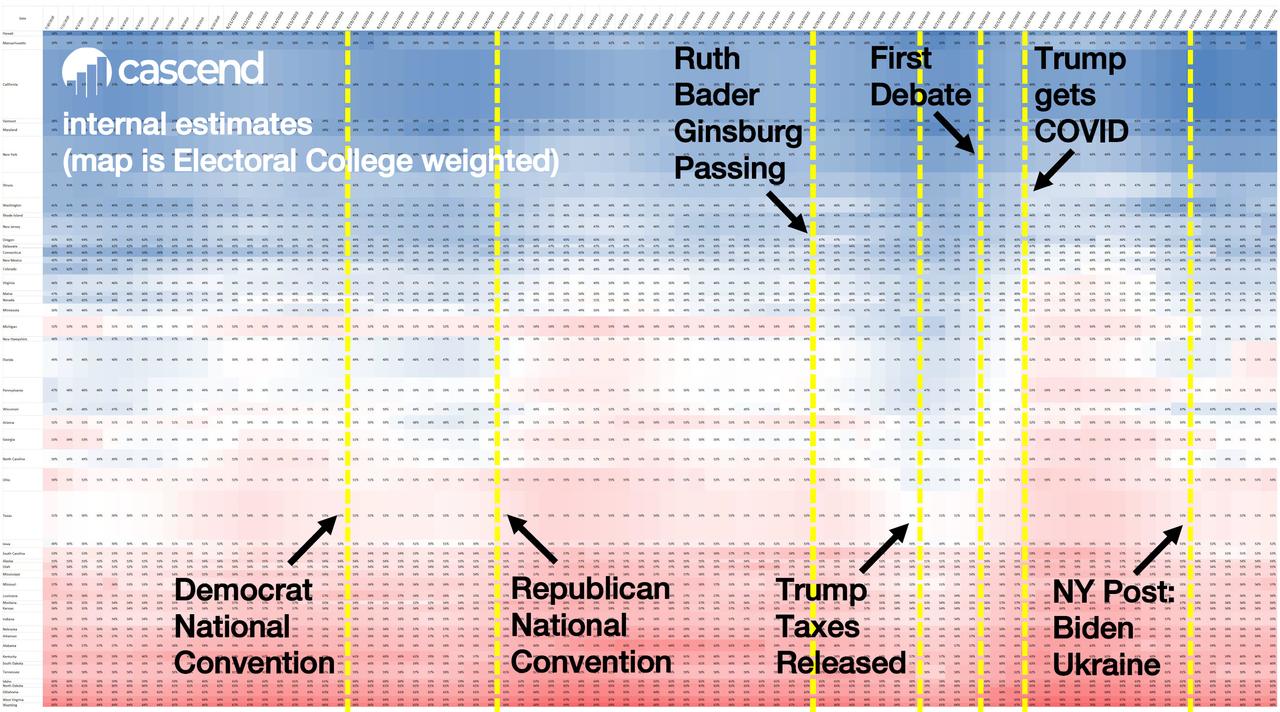
What it found was that an increasing number of states are now swing states (and will decide this election)
- Florida (2.9% to Trump)
- Pennsylvania (+1.8% to Trump)
- Georgia (+0.4% to Trump)
But…
- Arizona (+0.2% to Biden)
- North Carolina (+0.1 to Biden)
- Michigan (+1.4% to Biden)
- New Hampshire (+1.6% to Biden)
- Minnesota (2.0% to Biden)
- South Carolina (2.2% to Biden)
- Nevada (2.4% to Biden)
- Maine (2.6% to Biden)
- Wisconsin (2.7% to Biden)
… in other words, just days before Nov 3, the outcome remains a complete toss-up.
via ZeroHedge News https://ift.tt/32eu16n Tyler Durden