“This Is An Unprecedented, Bad Combo”: Why Some Traders See A “Shock” Growth Hit Dead Ahead
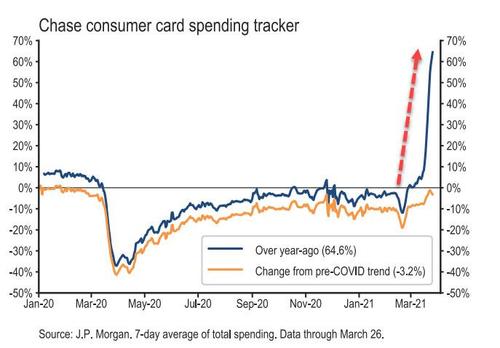
Over the weekend, we explained why both Goldman and JPM expect economic activity in April and May to top “Anything We’ll See In Our Careers”, on the back of four main factors: i) continued stimulus injections, ii) $1.5tn in ‘excess’ savings, which Goldman expects that to rise to about $2.4tn, or 11% of GDP, iii) a record share of respondents planning to purchase a home in the coming months, and iv) $4.44 trilion currently sitting in US money market fund.
But what happens then… Will the record stimulus tailwind – and soaring inpuct costs – become a margin-crushing headwind which will hammer the economy in the second half?
As SocGen’s resident permabear Albert Edwards writes in a note today titled “Intoxicated by the fiscal package, investors can’t see what lies dead ahead”, if one reads the financial press “most commentators believe we are set for a repeat of the Roaring Twenties, most especially in the US. “Optimism abounds that the consumer will unleash a wave of pent-up spending as economies reopen, backed by a handy stash of surplus savings. Combined with a new ‘can-do’ (or rather a ‘can-spend’) attitude of the fiscal authorities, all things economic and cyclical look tickety-boo – if not a tad frothy”, Edwards writes.
To be sure, optimism about the economy is backed up by some extraordinarily robust ISM data: as Edwards details, the surge in both the US manufacturing and services ISMs into the mid- 60s has brought them up to levels not seen since 1983 when the US economy charged out of a savage double-dip recession. Even in semi-shutdown Europe, the eurozone PMI output composite has hit its highest level since records began (in 1998). These are robust data indeed. It is therefore understandable then why markets have responded with heady abandon to this flood of strong economic data.
Here, as an aside, the SocGen strategist writes that he always hesitates “to use the words ‘good news’ to describe strong economic data. My own observation from almost four decades in the markets is that when economists and strategists describe ‘good news’, they introduce a behavioural bias into their analysis because they then become reluctant to forecast ‘bad’ news – with some notable exceptions!”
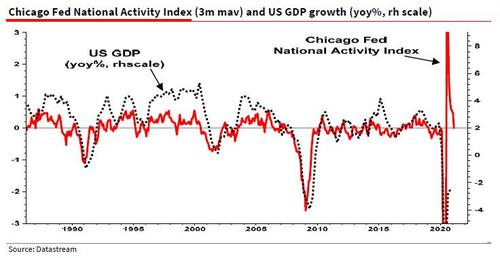
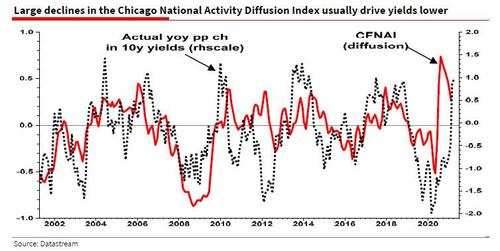
In any case, as a result of this hope of a repeat of the Roaring Twenties (which as Rabobank’s Eric Peters frequently reminds us didn’t end so well) investors are riding a cyclical wave that may now be cresting. Hence, “instead of strong growth and rising bond yields being the main threat to equities, might it be the reverse” Edwards asks rhetorically and to prove his skepticism points not to the ISM but the Chicago Fed National Activity which has shown a remarkable disconnect from some other soaring high-frequency data indicators, to wit:
these blockbuster ISMs should be treated with some caution – because if after an economy has been shut down every respondent thought things were getting even a little better, then the ISMs would register the 100% maximum. Indeed, other more methodical surveys of economic activity tell an alternative story. For example, the highly regarded Chicago Fed National Activity Index collates 85 US economic indicators into an aggregate measure. It is calibrated so that zero represents trend GDP growth. As you can see below, economic activity in February has fallen back to trend – only around 2% or slightly below.
While the SocGen strategist concedes that this data may be an anomaly, he urges readers to “keep a very close eye on this as given the recent rally, the market is now very vulnerable to cyclical disappointment.”
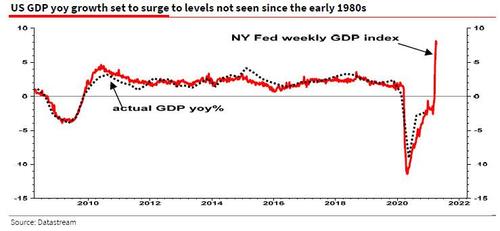
That said, nobody seems to worry for now, with Edwards chiming in that the market believes “we are going to see blockbuster, gangbuster, and perhaps even ghostbuster, GDP data for the next couple of quarters. That is now baked into the cake as is shown by the New York Weekly Economic Index – calibrated to equate to yoy GDP growth.”
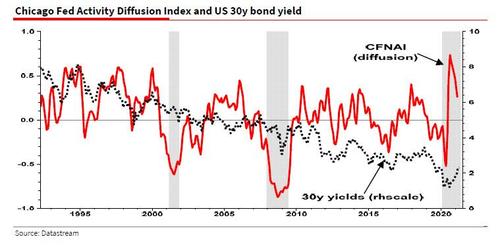
This, however, again brings us back to the question we asked at the top: what happens after the likely strong H1 data? Here, Edwards writes that the slowdown in the Chicago Fed Activity indicator shown above is confirmed by their own diffusion index of data outturns. This shows a downturn, which if it continues would traditionally trigger a fall in bond yields – even outside of recession (shaded areas).
This can be seen more clearly from this chart which looks at the yoy change in 10y yields.
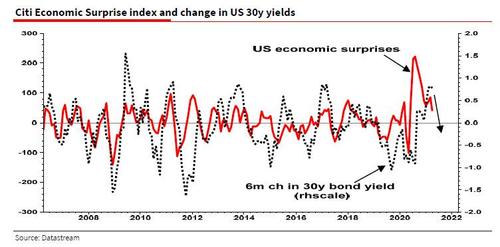
Commenting on the chart below, Edwards notes that “the surge in stronger than expected economic data has reversed recently and at the very least this suggests the bond market sell-off might abate or even reverse somewhat.”
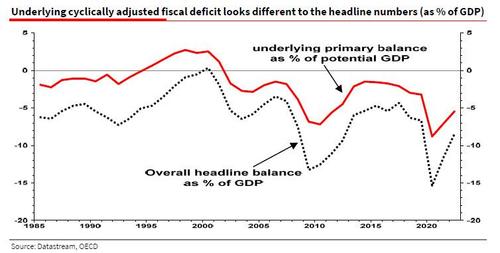
The above may explain why 10Y returns, after tumbling by the most on record in Q1, have rebounded strongly in Q2 with 10Y yields sliding. It also why Edwards warns that “investors might be caught out by weaker than expected growth as soon as H2” especially when considering the potential near-term impact of the Biden stimulus which – as Edwards reminds us based on CBO calculations – shows that the headline $1.9tr package or “10% of GDP”, working out to only a moderate 4% of GDP this year.”
To be sure, if it was just Albert Edwards warning about a sharp growth scare in the near-term it would be easy to dismiss it as the repetitive ramblings of a Wall Street permabear. But it’s not just him: one of Wall Street most prominent bulls joins the loud warning.
In his latest Weekly Warm Up note, Morgan Stanley chief equity strategist Michael Wilson picks up where Edwards ends, and also extends on a point he made recently, when he noted that he expects the current cycle to be especially short. It’s why his latest note focuses on what he believes will be a “Faster and Sooner than Normal Early to Mid Cycle Transition.” Only unlike Edwards who focuses on growth indicators, Wilson takes aim at the current rampant inflation which many fear could mutate into outright stagflation:
We continue to hear anecdotal evidence that costs are rising for many key inputs for companies – materials, logistics, labor, etc. Last week’s Manufacturing PMIs shed further light on how acute these cost pressures may become over the next few months. While we may be a little early, we believe now is the time to shift one’s portfolio up the quality curve while liquidity remains flush and before these supply/margin issues become more obvious.
Echoing what we said in “”Things Are Out Of Control” – There Is A Shortage Of Everything And Prices Are Soaring“, the Morgan Stanley strategist writes that he continues to see “growing evidence that supply shortages are emerging all over the economy, many of which will lead to either margin pressure or missed sales altogether.”
And while Wilson – like Edwards – has little doubt that the economy is ready to boom at this point with March’s Manufacturing Purchasing Manager Index rising to its highest level in 28 years, he cautions that “with this increase we are also seeing some of the highest prices paid and lowest supplier delivery readings as well. This is an unprecedented and potentially bad combo in our view.”
Why is this a bad combo?
Because according to Wilson, this arguing for “a faster shift to mid from early cycle economic and market dynamics” an observation the MS strategist made previously, and which is now further supported by last week’s release of March’s Purchasing Manager survey.
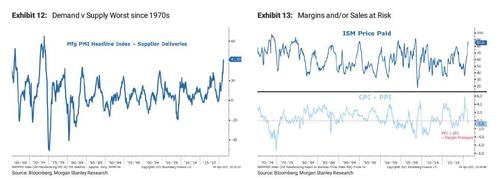
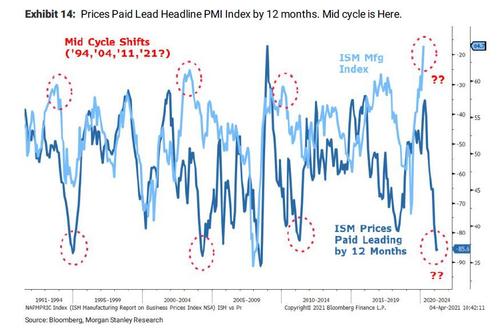
Exhibit 11 is perhaps the best way to illustrate this timing using the PMI. Very simplistically, what it shows is that the prices paid component leads the headline index by approximately 12 months. As Wilson warns, “given the extreme readings in both measures today, there is a good chance the PMI headline index isn’t just peaking but falls significantly over the next 12 months as these higher prices either squash margins or demand or both.”
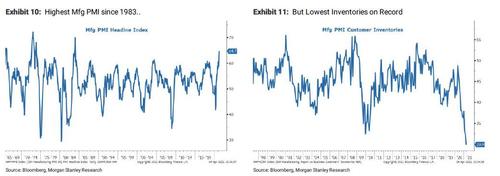
Another way of putting this divergence in traditional economic terms, the demand vs supply imbalance is now the worst since the 1970s, putting both corporate margins and sales at significant risk. Translation: earnings reports one year from today will be very ugly.
To be sure, this is a normal response after the initial surge from recession–i.e. as we experienced in 1994, 2004 and 2011 in the 3 prior cycles, and to Wilson, there is “no reason why it should be different this time. Surges in prices paid can also be a leading indicator for the end of the cycle like in mid 2018 or early 2000.”
To be clear, we do not think that is the case which suggests this will be a buying opportunity but one worth waiting for despite what the consensus currently believes as we made new highs last week.
Tyler Durden
Thu, 04/08/2021 – 15:50
via ZeroHedge News https://ift.tt/3dNxKMR Tyler Durden
