Sell In May But Rush Back For July
By Jim Reid, head of credit strategy at Deutsche Bank
As it’s now May, it’s worth examining the “sell in May and go away” adage.
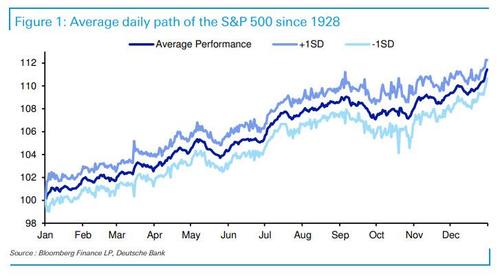
Today’s Chart of the Day looks at the average daily path of the S&P 500 using data back to 1928. It shows that using 93 years of data, the “average” year does see its first notable correction in mid-May with the index only surpassing these levels again by early July. However, by early August the upward trend seen between January and April seems to have been restored.
This carries on until mid-September when the second notable yearly correction occurs. This ‘pause’ seems to last longer with the market not clearing these levels again for the last time until mid-December.
The Santa Claus rally then takes hold and we power back close to the January to mid-September trend line into year-end.
In terms of volatility, there is no doubt that the ‘average’ year sees volatility pick up most between mid-September and mid-November with October historically quite extreme.
So there is a little bit of truth to the adage with May on average seeing the first correction of the year but then again July is historically one of the best months of the year.
DB thinks there will be a correction this summer but that’s due to growth rates peaking out not due to seasonals. You can see here to be reminded of the details behind the call.
Tyler Durden
Thu, 05/06/2021 – 17:10
via ZeroHedge News https://ift.tt/3h6oQNS Tyler Durden
